

Key Points
A cytokine pathway array has identified variants and functional interactive networks regulating platelet formation in stress thrombocytosis.
IFNA16 genetic variants behave as susceptibility loci in essential (but not reactive) thrombocytosis, limited to JAK2V617F-negative cohorts.

Abstract
Inflammatory stimuli have divergent effects on peripheral platelet counts, although the mechanisms of thrombocytopenic and thrombocytotic responses remain poorly understood. A candidate gene approach targeting 326 polymorphic genes enriched in thrombopoietic and cytokine signaling pathways was applied to identify single nucleotide variants (SNVs) implicated in enhanced platelet responses in cohorts with reactive thrombocytosis (RT) or essential (myeloproliferative neoplasm [MPN]) thrombocytosis (ET). Cytokine profiles incorporating a 15-member subset, pathway topology, and functional interactive networks were distinct between ET and RT, consistent with distinct regulatory pathways of exaggerated thrombopoiesis. Genetic studies using aggregate (ET + RT) or ET-restricted cohorts identified associations with 2 IFNA16 (interferon-α16) SNVs, and the ET associations were validated in a second independent cohort (P = .0002). Odds ratio of the combined ET cohort (n = 105) was 4.92, restricted to the JAK2V617F-negative subset (odds ratio, 5.01). ET substratification analysis by variant IFNA16 exhibited a statistically significant increase in IFN-α16 levels (P = .002) among 16 quantifiable cytokines. Recombinantly expressed variant IFN-α16 encompassing 3 linked non-synonymous SNVs (E65H95P133) retained comparable antiviral and pSTAT signaling profiles as native IFN-α16 (V65D95A133) or IFN-α2, although both native and variant IFN-α16 showed stage-restricted differences (compared with IFN-α2) of IFN-regulated genes in CD34+-stimulated megakaryocytes. These data implicate IFNA16 (IFN-α16 gene product) as a putative susceptibility locus (driver) within the broader disrupted cytokine network evident in MPNs, and they provide a framework for dissecting functional interactive networks regulating stress or MPN thrombopoiesis.
Introduction
Megakaryocytopoiesis and proplatelet formation represent progressively linked stages of hematopoietic stem cell (HSC) development that maintain the normal circulating pool of platelets, critical components of normal hemostasis, pathologic thrombosis, and host adaptive immunologic responses.1-3 Mechanisms regulating normal thrombopoiesis are distinct from those occurring during stress, with evidence that a genetically distinct subset of megakaryocyte (MK)-committed progenitors are mobilized during inflammatory stimuli.4 Indeed, pathologically exaggerated platelet production (reactive thrombocytosis [RT]) is generally classified as a stimulus-dependent phenomenon occurring in the setting of cytokine release.5,6 Similarly, inflammatory dysregulation is evident in thrombocytosis-associated myeloproliferative neoplasms (MPNs) occurring in conjunction with constitutive activation of the Jak/Stat pathway.7-9 Whether cytokines in MPNs function as disease drivers in the setting of predisposition alleles10-12 or as sequelae of clonal hematopoietic expansion remains unestablished. Inflammatory triggers on the background of JAK2 susceptibility loci have been suggested as initiating stimuli for sustained expansion of JAK2V617F mutant clones, either secondary to hypermutable somatic mutagenesis or expansion of cells with preexisting mutant alleles. Interestingly, the JAK2 susceptibility locus has also been associated with Crohn’s disease,13 further implicating dysregulated cytokine stimulation as pathogenetic drivers for inflammatory bowel disease.
Thrombopoiesis is primarily regulated by the thrombopoietin (TPO)/c-mpl receptor/ligand system, although there is little explanation for the genetic variability of platelet counts in normal and diseased subjects. The normal range of platelet counts in humans is broad (1.5 × 10⁸/mL to 3.5 × 10⁸/mL) and remarkably constant over time, with coefficients of variation of 6.7% in male subjects and 8.6% in female subjects.14 Twin studies indicate that genetic factors account for normal variation of platelet counts in the healthy population,15,16 although the associated genes remain unidentified. Limited studies have focused on polymorphisms within c-mpl as platelet modifier genes,17 and genome-wide association studies (GWAS) have identified candidate single nucleotide variants (SNVs) that may influence the number and size (mean platelet volume) of platelets18 and/or red blood cells.19 More recent studies have expanded the subset of SNV loci that account for 18% and 30%, respectively, of platelet count and mean platelet volume variability.20 Despite this progress, a preponderance of genetic modifiers regulating physiological platelet production remains uncharacterized, and identification of genetic loci that modulate stress-associated platelet production is specifically unknown.
Inflammation induces widely variable patterns of cytokine release, although downstream cellular effects are mediated by shared cytokine and hematopoietic signaling pathways.4,21 The current study applies a candidate gene approach to dissect the role of cytokine pathway SNVs as genetic modifiers of enhanced thrombopoiesis. A custom SNV array encompassing nonredundant cytokine signaling pathway genes identified variants and distinct functional networks differentially associated with RT or essential thrombocytosis (ET) cohorts, and a predominant IFNA16 (interferon-α16) predisposition locus in ET validated in a second, unrelated cohort. These data provide the first comprehensive study of cytokine pathway variants implicated in exaggerated thrombopoietic responses in humans, and they provide a framework for further dissecting the complex interplay of regulatory networks linked to inflammatory stimuli.
Materials and methods
Human subjects
All subjects (ET, n = 106; RT, n = 56; healthy control subjects, n = 224) were enrolled in a protocol approved by the Stony Brook University Institutional Review Board that was conducted in accordance with the Declaration of Helsinki,22 applying well-established clinical criteria for phenotypic classification.23,24 ET recruitment was completed in 2 phases, Cohort 1 (n = 52 was used for initial genotyping and association studies), followed by a second validation phase (Cohort 2, n = 54), under the auspices of Institutional Review Board #88960 (Platelet Systems Biology in Health and Disease).
SNV selection, genotyping, and statistical analyses
Peripheral blood high-molecular weight genomic DNA was used for genotyping, CALR insertion/deletion detection,25 and JAK2V617F allelic quantification. Genotyping was completed by using a custom SNV array encompassing discrete pathways implicated in hematopoietic cytokine signaling21 and thrombopoiesis: (1) the TPO/c-mpl (TPO/TPO receptor) pathway; (2) the JAK/STAT pathway; (3) a steroidogenic pathway previously implicated in thrombocytosis26 ; and (4) platelet-modifier SNVs implicated in platelet function27 or thrombopoiesis (mean platelet volume or number) based on human GWAS.18 Details of the 326 gene/1056 SNV list are provided in supplemental Table 1. Samples were blinded to case-control, and call rates ranged between 97.0% and 99.5%; platform reliability and quality control were established by using 10 randomly duplicated samples with concordance >98%. Pyrosequencing was used for JAK2V617F allelic determination (defining homozygosity by >95% mutant A alleles) and as a secondary validation step for a subset of eight SNVs (genes and oligonucleotide primers provided in supplemental Table 2). Assay design and allelic discrimination were completed by using PyroMark software version 2.0.1.15 (Qiagen, Germantown, MD), with sensitivity of mutant allele detection ∼3%; concordance between genotyping and pyrosequencing was >98%. Focused nucleotide confirmation of IFNA16 was established by dideoxy sequence analysis.
For each SNV, genotype frequencies were delineated and excluded from association studies for sample call rates <70% or for failure to meet Hardy-Weinberg equilibrium. SNV case-control data were analyzed by using the χ2 test, Fisher’s exact test, or the Cochran-Armitage trend test, using distinct genetic models (allelic, dominant, and recessive), substratified according to phenotype (ET alone, RT alone, or ET + RT) and a common control subset; Cohort 1 and Cohort 2 recruitment proceeded independently with no subject overlap. Association testing of ET, odds ratios (ORs), and confidence intervals (CIs) were computed in R package (version 3.6.2). Sample size validation of association testing was established by including five JAK2 SNVs as internal controls for ET genetic susceptibility, with a post hoc power analysis of 0.77 at the significance levels of 0.05 (one-sided).10 Statistical comparisons were completed by using analysis of variance or t tests (or their nonparametric counterparts if the normality assumptions were not met) at the significance level of P < .05 adjusted for the false discovery rate.28
Cytokine measurements
Cytokines analyzed in this study were selected from a broad group of inflammation-related cytokines based on 3 criteria: (1) demonstrated role in thrombosis-related inflammation29,30 ; (2) dysregulated expression patterns in ET and/or RT29,31,32 ; and (3) availability of sensitive and robust detection methods. Plasma cytokines were measured by using multiplex, bead-based immunoassays (ProcartaPlex; Thermo Fisher Scientific, Waltham, MA), or IFN-α16 was quantified by using capture enzyme-linked immunosorbent assay (MyBioSource, Inc., San Diego, CA). Sample concentrations were determined in duplicate by using standard curves run in parallel.
Expression and functional characterization of IFN-α16
Recombinant human IFN-α16 wild-type (IFN-α16WT) or mutant (IFN-α16MUT) were expressed and purified as C-terminal His6-Strep chimeric proteins in Escherichia coli Origami2 DE3 cells. Recombinant proteins were serially purified by tandem affinity purification, and after cleavage from carriers, bacterial endotoxin was removed by using a high-capacity endotoxin removal spin column (Thermo Fisher Scientific). IFN-α protein concentrations were quantified, stabilized with purified bovine serum albumin (final concentration 0.1%), and stored at −80°C. IFN-α antiviral activity was determined by using adenovirus type 5–infected human diploid fibroblasts (HDF/Tert1), whereas cellular pSTAT1 activation was established by using A549 (lung epithelial), human diploid fibroblast (HDF/tert1), or primary human CD34+ cells incubated for 1 hour with 500 U/mL human universal type I IFN-α2 (PBL Assay Science, Piscataway, NJ), or equimolar concentrations (50 ng/mL) of IFN-α16WT or IFN-α16MUT. Primary antibodies were directed against phosphorylated STAT1 (Y701) and total STAT1 (Cell Signaling Technology, Danvers, MA), or α-tubulin (as loading control; MilliporeSigma, Burlington, MA), followed by immunodetection using appropriately conjugated secondary antibodies.
Hematopoietic and cellular studies
Human CD34+ HSCs obtained from umbilical cord blood and CD34+ immunoselection contained >95% CD34+ cells at the start of individual experiments. CD34+ cells were cultured in serum-free expansion medium II expansion medium for 24 to 48 hours followed by terminal MK differentiation using serum-free serum-free expansion medium media containing MK expansion supplement CC220 (Stemcell Technologies, Vancouver, BC, Canada), supplemented (or not) every 48 hours with individual IFNs (500 U/mL human universal type I IFN-α2), or equimolar concentrations (50 ng/mL) of IFN-α16WT or IFN-α16MUT. At distinct time points, cells were stimulated (or not) with the same concentration of IFNs for 60 minutes, followed by RNA isolation and quantitation using fluorescence-based real-time polymerase chain reaction technology (TaqMan Real-Time PCR; Applied Biosystems, Foster City, CA).33 Oligonucleotide primers are provided in supplemental Table 2. Cell differentiation was monitored by flow cytometry, gating on live 7-actinomycin D–negative cells for immunophenotypic quantification and lineage specification, using fluorescein isothiocyanate–conjugated anti-CD41a (integrin αIIb, MK) or Annexin V as a marker of phosphatidylserine exposure and apoptosis.34,35
Computation and bioinformatics
Pathway enrichment36 and functional interactive networks were generated by using the set of phenotype-restricted genetic variants associated with ET or RT. Because multiple SNVs were variably represented within the same gene, interactive networks were built by using the global adaptive rank truncated product method, which allows for different modes of inheritance and multiple SNVs associated with individual genes.37 Sources for construction of the interactive networks included well-curated databases (Reactome, Kyoto Encyclopedia of Genes and Genomes, and Human PPI), which were trained and validated by using a naive Bayes classifier.
All statistical analyses, including gene expression, cytokine quantification, and principal component analysis (PCA), were conducted in the R program environment as previously described,9,34 using normalized (log2-transformed) data and clustering (on Euclidean space) for cross-group comparisons, defining a significance level of P < .05 adjusted for the false discovery rate.28
Additional detailed Methods are provided in the supplemental Materials and methods.
Results
Targeted gene/SNV identification
We dissected the role of cytokine pathway SNVs as genetic modifiers of enhanced thrombopoiesis by generating a custom SNV array incorporating 1056 SNVs within 326 genes collectively implicated in hematopoietic cytokine receptor signaling. The non-redundant gene/SNV list was modified to incorporate quantitative trait loci associated with parameters of platelet function27 or megakaryocytopoiesis,18,26 and included SNVs within the JAK2 susceptibility locus,10 which served as known association controls for ET predisposition. Of the 1056 SNVs, 949 encompassed within 311 genes passed technically required screening characteristics using Illumina chips (San Diego, CA), and they conformed to Hardy-Weinberg equilibrium predictions based on SNV distributions formulated from the 1000 Genomes database (Figure 1A). Overrepresentation analysis using the curated gene list confirmed enrichment of genetic pathways involved in immune regulation, signal transduction, development, and hemostasis (Figure 1B).
![Genotyping overview. (A) Work-flow schema showing clinical characteristics and genotyping strategy. (B) Genetic overrepresentative analysis (N = 311 genes) was completed by using Reactome,36 and enriched pathways are highlighted in yellow. (C-E) Genome-wide association plots (aggregate ET and RT [C], ET [D], and RT [E]) detailing significant gene/SNVs (at P < .01) identified by dominant, allelic, or recessive models; the most significant gene/SNVs (P < .001) are in red (Table 1). HWE, Hardy-Weinberg equilibrium; NA, not available.](https://ash.silverchair-cdn.com/ash/content_public/journal/bloodadvances/6/16/10.1182_bloodadvances.2021005648/1/m_advancesadv2021005648f1.png?Expires=1767739706&Signature=X1hrHarYqkRzqJ2w6S5iAR3~ijvNtto2pSZ5ViSHOLqce68Cqs9U9x5-JMALp8oIuYGmdLfXjFBi5mTeMatKp34CdcgGFcaUnHFEWNNZLv1dDOcpbMDQ8QXJi8kvloU~D3oCB1ffCAwTrVey9w4saw86xqGftgwceqSzGVxYUgFYOdvqNXR6A4UeKd0QEqmvsxHce44exil-0-2eutqb9aXKqEvYZRc-ui1y7CE2jhWNJnv~6zDnB7Gu7GPEKNEB8hAEwJd77uobFunb~IffhyxSgZdYdgpwtYL2rqddg4qLRjJgL~qI8nfQf4a3EftjpHR9xilp1y~BTEir7D-6dw__&Key-Pair-Id=APKAIE5G5CRDK6RD3PGA)
Genotyping overview. (A) Work-flow schema showing clinical characteristics and genotyping strategy. (B) Genetic overrepresentative analysis (N = 311 genes) was completed by using Reactome,36 and enriched pathways are highlighted in yellow. (C-E) Genome-wide association plots (aggregate ET and RT [C], ET [D], and RT [E]) detailing significant gene/SNVs (at P < .01) identified by dominant, allelic, or recessive models; the most significant gene/SNVs (P < .001) are in red (Table 1). HWE, Hardy-Weinberg equilibrium; NA, not available.
Genotyping overview. (A) Work-flow schema showing clinical characteristics and genotyping strategy. (B) Genetic overrepresentative analysis (N = 311 genes) was completed by using Reactome,36 and enriched pathways are highlighted in yellow. (C-E) Genome-wide association plots (aggregate ET and RT [C], ET [D], and RT [E]) detailing significant gene/SNVs (at P < .01) identified by dominant, allelic, or recessive models; the most significant gene/SNVs (P < .001) are in red (Table 1). HWE, Hardy-Weinberg equilibrium; NA, not available.
Genotype association studies
Genotyping was initially completed on 224 healthy control subjects and 108 subjects with thrombocytosis. Thrombocytosis cohorts were phenotypically categorized according to etiology as a means of further establishing risk stratified by reactive (RT, n = 56) or MPN-associated (ET, n = 52) subtypes. Case-control association studies using dominant, allelic, or recessive models applied to the aggregate (ie, ET and RT) data set showed the strongest associations with immune-regulated (IFNA16 rs28368163) or cytokine (IL6 rs2069824, IL10RB rs17860266) pathway SNVs (Figure 1C-E; Table 1; supplemental Table 3). Associations with IL6 rs2069824 and IFNA16 rs28368163 reached greater statistical significance in the ET cohorts than in the aggregated cohort; technical validation of the most significant IFNA16 rs28368163 SNV was confirmed by pyrosequencing. Not surprisingly, the RT cohort displayed gene/SNV associations that were distinct from ET, most significant for SHP2 rs8191984, EP300 rs12628803 (validated by pyrosequencing), STAT2 rs2066809, and IL10RB rs17860266; IL10RB rs17860266 identified in the aggregate cohort retained its strongest association in the RT (and not ET) cohort. The protein tyrosine phosphatase SHP2 (PTPN11), adenovirus E1A–associated cellular transcriptional coactivator EP300, and STAT2 collectively regulated cellular proliferation, with evidence that EP300 functionally regulates megakaryocytopoiesis in mpl−/− (myeloproliferative leukemia protein) mice.38
Gene/SNV association studies according to cohort
| ET and RT | ET | RT | |||||||||
|---|---|---|---|---|---|---|---|---|---|---|---|
| SNV | Gene | P | Model* | SNV | Gene | P | Model | SNV | Gene | P | Model |
| rs28368163 | IFNA16 | .000283 | A | rs28368163 | IFNA16 | 7.80 × 10⁻⁵ | A | rs8191984 | SHP2 | .000373 | A |
| rs17860266 | IL10RB | .000368 | A | rs2069824 | IL6 | 8.34 × 10⁻⁵ | A | rs12628803 | EP300 | .000381 | A |
| rs2069824 | IL6 | .000377 | A | rs2280583 | STAM | .001066 | D | rs2066809 | STAT2 | .000406 | A |
| rs72862555 | VIPR1 | .000392 | A | rs6072296 | PLCG1 | .001215 | D | rs17860266 | IL10RB | .000559 | A |
| rs3087209 | IL2 | .001225 | D | rs2336384 | MFN2 | .001395 | A | rs581950 | PI3K | .001202 | A |
| rs3822430 | SRD5A1 | .001728 | R | rs28368160 | IFNA16 | .001505 | D | rs28691160 | CALM1 | .001378 | A |
| rs35835913 | CBLB | .002254 | A | rs34417936 | IL6ST | .002258 | D | rs3217921 | CCND2 | .001664 | A |
| rs149698066 | BLVRB | .002581 | D | rs1045000 | AP-1 | .002473 | A | rs35835913 | CBLB | .001664 | A |
| rs34417936 | IL6ST | .002914 | A | rs6723506 | UGT1A1 | .003189 | D | rs72862555 | VIPR1 | .001671 | A |
| rs2336384 | MFN2 | .004046 | A | rs10849023 | CCND2 | .003374 | R | rs35504537 | SOCS4 | .003172 | A |
| rs10076470 | SRD5A1 | .005248 | A | rs8179183 | LEPR | .003642 | A | rs75887164 | P2RX1 | .003301 | A |
| rs166049 | SRD5A1 | .005722 | A | rs12340895 | JAK2 | .005952 | A | rs140463378 | TBXAS1 | .004211 | A |
| rs12628803 | EP300 | .006147 | A | rs3737224 | PEAR1 | .006491 | R | rs149698066 | BLVRB | .00428 | D |
| rs3217921 | CCND2 | .006147 | A | rs72862555 | VIPR1 | .006491 | D | rs7689953 | TEC | .004382 | A |
| rs8191984 | SHP2 | .00647 | A | rs1008084 | CCDC162P | .008285 | R | rs4252249 | IL10RA | .004565 | D |
| rs2066809 | STAT2 | .006477 | A | rs1800797 | IL6 | .008654 | R | rs1051442 | THBS1 | .004586 | R |
| rs28368160 | IFNA16 | .007803 | D | rs12343867 | JAK2 | .008962 | A | rs2572207 | DENND4A | .004676 | A |
| rs7732059 | GHR | .010701 | D | rs3780367 | JAK2 | .009638 | A | rs35695978 | HSD17B4 | .004871 | A |
| rs4252249 | IL10RA | .011014 | A | rs904011 | FDFT1 | .010497 | D | rs13244259 | WBSCR22 | .005213 | A |
| rs1800797 | IL6 | .011145 | R | rs166049 | SRD5A1 | .011011 | A | rs74474807 | GNAS | .006456 | A |
The top SNVs (N = 20 per cohort) rank-ordered according to P value.
Genetic model applied for association testing: allelic (A), dominant (D), and recessive (R).
Pathway topology identifies functionally diverse thrombocytosis interaction networks
The initial association data imputed the presence of distinct pathways regulating enhanced platelet formation in pathogenetically divergent thrombocytosis phenotypes; these results were confirmed by pathway enrichment analyses36 applied to the ET and RT gene sets. The phenotypes converged on a limited subset of overlapping pathways (n = 39) encompassing immune and cytokine signaling (Figure 2A-B), although the most significant RT- or ET-restricted pathways were distinct. Pathways enriched in RT (but not ET) included platelet-derived growth factor, fibroblast growth factor, and calcium signaling, whereas the 10 most significant ET-restricted pathways included IFN signaling (n = 3) or regulation by peroxisome proliferator–activated receptor α (n = 2).
![Pathway topology and functional interaction networks in ET and RT. (A-B) Venn diagram delineating pathway overrepresentation analysis using significantly associated (P < .05) ET and RT gene/SNVs (A) and top 10 pathways each for common, ET-, or RT-restricted phenotypes (B). Scale bar (adjusted.P) is shown. (C-D) Functional interaction networks in ET and RT were generated by applying global adaptive rank truncated product method to the SNV association data.37 For the nodes, genes are represented by round symbols, and node color reflects the adjusted P value28 on a continuous scale from low (light green) to high (dark blue). Gray-colored round symbols identify first-order interactors, and core genes not connected to the main network are omitted. The ET network includes 12 core genes (encompassing 127 nodes and 362 edges), and the RT network includes 26 core genes (encompassing 150 nodes and 633 edges). Scale bar [(−log10(adjusted.P)] is shown. FGFR, fibroblast growth factor receptor; PDGF, platelet-derived growth factor.](https://ash.silverchair-cdn.com/ash/content_public/journal/bloodadvances/6/16/10.1182_bloodadvances.2021005648/1/m_advancesadv2021005648f2.png?Expires=1767739706&Signature=okbpDkSa8Jqlp91i1qz9uLsNW8BDfmk-BqEUXrrguWFVNjW65QvWhp-2SBH2rF~IU7v2IZgtQCk3FT6ljTy8JZ6NZ3i69us2JRao-ZgLiQ6wXxWKti1uCeiadGGLK3bW1FHJQyPON-m4Bf4WTzSYhP1rfhkrlVG-9eMuInlsJhDNXC1mX2Ma7vpSYvMghhlBS~2p~MSdm1XB1yoYQbgw2PVD3X97fd7P6opFnudXSYj5k7aVl5~j-0R~h9rSbBk7~sOquVnveezYQy8Nts~zj4VzYMt-I2uKh8P6fuhXGhPgJa-TMYRvMiGBg-Vrs6Q4CEZm47Sc9qFD5nAtw~ZC1A__&Key-Pair-Id=APKAIE5G5CRDK6RD3PGA)
Pathway topology and functional interaction networks in ET and RT. (A-B) Venn diagram delineating pathway overrepresentation analysis using significantly associated (P < .05) ET and RT gene/SNVs (A) and top 10 pathways each for common, ET-, or RT-restricted phenotypes (B). Scale bar (adjusted.P) is shown. (C-D) Functional interaction networks in ET and RT were generated by applying global adaptive rank truncated product method to the SNV association data.37 For the nodes, genes are represented by round symbols, and node color reflects the adjusted P value28 on a continuous scale from low (light green) to high (dark blue). Gray-colored round symbols identify first-order interactors, and core genes not connected to the main network are omitted. The ET network includes 12 core genes (encompassing 127 nodes and 362 edges), and the RT network includes 26 core genes (encompassing 150 nodes and 633 edges). Scale bar [(−log10(adjusted.P)] is shown. FGFR, fibroblast growth factor receptor; PDGF, platelet-derived growth factor.
Pathway topology and functional interaction networks in ET and RT. (A-B) Venn diagram delineating pathway overrepresentation analysis using significantly associated (P < .05) ET and RT gene/SNVs (A) and top 10 pathways each for common, ET-, or RT-restricted phenotypes (B). Scale bar (adjusted.P) is shown. (C-D) Functional interaction networks in ET and RT were generated by applying global adaptive rank truncated product method to the SNV association data.37 For the nodes, genes are represented by round symbols, and node color reflects the adjusted P value28 on a continuous scale from low (light green) to high (dark blue). Gray-colored round symbols identify first-order interactors, and core genes not connected to the main network are omitted. The ET network includes 12 core genes (encompassing 127 nodes and 362 edges), and the RT network includes 26 core genes (encompassing 150 nodes and 633 edges). Scale bar [(−log10(adjusted.P)] is shown. FGFR, fibroblast growth factor receptor; PDGF, platelet-derived growth factor.
Because genes rarely act alone, we applied the gene/SNV data to reconstruct synergistic effects of variants on functional interaction networks defining thrombopoiesis in RT and ET (Figure 2C-D). The ET network incorporates a smaller subset of core genes (n = 12) compared with the RT network (n = 26), implying that molecular pathways regulating thrombopoietic stimuli in RT display greater redundancy and are less centralized. Predicated on the network plot, ET-regulated thrombopoiesis appears to be largely controlled by integrated cytokine interactions involving IL2, IL6 (and its intracellular effector IL6ST), and immune mediators (ie, IFNs) that presumably synergize to amplify the thrombopoietic signaling repertoire linked to JAK2.
An IFNA16 susceptibility genotype in ET
Type 1 IFNs include 17 subtypes that encompass 13 IFN-α isoforms,39 whose genes are located within the IFN gene cluster on chromosome 9 (Figure 3). Two non-synonymous IFNA16 SNVs rs28368163 (397G>C, Ala133Pro) and rs28368160 (283G>C, Asp95His) were significantly associated with both aggregate and ET phenotypes but not with the RT phenotype; a contiguous IFNA16 SNV rs28368159 (194T>A, Val65Glu) included in the genotyping data were excluded from the association testing because of failed Hardy-Weinberg equilibrium. The SNV chip included 2 additional markers within the IFN gene cluster (IFNA17 [rs9298814] and IFNA5 [rs41298200]), allowing for association testing across these 5 markers; comparative testing across the JAK2 susceptibility locus served as a genetic standard for MPN risk (Figure 3A). The three IFNA16 markers (but neither centromeric IFNA5 nor IFNA17 SNVs) were in linkage disequilibrium, results confirmed by dideoxy sequencing of the ET cohort (Figure 3A-B); unavailability of parental genotyping data did not allow us to assign haplotypes. IFNA16 SNVs represented strong susceptibility alleles (Table 2): the IFNA16 rs28368163 OR was 5.40 (CI, 2.32-12.53), and the IFNA16 rs28368160 OR was 4.71 (CI, 1.77-11.81). ORs for both SNVs were greater than those of the JAK2 susceptibility SNVs (rs12340895 [OR, 2.13; CI, 1.14-3.97], rs12343867 [OR, 2.07; CI, 1.11-3.91], rs3780367 [OR, 1.95; CI, 1.04-3.65], rs10974944 [OR, 1.89; CI, 1.01-3.56], and rs1159782 [OR, 1.84; CI, 0.99-3.46]) and were in excellent agreement to those previously described (supplemental Table 4).10-12 RT was not associated with JAK2 predisposition alleles (or with JAK2V617F). IFNA16 genotyping substratified according to JAK2V617F status exhibited predisposition risk restricted to JAK2V617F-negative ET cohorts, evident for both rs28368163 (OR, 8.60; CI, 2.75-26.94; P = 2.01 × 10⁻⁵) and rs28368160 (OR, 7.84; CI, 2.35-26.21; P = .0001).
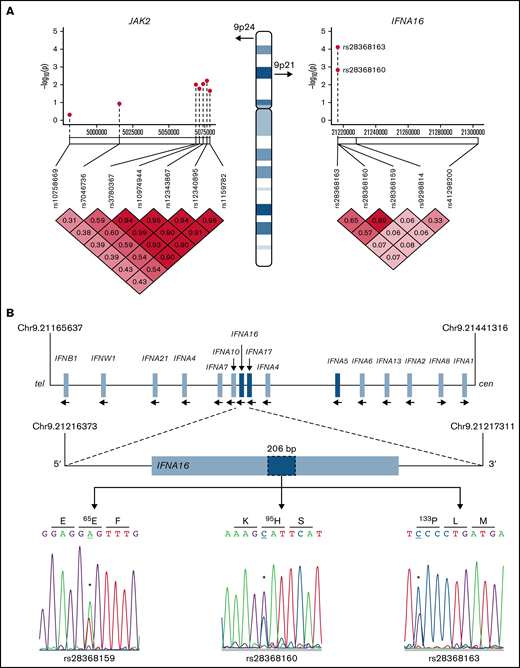
IFNA16 genetic characterization. (A) Chromosome 9 structure shows JAK2 and IFNA16 genomic regions and SNVs used for association analyses in the P value (−log10) scatter plots (n = 51). Note the stronger association of both IFNA16 SNVs compared with those of JAK2 SNVs. The accompanying linkage disequilibrium heatmap was generated by using pairwise χ2 test for 7 evaluable JAK2 SNVs or 5 evaluable IFNA SNVs (3, IFNA16; 1, IFNA17; 1, IFNA5) using the MPN genotyping data. Boxes indicate D values for SNV pairs. (B) Genomic organization of the IFN gene cluster and IFNA16 dideoxy sequence analysis delineating the 3 SNVs and their predicted translation products (all displayed 5′-3′ orientation using RefSeq NM_002173.3 as reference). For all sequences, the polymorphic transition is underscored and delineated by the asterisk. Chromosomal positions are based on National Center for Biotechnology Information Build 37 (GRCh37).
IFNA16 genetic characterization. (A) Chromosome 9 structure shows JAK2 and IFNA16 genomic regions and SNVs used for association analyses in the P value (−log10) scatter plots (n = 51). Note the stronger association of both IFNA16 SNVs compared with those of JAK2 SNVs. The accompanying linkage disequilibrium heatmap was generated by using pairwise χ2 test for 7 evaluable JAK2 SNVs or 5 evaluable IFNA SNVs (3, IFNA16; 1, IFNA17; 1, IFNA5) using the MPN genotyping data. Boxes indicate D values for SNV pairs. (B) Genomic organization of the IFN gene cluster and IFNA16 dideoxy sequence analysis delineating the 3 SNVs and their predicted translation products (all displayed 5′-3′ orientation using RefSeq NM_002173.3 as reference). For all sequences, the polymorphic transition is underscored and delineated by the asterisk. Chromosomal positions are based on National Center for Biotechnology Information Build 37 (GRCh37).
IFNA16 SNV ORs substratified according to JAK2V617F
| Gene | SNV | Alleles | P | OR* | 95% CI | ||
|---|---|---|---|---|---|---|---|
| Cohort 1 (n = 52) | |||||||
| IFNA16 | rs28368163 | G/G† | GC | CC | |||
| Aggregate | 38 (74.5%) | 12 (23.5%) | 1 (2.0%) | 2.23 × 10⁻⁵ | 5.40 | 2.32-12.53 | |
| JAK2V617F+ | 24 (47.0%) | 5 (9.8%) | 1 (2.0%) | .49‡ | 0.26‡ | 0.00-14.69 | |
| JAK2V617F– | 11 (21.6%) | 6 (11.8%) | 0 (0%) | 2.01 × 10⁻⁵ | 8.60 | 2.75-26.94 | |
| IFNA16 | rs28368160 | G/G | GC | CC | |||
| Aggregate (N = 46) | 37 (80.4%) | 9 (17.7%) | 0 (0%) | .0004 | 4.71 | 1.87-11.81 | |
| JAK2V617F+ | 25 (54.4%) | 4 (7.8%) | 0 (0%) | .36‡ | 0.18‡ | 0.00-10.09‡ | |
| JAK2V617F– | 12 (26.1%) | 5 (9.8%) | 0 (0%) | .0001 | 7.84 | 2.35-26.21 | |
| Cohort 2 (n = 54) | |||||||
| IFNA16 | rs28368163 | G/G | GC | CC | |||
| Aggregate | 42 (77.8%) | 12 (22.2%) | 0 (0%) | .0002 | 4.51 | 1.92-10.56 | |
| JAK2V617F+ | 25 (46.3%) | 9 (16.7%) | 0 (0%) | .62‡ | 0.37‡ | 0.00-20.1‡ | |
| JAK2V617F– | 17 (31.5%) | 3 (5.6%) | 0 (0%) | .12 | 2.78 | 0.72-10.73 | |
| Cohort 1+cohort 2 (n = 105) | |||||||
| IFNA16 | rs28368163 | G/G | GC | CC | |||
| Aggregate | 80 (76.2%) | 24 (22.9%) | 1 (0.96%) | 3.23 × 10⁻⁶ | 4.92 | 2.40-10.10 | |
| JAK2V617F+ | 49 (46.7%) | 14 (13.3%) | 1 (0.96%) | .31‡ | 0.55‡ | 0.00-16.45‡ | |
| JAK2V617F– | 28 (26.7%) | 9 (8.6%) | 0 (0%) | .0002 | 5.01 | 1.98-12.94 | |
The χ2 test using genotyped controls (N = 218).
C, minor (variant) allele; G, major allele.
Haldane-Anscombe correction.
For confirmation, we applied IFNA16 rs28368163 as a tag SNV in a second ET validation cohort (n = 54) and reconfirmed a highly significant association (P = .0002) and OR (4.51; CI, 1.92-10.56), nearly identical to that found in Cohort 1 (Table 2). Consistent with results in Cohort 1, substratification revealed no association in JAK2V617F cohorts; in contrast, association within the JAK2V617F-negative cohort was less robust, approaching statistical significance (P = .12) with a less robust OR (2.78; CI, 0.72-10.73). Combined IFNA16 rs28368163 data incorporating both cohorts (n = 105 subjects) confirmed the overall association (OR, 4.92; CI, 1.92-10.56) and the specificity with JAK2V617F-negative ET (OR, 5.01; CI, 1.98-12.94). These collective data showed that: (1) IFNA16 SNVs represent significant ET predisposition alleles10 ; and (2) ET susceptibility was largely restricted to JAK2V617F-negative ET. These results were distinct from those previously described for the JAK2 predisposition haplotype, which selectively confers hypermutability to JAK2V617F expansion.10-12
Comparative cytokine profiles across the thrombocytosis spectrum
We characterized RT and MPN-associated “inflammasomes” by measuring 15 cytokines in a randomly selected subset of ET (n = 20), RT (n = 18), and healthy cohorts (n = 14), focusing on IFNs (α-, β-, γ-), various interleukins (ILs), and components of the tumor necrosis factor (TNF) receptor pathway previously identified in thrombosis-related inflammation29,30 or thrombocytosis.29,31,32 Unsupervised hierarchical clustering using the aggregate cytokine data confirmed general segregation according to phenotype (Figure 4A), with statistically significant cross-group differences for the majority (13 of 15) of cytokines measured. PCA designed to reduce the data dimension revealed overlapping clusters of healthy control and RT cohorts, and relative segregation of ET cohorts that were broadly distributed along the PCA spectrum (Figure 4B). ET cytokine determinations generally displayed a broader intersample dynamic range than those from RT or healthy control subjects. Compared with both RT and healthy control subjects, cytokines were generally elevated in ET subjects, and pairwise comparisons established that 11 of 15 cytokines were statistically different between the ET and RT cohorts (Figure 4C). Binary logistic Least Absolute Shrinkage and Selection Operator regression reduced the cytokine profile to a 4-member subset (CD30, IL-10, TNF receptor 1, and TNF-α) that optimally distinguished ET from healthy cohorts, and a distinct 4-member subset that distinguished ET from RT (Tweak, IL1RA, TSLP, and TNF receptor 2 cytokine). Within the ET cohort, repeat PCA substratified according to IFNA16 rs28368163 or JAK2V617F genotypes failed to generate meaningful separation (Figure 4D-E), imputing the lack of IFNA16- or JAK2V617F-restricted mean differences for the cytokines studied. Thus, although the cytokine profiles are clearly different between ET and RT, these data further established that neither JAK2V617F nor IFNA16 rs28368163 independently partitioned the cytokine abnormalities evident in ET.
![Cytokine studies in thrombocytosis. (A) Cytokines (n = 15) were quantified from ET (n = 20), RT (n = 18), or healthy controls (n = 14), and the normalized data (centered and scaled) were used for unsupervised hierarchical clustering using aggregated data; P values corresponding to group differences were determined by using Kruskal-Wallis tests); scale bar is shown. (B) PC analysis was applied to cytokine levels for data reduction, and iteratively applied to ET, RT, or healthy cohorts; note the general segregation of ET from RT and healthy controls. (C) Box plots show normalized cytokine levels by cohort; group-wise (upper panels) and statistically different pairwise P values are shown. (D-E) PC analysis applied to cytokine levels was iteratively applied to ET cohorts delineated by JAK2V617F (D) or IFNA16 rs28368163 genotype (E). In both panels D and E, mutant alleles are in red. (F-H) IFN-α16 was quantified by enzyme-linked immunosorbent assay from ET (n = 19 [1 of 20 samples was censored for a technical limitation]) and healthy controls (n = 20), substratified according to IFNA16 or JAK2V617F genotype. Mutant alleles in panels G and H are in red. P values using the t test are shown. *P < .05, **P < .01, ***P < .001, ****P < .0001. CD258, tumor necrosis factor superfamily member 14; CD30, TNF receptor superfamily member 8; IFN, IFNs α, β, γ; IL, interleukins 6, 8, 10, or 1β; IL1RA, IL-1 receptor antagonist; N.S., not significant; TNFα, tumor necrosis factor α; TNFRI, TNF receptor type 1 cytokine; TNFRII, TNF receptor 2 cytokine; TSLP, thymic stromal lymphopoietin; Tweak, TNF-like weak inducer of apoptosis.](https://ash.silverchair-cdn.com/ash/content_public/journal/bloodadvances/6/16/10.1182_bloodadvances.2021005648/1/m_advancesadv2021005648f4.png?Expires=1767739706&Signature=SeotWGhHqVx47M8wEq9kK2pcLYPFYV1W7MjsUvXikLPuznfMfXQW2pOfCutafEEzi1z19KMOVuWDvuRtVCF3qcHho~rN7HtFyLx2PQvRekxroJPykQDkY21VwmqqbE~xO4EDtMBy9EmavCC2JeQ0kIZBwVMDiNgc~SF-9csOdSs9AKsqmW3ZSNwRiCKAFtWZPLj-Mea3lXoO4PDJpwVeNDg~63nfjxYeDvkZJIPor-y5SP3WESP-C90dm5AVUP8ve3lyEv4Cafn54oFYAOwzPLBJHQMVjhuUPp7OcnyTLBEfjc7ujwjSYT9hmhKcyxoYSKK9PrDrXBahNjO9PSnxUQ__&Key-Pair-Id=APKAIE5G5CRDK6RD3PGA)
Cytokine studies in thrombocytosis. (A) Cytokines (n = 15) were quantified from ET (n = 20), RT (n = 18), or healthy controls (n = 14), and the normalized data (centered and scaled) were used for unsupervised hierarchical clustering using aggregated data; P values corresponding to group differences were determined by using Kruskal-Wallis tests); scale bar is shown. (B) PC analysis was applied to cytokine levels for data reduction, and iteratively applied to ET, RT, or healthy cohorts; note the general segregation of ET from RT and healthy controls. (C) Box plots show normalized cytokine levels by cohort; group-wise (upper panels) and statistically different pairwise P values are shown. (D-E) PC analysis applied to cytokine levels was iteratively applied to ET cohorts delineated by JAK2V617F (D) or IFNA16 rs28368163 genotype (E). In both panels D and E, mutant alleles are in red. (F-H) IFN-α16 was quantified by enzyme-linked immunosorbent assay from ET (n = 19 [1 of 20 samples was censored for a technical limitation]) and healthy controls (n = 20), substratified according to IFNA16 or JAK2V617F genotype. Mutant alleles in panels G and H are in red. P values using the t test are shown. *P < .05, **P < .01, ***P < .001, ****P < .0001. CD258, tumor necrosis factor superfamily member 14; CD30, TNF receptor superfamily member 8; IFN, IFNs α, β, γ; IL, interleukins 6, 8, 10, or 1β; IL1RA, IL-1 receptor antagonist; N.S., not significant; TNFα, tumor necrosis factor α; TNFRI, TNF receptor type 1 cytokine; TNFRII, TNF receptor 2 cytokine; TSLP, thymic stromal lymphopoietin; Tweak, TNF-like weak inducer of apoptosis.
Cytokine studies in thrombocytosis. (A) Cytokines (n = 15) were quantified from ET (n = 20), RT (n = 18), or healthy controls (n = 14), and the normalized data (centered and scaled) were used for unsupervised hierarchical clustering using aggregated data; P values corresponding to group differences were determined by using Kruskal-Wallis tests); scale bar is shown. (B) PC analysis was applied to cytokine levels for data reduction, and iteratively applied to ET, RT, or healthy cohorts; note the general segregation of ET from RT and healthy controls. (C) Box plots show normalized cytokine levels by cohort; group-wise (upper panels) and statistically different pairwise P values are shown. (D-E) PC analysis applied to cytokine levels was iteratively applied to ET cohorts delineated by JAK2V617F (D) or IFNA16 rs28368163 genotype (E). In both panels D and E, mutant alleles are in red. (F-H) IFN-α16 was quantified by enzyme-linked immunosorbent assay from ET (n = 19 [1 of 20 samples was censored for a technical limitation]) and healthy controls (n = 20), substratified according to IFNA16 or JAK2V617F genotype. Mutant alleles in panels G and H are in red. P values using the t test are shown. *P < .05, **P < .01, ***P < .001, ****P < .0001. CD258, tumor necrosis factor superfamily member 14; CD30, TNF receptor superfamily member 8; IFN, IFNs α, β, γ; IL, interleukins 6, 8, 10, or 1β; IL1RA, IL-1 receptor antagonist; N.S., not significant; TNFα, tumor necrosis factor α; TNFRI, TNF receptor type 1 cytokine; TNFRII, TNF receptor 2 cytokine; TSLP, thymic stromal lymphopoietin; Tweak, TNF-like weak inducer of apoptosis.
Evolutionary duplication of 13 highly homologous IFN-α subtypes results in a largely redundant mechanism for viral neutralization and cellular effects. We saw no differences in aggregate serum IFN-α levels in ET cohorts using a multiplex bead assay (discussed earlier) but expanded these studies using an enzyme-linked immunosorbent assay designed to specifically quantify IFN-α16 (Figure 4F-H). Although IFN-α16 levels between ET and normal were nearly identical, substratification according to IFNA16 rs28368163 revealed statistically greater concentrations in ET cohorts expressing the mutant C allele (P = .002); in contrast, IFN-α16 differences substratified according to JAK2V617F were not evident. These results established that among the cytokines quantified, only ET IFN-α16 concentrations were associated with the presence of the mutant IFNA16 SNV.
Expression studies of IFN-response genes in ET platelets
Given the evidence for immune and cytokine disruption in ET, we applied inflammatory and IFN-restricted gene sets40 to initially characterize downstream cellular effects on ET platelet signatures using previously generated RNA-Sequencing (RNA-Seq) data35 (Figure 5A-B); these initial analyses were designed to address putative cellular responses in targets (MKs/platelets) exposed to altered cytokine signaling. Unsupervised hierarchical clustering showed clear segregation of ET and healthy control platelets using both gene sets, with further evidence for downregulation of IFN genes in ET platelets (Figure 5C). For a subset of IFN-regulated genes (IRGs) (Figure 5D),41,42 we validated these patterns in a second unrelated cohort (ET, n = 8; normal, n = 4) using a gene subset that is induced during stress hematopoietic models (IFIT1, IFITM3, MX1, ISG15, IFRD1, and OAS1).4 Consistent with the RNA-Seq data, the majority (four of six IRGs [IFIT1, OAS1, MX1, and ISG15]) were downregulated in ET compared with normal platelets (P = .07 to P = .004); only IFITM3 was upregulated in ET (2.8-fold) and approached statistical significance (P = .07). We saw no evidence for differential platelet factor 4 (PF4) expression, although VWF (von Willebrand factor) as a marker of MK-biased stress hematopoiesis identified in inflammatory disorders4 was upregulated in ET (4.4-fold; P = .02). These genetic expression studies established that the dysfunctional ET cytokine profiles were associated with concomitant target cellular effects in MKs/platelets, with further evidence for defective IFN IRG signatures, possibly mediated by IFN-α16.
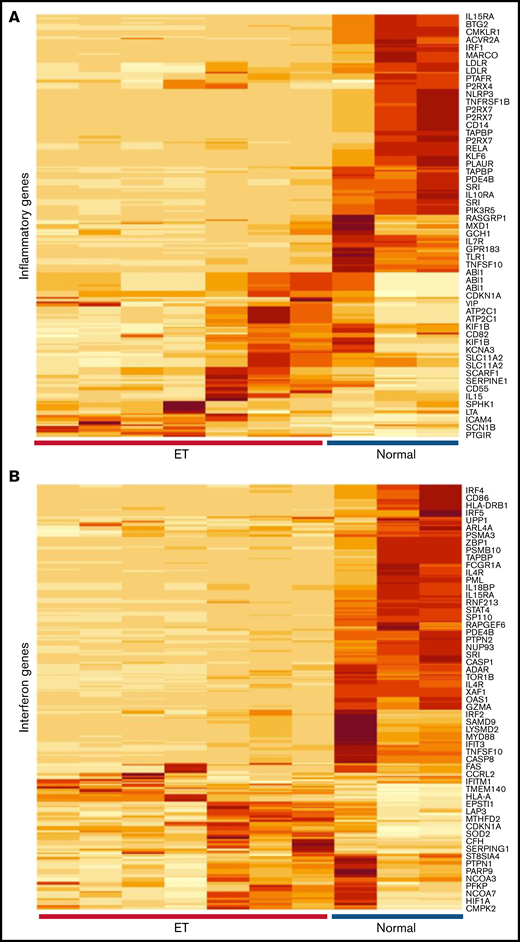
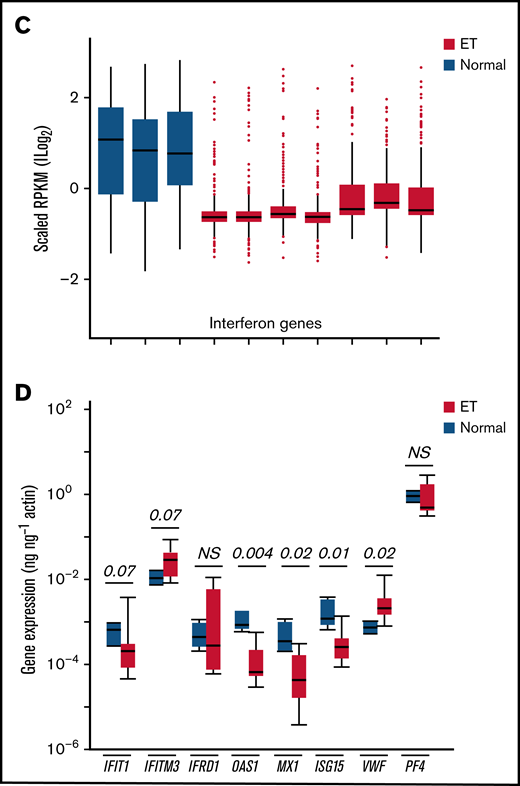
Characterization of inflammatory gene profiles in platelets. (A-B) RNA-Seq data from ET (N = 7) or healthy control (N = 3) platelets35 were filtered by using Hallmark40 inflammatory response (A, n = 200) or IFN response (B, n = 224) genes, followed by unsupervised hierarchical clustering by Euclidean distance (differentially expressed genes are shown). Note clear segregation of phenotypes in both panels. (C) In silico expression studies of aggregated IFN response genes (n = 224) by phenotype (normal, n = 3; ET, n = 7); data are expressed as mean ± standard error of the mean (SEM) of reads per kilobase per million (RPKM) normalized and scaled to mean 0. (D) Platelet quantitative polymerase chain reaction of select IRGs or platelet-specific genes (VWF and PF4) from a secondary cohort of healthy controls (n = 4) or ET (n = 8), expressed as mean ± SEM normalized to actin; box plots (panels C-D) represent the within-group interquartile range encompassing 50% of the values, whereas the 95% CIs and outliers are depicted. The horizontal bar within each box represents the group median. P values (t test) are shown. NS, not significant.
Characterization of inflammatory gene profiles in platelets. (A-B) RNA-Seq data from ET (N = 7) or healthy control (N = 3) platelets35 were filtered by using Hallmark40 inflammatory response (A, n = 200) or IFN response (B, n = 224) genes, followed by unsupervised hierarchical clustering by Euclidean distance (differentially expressed genes are shown). Note clear segregation of phenotypes in both panels. (C) In silico expression studies of aggregated IFN response genes (n = 224) by phenotype (normal, n = 3; ET, n = 7); data are expressed as mean ± standard error of the mean (SEM) of reads per kilobase per million (RPKM) normalized and scaled to mean 0. (D) Platelet quantitative polymerase chain reaction of select IRGs or platelet-specific genes (VWF and PF4) from a secondary cohort of healthy controls (n = 4) or ET (n = 8), expressed as mean ± SEM normalized to actin; box plots (panels C-D) represent the within-group interquartile range encompassing 50% of the values, whereas the 95% CIs and outliers are depicted. The horizontal bar within each box represents the group median. P values (t test) are shown. NS, not significant.
Comparative studies of IFN-α2 and IFN-α16
IFNs are functionally characterized by their antiviral and antiproliferative properties, and IFN-α cellular responses are mediated by binding to a common IFNAR1/IFNAR2 heterodimeric receptor complex.39,43 To study putative cellular effects mediated by IFN-α16, we used a tandem affinity tag to express and purify wild-type (V65D95A133) and mutant IFN-α16 as recombinant proteins in E coli. Because IFNA16 mutant SNVs were found in linkage disequilibrium (T194A, G283C, G397C) (Figure 3), mutant IFN-α16 was specifically designed to incorporate the triple mutation (E65H95P133) in the IFN-α16 backbone (supplemental Figure 1A). Both wild-type (IFN-α16WT) and mutant (IFN-α16MUT) exhibited comparable solubility and purification characteristics as E coli recombinant proteins, excluding the likelihood that E65H95P133 mutant affected protein stability. An adenoviral replication system designed to quantify antiviral properties exhibited comparable inhibitory effects between wild-type and mutant IFN-α16, and antiviral properties were functionally equivalent to that of clinically used recombinant human IFN-α2a (Hu-IFN-α2a) (supplemental Figure 1B). Functional integrity of IFNAR1/IFNAR2 signaling was established by using both A549 lung epithelial cells (not shown) and HDF/Tert1 skin fibroblasts (supplemental Figure 1C), with no differences in STAT1 phosphorylation between recombinant IFN-α16WT and IFN-α16MUT, and nearly identical to IFN-α2. These initial data excluded the possibility that mutant IFN-α16 represented a gain-of-function or loss-of-function mutation of key antiviral or cell-signaling mechanisms.
IFN-α16 effects on MKs
Given the sustained cytokine disruption in ET, we applied an in vitro model system to characterize effect(s) of chronic IFN exposure on gene expression and patterns of IRG expression during megakaryocytopoiesis. CD34+ HSCs were differentiated in the absence or presence (supplemented every 48 hours) of IFN-α2, IFN-α16WT, or IFN-α16MUT over a 14-day MK differentiation protocol (Figure 6A). At the concentration(s) of IFNs studied, we saw no evidence for disparate effects on CD41+ (integrin αIIb) or Annexin V expression, the latter used as a quantitative marker of phosphatidylserine exposure that accompanies terminal megakaryocytopoiesis (Figure 6B).35 To determine if the IFN-regulated gene profiles were differentially modulated by IFN isoforms, we quantified gene expression over time, applying the same IRG subset used in the ET/normal platelet expression studies (discussed earlier). In the absence of interferon, 5 of 6 genes (IFIT1, MX1, ISG15, IFRD1, and OAS1) exhibited time-dependent induction corresponding to maximal CD41+ positivity at day 14 (Figure 6C). IRG induction was most striking for IFIT1 (175-fold), IFRD1 (65-fold), and MX1 (65-fold); the most abundant gene (IFITM3) exhibited minimal (1.7-fold) change.
![Functional and cellular characterization of IFN-α2 and IFN-α16 in hematopoietic stem cells. (A-B) CD34+ HSCs were expanded in TPO-conditioned media supplemented (or not) with IFNs α2b (500 U/mL) or equimolar concentrations (50 ng/mL) of IFN-α16WT or IFN-α16MUT at 2-day intervals (A), followed by flow cytometric quantification of CD41+ (integrin αIIb) and Annexin V (phosphatidylserine) at designated time points (B). Data represent the mean ± standard error of the mean (SEM) from triplicate determinations of a single representative experiment, repeated once. (C) Differentiating CD34+ HSCs at specific time points (day 0 [D0], D4, and D14) were stimulated with IFN-α2a (500 U/mL) or equimolar (50 ng/mL) concentrations of IFN-α16WT or IFN-α16Mut for 60 minutes, followed by RNA isolation and quantification of selected IRGs (IFIT1, IFITM3, IFRD1, OAS1, MX1, and ISG15) or MK-specific genes (VWF and PF4). Data are from a single representative experiment (mean ± SEM from triplicate determinations normalized to actin), repeated once; statistically significant differences (α2b to either α16WT [red asterisks] or α16MUT [black asterisks]) only seen at D4 are shown (t-test; **P < .01, ***P < .001). (D) D4 HSCs were stimulated for 60 minutes with IFN-α2a (500 U/mL) or equimolar (50 ng/mL) concentrations of IFN-α16WT or IFN-α16Mut, followed by sodium dodecyl sulfate–polyacrylamide gel electrophoresis and pSTAT1 detection by immunoblot analysis (20 μg/lane); α-tubulin and total cellular STAT1 are shown as loading controls. Heat-inactivated IFN-α16WT and IFN-α16MUT exhibit no pSTAT1 activation. N.S., not significant.](https://ash.silverchair-cdn.com/ash/content_public/journal/bloodadvances/6/16/10.1182_bloodadvances.2021005648/1/m_advancesadv2021005648f6.png?Expires=1767739706&Signature=bvuEvQ2Uguhy3rqZIJZResYBaJSvsVmZxzxkm-GNQbKvrmvbE3DTWs8LtzS9oDYCxamz1iAmGG2ltPTqleoJ-rKKhX87doKKj1acRb2rXy-aTcjvtsNIllgV2nlB2pfUPLIY~BY4NOribuhmGi33nA1Q5hG7HB8c2VzQc1eWZ5Xp0E3xHFkvApmz9BkUOjZfPU-fCB7T1LHkSFTRroFWht~fN2yhaz~SKNSiP4NMFM50z~oHWBXwOxIS15M4N78oys1WmHOjnh~vlb1F-nqsFAgTyjD4FwoyFp5YhA~kq9~1dMRf8TV2yd6OCpESjCNyG3aAsudvcgB3JRw0M8KyFw__&Key-Pair-Id=APKAIE5G5CRDK6RD3PGA)
Functional and cellular characterization of IFN-α2 and IFN-α16 in hematopoietic stem cells. (A-B) CD34+ HSCs were expanded in TPO-conditioned media supplemented (or not) with IFNs α2b (500 U/mL) or equimolar concentrations (50 ng/mL) of IFN-α16WT or IFN-α16MUT at 2-day intervals (A), followed by flow cytometric quantification of CD41+ (integrin αIIb) and Annexin V (phosphatidylserine) at designated time points (B). Data represent the mean ± standard error of the mean (SEM) from triplicate determinations of a single representative experiment, repeated once. (C) Differentiating CD34+ HSCs at specific time points (day 0 [D0], D4, and D14) were stimulated with IFN-α2a (500 U/mL) or equimolar (50 ng/mL) concentrations of IFN-α16WT or IFN-α16Mut for 60 minutes, followed by RNA isolation and quantification of selected IRGs (IFIT1, IFITM3, IFRD1, OAS1, MX1, and ISG15) or MK-specific genes (VWF and PF4). Data are from a single representative experiment (mean ± SEM from triplicate determinations normalized to actin), repeated once; statistically significant differences (α2b to either α16WT [red asterisks] or α16MUT [black asterisks]) only seen at D4 are shown (t-test; **P < .01, ***P < .001). (D) D4 HSCs were stimulated for 60 minutes with IFN-α2a (500 U/mL) or equimolar (50 ng/mL) concentrations of IFN-α16WT or IFN-α16Mut, followed by sodium dodecyl sulfate–polyacrylamide gel electrophoresis and pSTAT1 detection by immunoblot analysis (20 μg/lane); α-tubulin and total cellular STAT1 are shown as loading controls. Heat-inactivated IFN-α16WT and IFN-α16MUT exhibit no pSTAT1 activation. N.S., not significant.
Functional and cellular characterization of IFN-α2 and IFN-α16 in hematopoietic stem cells. (A-B) CD34+ HSCs were expanded in TPO-conditioned media supplemented (or not) with IFNs α2b (500 U/mL) or equimolar concentrations (50 ng/mL) of IFN-α16WT or IFN-α16MUT at 2-day intervals (A), followed by flow cytometric quantification of CD41+ (integrin αIIb) and Annexin V (phosphatidylserine) at designated time points (B). Data represent the mean ± standard error of the mean (SEM) from triplicate determinations of a single representative experiment, repeated once. (C) Differentiating CD34+ HSCs at specific time points (day 0 [D0], D4, and D14) were stimulated with IFN-α2a (500 U/mL) or equimolar (50 ng/mL) concentrations of IFN-α16WT or IFN-α16Mut for 60 minutes, followed by RNA isolation and quantification of selected IRGs (IFIT1, IFITM3, IFRD1, OAS1, MX1, and ISG15) or MK-specific genes (VWF and PF4). Data are from a single representative experiment (mean ± SEM from triplicate determinations normalized to actin), repeated once; statistically significant differences (α2b to either α16WT [red asterisks] or α16MUT [black asterisks]) only seen at D4 are shown (t-test; **P < .01, ***P < .001). (D) D4 HSCs were stimulated for 60 minutes with IFN-α2a (500 U/mL) or equimolar (50 ng/mL) concentrations of IFN-α16WT or IFN-α16Mut, followed by sodium dodecyl sulfate–polyacrylamide gel electrophoresis and pSTAT1 detection by immunoblot analysis (20 μg/lane); α-tubulin and total cellular STAT1 are shown as loading controls. Heat-inactivated IFN-α16WT and IFN-α16MUT exhibit no pSTAT1 activation. N.S., not significant.
To determine if there were stage- or isoform-restricted differences after IFN stimulation, cells were stimulated with corresponding IFNs for 60 minutes, and IRG responses were quantified at baseline (day 0), at an early stage of MK differentiation (day 4), or at terminal MK differentiation (day 14). Across the IFN isoforms (α2, α16WT, and α16MUT), maximal and comparable gene induction was evident at day 0, with less robust responses at day 14; indeed, day 14 gene induction was minimal for all IRGs and essentially comparable to maximal expression evident during terminal differentiation in the absence of IFN. At a time corresponding to modest CD41+ acquisition (∼30% at day 4), HSCs retained their capacity for IFN induction, although we noted clear differences in IRG responses between the α2 and α16 isoforms. Although gene induction by α16WT and α16MUT was nearly identical, both responses were consistently attenuated compared with that of the α2 isoform. These differences were not due to accompanying divergence in pSTAT phosphorylation (Figure 6D), confirming the presence of a functional IFNAR axis, and excluding the possibility of cell desensitization with continuous IFN exposure; heat-inactivated IFN-α16 (WT and MUT) failed to induce pSTAT1 phosphorylation, establishing specificity of the IFN-α/IFNAR signaling axis, and suggesting progressive (or transient) loss of pSTAT1 signaling during cell differentiation in the absence of an acute IFN stimulus. These collective data provide evidence for divergent IFN-α isoform- and stage- restricted IRG responses during MK lineage speciation, and they are consistent with prior evidence for a STAT-independent mechanism regulating IRG responses.43
Discussion
We have identified a subset of gene/SNVs associated with thrombocytosis that provides a framework for dissecting molecular mechanisms of enhanced platelet formation during inflammatory triggers. These interactions are distinct from those during steady-state thrombopoiesis, and they provide insight into genetic variants that regulate disparate platelet responses to stress in the general population. We applied the SNV data to better define epistatic interactions in thrombocytosis, with evidence for both overlapping and functionally diverse pathways that comprise the ET and RT interactive networks. These distinct genetic networks are consistent with the pathophysiologically divergent mechanisms of enhanced thrombopoiesis in clonal and stress thrombocytosis. In contrast to rare single-gene defects resulting in predominant phenotypes (ie, hemophilia and sickle cell disease), complex phenotypes such as thrombopoietic responses likely result from epistatic gene–gene interactions exerting synergistically additive effects within overlapping pathways44 ; these data provide a framework for further dissecting the complex interplay of regulatory genetic networks linked to inflammatory and clonal thrombopoiesis.
The majority of cytokines were statistically different in cross-group comparisons (13 of 15), and non-overlapping 4-member subsets effectively distinguished ET from normal (CD30, IL10, TNF receptor 1, and TNF-α) or ET from RT (Tweak, IL1RA, TSLP, and TNF receptor 2 cytokine). These observations highlight the important pathophysiological differences in inflammatory responses in phenotypically divergent thrombocytosis models. There is considerable interest in identifying polymorphic changes that influence cytokine levels in various disease states,45 although literature review using the 48-member ET-associated SNV list (supplemental Table 3) failed to implicate these gene/SNVs as modulators of cytokine levels in ET; similarly, we saw no differences in cytokine profiles according to age or sex. Interestingly, gene/SNVs involving both IL6 and IL6ST (signal transducer encoding the IL-6 β subunit) were prominently identified in the ET network but not in the RT network where IL-6 has been identified as a driver of stress thrombopoiesis.5 IL-6 is nonselectively elevated in a number of inflammatory (and malignant) conditions,45 although IL6 polymorphisms (including those in the promoter) inconsistently influence serum levels or confer disease risk in various disease states46-49 ; thus, the lack of IL6 SNV associations in RT is not unexpected. Consistent with prior data,6 serum IL-6 was statistically different among the 3 phenotypes (and highest in ET), and the IL6 SNV rs1800797 associated with ET has been associated with higher serum IL-6 levels, putatively linking cytokine levels with genetic susceptibility.50 Interestingly, RT was associated with both IL10RA (rs4252249) and IL10RB (rs17860266) SNVs, which are encompassed within both polypeptide chains (α and β) of the IL-10 receptor, and known to be required for IL-10 signaling. Although IL,10 is largely considered an anti-inflammatory cytokine (and statistically different in cross-group comparisons), data using recombinant human IL-10 show that it retains pro-inflammatory effects in infection51 and Crohn’s disease,52 with putative adverse effects on platelet production.53 Neither IL-10 nor its cognate receptor complex is studied in the context of RT, although associations with both IL10RA and IL10RB SNVs impute previously uncharacterized functions relevant to inflammation, receptor signaling, and thrombopoiesis.
Our initial genetic studies identified polymorphic IFNA16 as a novel susceptibility allele in aggregate (ET and RT) thrombocytosis. The IFNA16 association was most exaggerated in the ET cohort (to the exclusion of RT), which also revealed overrepresentation of IFN-regulated pathways. These data extend previous GWAS in MPN cohorts that implicate various SNVs in risk susceptibility,54-57 pathogenesis,58 or prognosis,59,60 although the majority of loci conferring familial MPN risk remain unidentified.57 Limitations of our study are the relatively small sample size compared with aggregated and long-term data reported for the JAK2 susceptibility locus.10-12 Nonetheless, our conclusions are supported by a sequential study design that incorporated an initial and secondary (validation) cohort for independent confirmation. Unlike the JAK2-suscpetibility haplotype, the risk was greater in the initial subset of JAK2V617F-negative cohorts, although substratification data from the validation cohort were not as robust as those from the initial cohort. Aggregated IFNA16 rs28368163 data incorporating both cohorts (n = 105 subjects) confirmed the overall association (OR, 4.92) and the specificity with JAK2V617F-negative ET (OR, 5.01). Predicated on these initial studies, variant IFNA16 represents a stronger susceptibility allele than that previously described for SNVs within the JAK2 locus.9,10,35 Because of our limited sample size, we were unable to further substratify according to c-MPL, CALR, or triple-negative MPN.
We were unable to show that variant IFN-α16 displayed cellular or antiviral properties that diverged from those of native IFN-α16, although plasma IFN-α16 levels were higher in subjects expressing the mutant IFNA16 allele. Unexpectedly, both IFN-α16WT and IFN-α16MUT displayed stage-restricted differences in IRG responses compared with therapeutically used IFN-α2 at a confined developmental time point of MK differentiation. These results are paradoxical given the redundancy and evolutionary conservation of 13 type 1 IFN-α isoforms that collectively use the identical IFNAR1/IFNAR2 heterodimer for downstream signaling.39,43 Although type I IFNs share a common docking mode for receptor binding, recent data suggest that ligand discrimination occurs through distinct energetics of shared receptor contacts. Indeed, the extent of pSTAT activation as measured by tyrosine phosphorylation does not fully explain the level of gene expression,43 results that are consistent with our CD34+-differentiated IRG data, which exhibit dichotomous IFN-α16/IFN-α2 genetic changes (at day 4) in the setting of comparable pSTAT patterns. Although IFN-α2 induces complete hematologic responses in subsets of MPN patients,61 the mechanism(s) remain incompletely understood, and our data suggest that its effect may be at a discrete stage of lineage development. Whether alternative IFN isoforms display differential efficacy in IFN-responsive disorders remains speculative62 but supported by these collective observations.
Our data suggest that chronic IFN stimulation may be sufficient as an initiator for clonal expansion, although the complex cytokine profiles identified in ET confound linear causal relationships. Elevated IFN-α16 levels were restricted to the subgroup expressing the IFNA16 rs28368163 mutant (C) allele, although the mechanism(s) whereby this variant affects circulating levels remains unestablished. We did not complete expression studies in eukaryotic systems, although variant IFN-α16 displayed comparable solubility and yield characteristics as the naive recombinant protein in E coli, minimizing a mechanism related to intrinsic protein stability or cellular expression as identified with polymorphic IL-6.46-49 The low minor allele frequency (∼0.03) in healthy control subjects was insufficient to establish comparable effects on serum IFN-α16 levels in otherwise healthy individuals. Inflammatory stimuli induce variable effects on peripheral platelet counts, observations that are compounded by the complex patterns of cytokine release evident in various autoimmune, inflammatory, or malignant processes. In mice, IFN (IFN-α2) results in expansion of a genetically biased pool of MKs designed to rapidly regenerate the platelet pool,4 although such inflammatory models fail to incorporate MK genetic responses in diseases of chronicity or those displaying complex patterns of cytokine release (eg, MPNs).
Variability in platelet inflammatory and IFN genes was evident in our ET cohort, consistent with transcriptomic changes in the setting of chronic cytokine dysfunction. Interestingly, evidence for an “interferogenic” platelet profile has been established in patients with systemic lupus erythematosus,63 presumably due to immune complex-mediated stimulation of plasmacytoid dendritic cells resulting in type I IFN release and downstream effects on MKs. Three of the genes (PRKRA, IFITM1, and CD69) had concomitant increased changes in protein expression and were associated with vascular disease in systemic lupus erythematosus. Paradoxically, IFN genes were downregulated by using aggregate RNA-Seq data from an initial ET cohort, observations that were validated in a second ET cohort for an IRG subset (MX1, ISG15, OAS1, and IFIT1; P = .004 to P = .07). CD34+ experiments focusing on the differentially expressed ET genes confirmed that IRG subsets are generally induced during megakaryocytopoiesis. Furthermore, MKs retain the capacity for IRG induction during in vitro models of IFN supplementation, most striking in undifferentiated (day 0) CD34+ HSCs and progressively attenuated during terminal MK differentiation. The limited changes in IRGs with IFN stimulation evident in terminally differentiated MKs may provide an explanation for the decreased IRG expression levels evident in ET, although lack of information on differential mRNA decay rates limits firm conclusion.64 Similarly, whether these altered expression patterns have functional effects on the platelet thrombohemorrhagic phenotype remains unestablished.26 Interestingly, MKs retain the capacity for IFN-α secretion and paracrine MK stimulation of IFITM3 (IFN-induced transmembrane 3 restriction factor), defining novel function(s) in antiviral neutralization, innate immunity, and IFN-dependent hematopoietic responses.65 Among the IRGs characterized, IFITM3 displays abundant and relatively stable expression in differentiating MKs, and is upregulated in ET platelets (2.8-fold; P = .07), imputing a comparable function of ET platelets that may regulate innate immunity and thromboinflammatory responses.
Acknowledgments
The authors thank Eli Hatchwell (Cold Spring Harbor Laboratory) for assistance with oligonucleotide primer design.
This work was supported by grants from the National Institutes of Health (National Cancer Institute, CA122677 [P.H.]; National Heart, Lung, and Blood Institute, HL091939 and HL153144 [W.F.B.] and HL147793 [D.V.G.]), National Institutes of Health/National Heart, Lung, and Blood Institute DNA Resequencing and Genotyping Service at Northwest Genomics Center (University of Washington Department of Genome Sciences), Subcontract G175 under U.S. Federal Government contract number HHSN268201100037C, an American Society of Hematology Bridge Grant (W.F.B.), the New York State Stem Cell Foundation (C026716, W.F.B.), and Associazione Italiana Ricerca sul Cancro (number IG14505 and number 12237 AIRC “5xMILLE”) to A.F.
This article was prepared while D.V.G. was employed at Stony Brook University. The opinions expressed in this article are the author’s own and do not reflect the view of the National Institutes of Health, the Department of Health and Human Services, or the United States government.
Authorship
Contribution: D.V.G., S.W., W.Z., and W.F.B. conceptualized the study and formulated the hypothesis; S.W., D.V.G., W.Z., and W.F.B. designed the research; S.W., L.E.M., A.F., P.H., S.-Y.S., Z.L., D.V.G., W.Z., Y.H., and W.F.B. performed the research, analyzed the data, and generated images; and W.F.B. directed the overall research and finalized the manuscript preparation.
Conflict-of-interest disclosure: The authors declare no competing financial interests.
The current affiliation for D.V.G. is Center for Scientific Review, National Institutes of Health, Bethesda, MD.
Correspondence: Wadie F. Bahou, Department of Medicine, State University of New York, Stony Brook, NY 11794-8151; e-mail: wadie.bahou@stonybrookmedicine.edu.

