

Key Points
Various types of lesions in small and large mouse and human vessels result in high shear rates and elongational flows.
The relative hydrodynamic resistance of the vessel and wound explains a decrease in shear rate with increase in injury size.

Abstract
Blood flow is a major regulator of hemostasis and arterial thrombosis. The current view is that low and intermediate flows occur in intact healthy vessels, whereas high shear levels (>2000 s−1) are reached in stenosed arteries, notably during thrombosis. To date, the shear rates occurring at the edge of a lesion in an otherwise healthy vessel are nevertheless unknown. The aim of this work was to measure the shear rates prevailing in wounds in a context relevant to hemostasis. Three models of vessel puncture and transection were developed and characterized for a study that was implemented in mice and humans. Doppler probe measurements supplemented by a computational model revealed that shear rates at the edge of a wound reached high values, with medians of 22 000 s−1, 25 000 s−1, and 7000 s−1 after puncture of the murine carotid artery, aorta, or saphenous vein, respectively. Similar shear levels were observed after transection of the mouse spermatic artery. These results were confirmed in a human venous puncture model, where shear rates in a catheter implanted in the cubital vein reached 2000 to 27 000 s−1. In all models, the high shear conditions were accompanied by elevated levels of elongational flow exceeding 1000 s−1. In the puncture model, the shear rates decreased steeply with increasing injury size. This phenomenon could be explained by the low hydrodynamic resistance of the injuries as compared with that of the downstream vessel network. These findings show that high shear rates (>3000 s−1) are relevant to hemostasis and not exclusive to arterial thrombosis.
Introduction
Rheology plays a central role in the regulation of the cellular and molecular processes of hemostasis. First of all, it regulates receptor-ligand bond formation during the initial step of platelet adhesion at the site of injury.1 Once platelets have adhered, hemodynamic forces stimulate their mechano-receptors to activate them.2-4 The activation is strengthened by soluble agonists released by the platelets,5,6 such as ADP, ATP and TxA2, and also by thrombin, the end-product of coagulation. This amplification of platelet activation is crucial in hemostasis, and it is finely tuned by the flow, which carries away the soluble agonists.7,8
The parameter most commonly used to characterize blood flow is the shear rate, which describes the rate at which one fluid layer passes over another and estimates the velocity change in the direction perpendicular to the flow. Modification of the geometry of a vessel results in elongational flow, which represents the rate of velocity change in the direction parallel to the flow. Both shear rate and elongational flow influence hemostasis when they reach critical levels, notably by activating von Willebrand factor (vWF). Indeed, elongational flow above 300 s−1 or shear rates exceeding 5000 s−1 can unfold circulating vWF to expose cryptic sites and allow its adhesion to platelets through their membrane GPIb-IX-V complex.9-11
Disturbed flow has long been recognized as a major mediator of arterial thrombosis. The presence of an evolved atherosclerotic plaque profoundly modifies the local geometry and generates prothrombogenic flows,12 including (i) flow acceleration with elongational flows in the prestenotic area,13 (ii) high shear exceeding 45 000 s−1 in the stenosis throat,14 and (iii) regions of flow recirculation in the poststenotic zone.15-17 Because the high shear found at the apex of a plaque is recognized as a specific feature of thrombosis, targeting high shear has been proposed as an innovative strategy to selectively block thrombosis18 with a minor impact on hemostasis, thereby potentially avoiding bleeding complications.19
A major blind spot in our current knowledge, however, concerns the flow conditions prevailing during hemostasis. Although homeostatic flow conditions (ie, flows in intact vessels) are well known and involve relatively low shear forces (<2000 s−1), the shear flow occurring after lesion of a vessel has never been measured experimentally.20,21 The aim of this study was to evaluate the shear rates and elongational flows occurring in wounds after vessel damage.
Three novel models were developed and applied to various murine vessels, with the aim of mimicking the main scenarios of vessel injury (ie, puncture or transection). The lesions and the plugs forming in these models were characterized by fluorescence and electron microscopy. An original model was also developed in humans, based on measurement of the blood loss after injury of the cubital vein. Using our experimental data, a computational fluid dynamics model was employed to calculate the magnitudes of the shear rate and elongational flow occurring after vessel injury. Evidence is provided that both the shear rate and the elongational flow generated at the edge of a wound reach extremely high levels, similar to those previously thought to prevail only in stenosed arteries during thrombotic events.
Materials and methods
Mouse model of hemostasis based on vessel puncture
Wild-type mice with a pure C57BL/6 background were maintained in the animal facilities of the EFS Grand-Est. Ethical approval for the experiments was obtained from the French Ministry of Research. The fluorescent agent 3,3′-dihexyloxacarbocyanine iodide (DIOC6; Thermo Fisher Scientific, MA) was injected into the jugular vein of 7- to 28-week-old mice, 5 minutes before the experiment, to label platelets. Before puncture of the vessel (carotid artery, aorta, or saphenous vein), an ultrasound Doppler probe with PS-Series Nanoprobe (Transonic Systems Inc) was used to measure the uninjured flow velocity. The ultrasonic window of the probe has the same flow sensitivity, so that the vessel can be positioned anywhere within the probe lumen. Afterward, 2 laser Doppler probes were placed at the up- and downstream sides of the site of injury to measure the velocity of the blood flow relative to each other. The vessel was then punctured with a 25- or 30-gauge needle. The relative flow velocities were recorded continuously and normalized to absolute values using the uninjured mean flow velocity (detailed in supplemental materials; supplemental Figure 1A-B). The time to cessation of bleeding after the injury was determined. To measure the blood loss, the blood was collected on a tissue compress in a tube containing 10 mL of lysis buffer (NH4Cl 150 mM, KHCO3 1 mM, EDTA 0.1 mM, pH 7.2) and then centrifuged at 550g, and the optical density was read at 540 nm. At the end of the experiment, the thrombus was fixed and processed for electron microscopy.22
Mouse model of hemostasis based on vessel puncture using a catheter
The left common carotid artery of adult mice was exposed, and the blood flow was stopped by placing 2 ligatures at the top and bottom of the vessel. A catheter with an inner diameter of 127 μm was inserted into the vessel and fixed with a drop of optical matching gel (Moor Instruments Ltd, Devon, UK). At the end of the procedure, the blood flow was restored. Blood was collected into a tube, which was weighed to determine the volume of blood lost.
Mouse model of hemostasis based on vessel transection
DIOC6 was injected into the jugular vein of adult mice, 5 minutes before starting the experiment, to label platelets. Two sites on the spermatic artery were exposed: one to place a Doppler probe and the other to perform transection. The Doppler probe was used to measure the blood flow before and after disruption of the vessel with microscissors (15000-08; Fine Science Tools, Heidelberg, Germany). The measured flow velocities were normalized to absolute values using the mean velocity in the intact vessel (detailed in supplemental materials; supplemental Figure 1C-F). The time to cessation of bleeding was recorded.
Human model of hemostasis based on vessel puncture
The investigations were performed in accordance with the Declaration of Helsinki and with the approval of the Center for Theoretical Problems of Physicochemical Pharmacology, Russian Academy of Sciences (CTPPCP RAS) Ethical Committee, and written informed consent was obtained from all donors. The median cubital vein of healthy donors (6 male and 3 female) was punctured with a 22-gauge (diameter = 0.41 mm) or 24-gauge needle (diameter = 0.31 mm) connected to a peripheral venous catheter. After placement of the catheter and removal of the stiletto, blood was collected into a tube for 2 minutes by gravity, and the volume of blood lost was determined by weighing the tube.
Computational model to calculate the flow parameters after puncture or transection of murine or human vessels
To calculate the shear rate and elongational flow in murine and human vessels, a computational fluid dynamics model of blood flow was applied to the injury region. The damaged vessel was modeled as a tube representing the vessel wall with an outer diameter based on experimental measurements and a thickness derived from the literature,23-25 in which a hole represented the injury. The size of the injury was determined by using experimental fluorescent microscopy data, and the measurements were confirmed by scanning electron microscopy (supplemental Figure 2A-G). The blood was considered to be a non-Newtonian fluid (supplemental Figure 2H), and the time-dependent incompressible Navier-Stokes equation was solved in 3 dimensions (3D) to calculate the flow field. For the boundary conditions of the flow up- and downstream of the hole, we used the experimental flows measured with Doppler probes. The vessel wall was taken to be nondeformable, and the wound led to a larger tank with an upper lid at constant pressure. Further details of the simulation setup can be found in the supplemental materials (supplemental Figure 3).
Hybrid computational model of the blood flow in the intact and injured venous network of the human arm
To analyze the hemodynamic conditions in the human venipuncture experiments, not only near the wound but also in the adjacent vessels, we developed a simulation of the blood circulation in the human arm. The first superficial and deep vein branches of the brachiocephalic vein were modeled as rigid pipes with diameters and lengths based on literature values,26,27 while the redistribution of the blood flow and pressure was calculated by the method of electronic-hydraulic analogy (MEHA).28 The damaged median cubital vein was modeled as a pipe with a round hole on the top where stationary numerical solutions of the Navier-Stokes equation were obtained in 3D. The blood was considered to be a non-Newtonian29 (detailed in the supplemental materials; supplemental Figure 4A). The boundary conditions at both ends of the median cubital vein were obtained from the 2-way coupled method of electronic-hydraulic analogy simulation of the venous network (detailed in the supplemental materials).
Statistical analyses
All statistical analyses were performed using a GraphPad Prism program, version 6.0 (Prism, GraphPad, La Jolla, CA). All values are reported as the mean ± SEM for a normal distribution, or median for a nonnormal distribution. The data of 2 groups were compared by the 2-tailed paired Student t test.
Results
Development and characterization of 2 novel models of hemostasis in mice
To determine the blood flow conditions occurring at the edge of a wound, 2 novel mouse models of hemostasis were developed. In the first model, a 25-gauge needle was used to puncture the murine carotid artery (Figure 1A). Intravital microscopy showed the formation of an initial small, reversible platelet plug reaching a maximum size 30 seconds after vessel puncture, which remained mainly located in the extravascular space (Figure 1B-C; supplemental Figure 2A,C,E). SEM imaging indicated that the residual plug was largely composed of tightly packed platelets, indicative of their elevated degree of activation (Figure 1D, supplemental Figure 2B,D,F). The thrombus surface was covered with fibrous strands, whose ultrastructure resembles fibrin and contained erythrocytes. The mean time to arrest of bleeding was 41 seconds (25% to 75% percentile: 25 to 48 seconds; n = 6) (Figure 1E). In the second model, the spermatic artery was sectioned with microscissors to mimic vessel disruption (Figure 1F). Intravital microscopy indicated that an occlusive, platelet-rich plug formed at the vessel outlet and stopped blood loss after 43 seconds (25% to 75% percentile: 27.5 to 97 seconds; n = 9) (Figure 1G-H). These 2 models represent the main scenarios of vascular injury and were used to measure the average velocity of the blood flow in the vessel experimentally, in order to reconstruct the flow field at the edge of the wound.

Two novel models of hemostasis in mice. (A) Schema of the murine vessel puncture model with 2 laser Doppler probes. (B-E) Thrombus formation was induced by needle puncture of the left common carotid artery of wild-type mice. (B) Representative fluorescence images of the thrombus (platelets labeled with DIOC6 in green) at the indicated time points after injury with a 25-gauge needle. Scale bar: 250 μm. The arrows represent the direction of blood flow, and the dotted lines represent the borders of the vessel. (C) The curve shows the area of the hemostatic thrombus as a function of the time after injury. (D) Representative scanning electron microscopy images of the external thrombus 3 minutes after vessel puncture. The black solid line represents the border of the thrombus. Scale bar: 250 μm (left), 10 μm (right). The thrombus is composed of tightly packed platelets, fibrous strands whose ultrastructure resembles fibrin, and RBCs, colored on the enlarged image of the area in the red square in gray, green, and red, respectively. (E) The dot plot shows the bleeding times of the wounds after vessel puncture. Data are presented as the mean ± the standard error of the mean (SEM) and individual symbols represent individual mice. (F) Schema of the murine vessel transection model with a laser Doppler probe. (G-H) Thrombus formation was induced by transection of the spermatic artery of wild-type mice with microscissors. (G) Representative fluorescence images of the thrombus (platelets labeled with DIOC6 in green) at the indicated time points after injury. Scale bar: 250 μm. The arrows indicate the direction of blood flow. The white dotted lines represent the borders of the exposed vessel, and the green dotted lines represent the borders of the vessel under muscle tissue. (H) The dot plot shows the bleeding times of the wounds after vessel transection. Data are presented as the mean ± SEM, and individual symbols represent individual mice.
Two novel models of hemostasis in mice. (A) Schema of the murine vessel puncture model with 2 laser Doppler probes. (B-E) Thrombus formation was induced by needle puncture of the left common carotid artery of wild-type mice. (B) Representative fluorescence images of the thrombus (platelets labeled with DIOC6 in green) at the indicated time points after injury with a 25-gauge needle. Scale bar: 250 μm. The arrows represent the direction of blood flow, and the dotted lines represent the borders of the vessel. (C) The curve shows the area of the hemostatic thrombus as a function of the time after injury. (D) Representative scanning electron microscopy images of the external thrombus 3 minutes after vessel puncture. The black solid line represents the border of the thrombus. Scale bar: 250 μm (left), 10 μm (right). The thrombus is composed of tightly packed platelets, fibrous strands whose ultrastructure resembles fibrin, and RBCs, colored on the enlarged image of the area in the red square in gray, green, and red, respectively. (E) The dot plot shows the bleeding times of the wounds after vessel puncture. Data are presented as the mean ± the standard error of the mean (SEM) and individual symbols represent individual mice. (F) Schema of the murine vessel transection model with a laser Doppler probe. (G-H) Thrombus formation was induced by transection of the spermatic artery of wild-type mice with microscissors. (G) Representative fluorescence images of the thrombus (platelets labeled with DIOC6 in green) at the indicated time points after injury. Scale bar: 250 μm. The arrows indicate the direction of blood flow. The white dotted lines represent the borders of the exposed vessel, and the green dotted lines represent the borders of the vessel under muscle tissue. (H) The dot plot shows the bleeding times of the wounds after vessel transection. Data are presented as the mean ± SEM, and individual symbols represent individual mice.
Puncture of a mouse carotid artery generates high shear at the edge of the wound
To determine the flow conditions prevailing during hemostasis, we first employed the murine carotid puncture model (Figure 1A). Measurements with an ultrasound Doppler probe indicated a mean blood flow velocity of 5 ± 0.2 cm/s in the intact carotid (Figure 2A). Two laser Doppler probes recorded the variations in blood flow throughout the hemostatic process (Figure 2B; supplemental Figure 4B). The upstream velocity profile showed a rapid rise to a maximal value reached 11 ± 2 seconds after injury, which stabilized after 23 ± 2 seconds at 7 ± 1 cm/s (supplemental Figure 4C,D). The simulation indicated that the shear rate at the edge of the wound attained a maximal value of ∼16 000 s−1 for a wound area of 40 × 103 μm2 (Figure 2C-D). Further simulations with the numerical model revealed that the shear rate was only modestly influenced by the shape of the injury, because a circular form and an ellipsoidal one led to variations of < 20% (Figure 2E; supplemental Table 1). The presence of ruptured borders of the injury inside the vessel lumen likewise had a modest impact (<21%) (Figure 2E). The median maximum shear rate at the edge of wounds in the carotid artery having a surface area ranging from 9 × 10³ to 6 × 104 μm2 was 22 000 s−1 (Figure 2F; Table 1). Concerning the importance of the wound area, we observed that the shear rate decreased with increasing wound area, but a wide range of areas, from 9 × 10³ to 61 × 103 μm2, all generated high shear levels far above those encountered in intact vessels (Figure 2G). The presence of high shear levels was confirmed using another approach, based on applying Poiseuille’s equation to the volumetric rates of blood loss, which resulted in values ranging from 3 000 to 31 000 s−1 (supplemental Figure 4E,F). Calculation of the elongational flow from the simulated data also showed strongly elevated values reaching 3000 ± 1000 s−1 in a broad region in front of the injury and 5000 ± 2000 s−1 at the edge of the wound, significantly exceeding the threshold levels required for unfolding of vWF (Figure 2H). In summary, both the shear rate and the elongational flow reached extremely high levels following puncture of the murine common carotid artery.
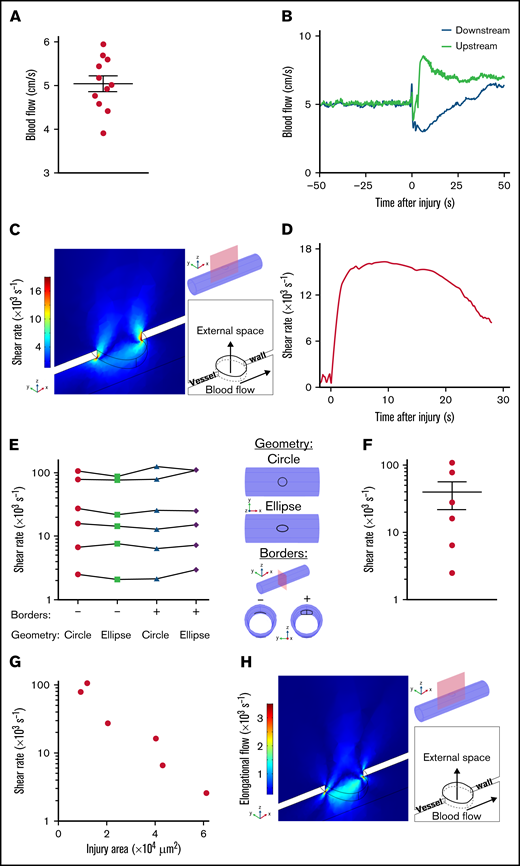
Shear rates after puncture of a mouse carotid artery. (A) The dot plot shows the mean blood flow velocities in the intact left carotid artery. Data are presented as the mean ± SEM, and individual symbols represent individual mice. (B-H) Injury was induced by needle puncture of the left common carotid artery of wild-type mice. (B) The curves show the blood flow velocities upstream and downstream of the site of injury, as a function of the time after injury. (C) Representative image obtained with the model, whose 3D geometry is presented in the upper right corner. The red rectangle defines the zx-section of observation, and the injury appears at the top of the cylinder mimicking the carotid artery. At the side, the colors indicate the shear rates 8.75 seconds after puncture in the zx-section. The schema in the lower right corner depicts the positions of the external space and vessel lumen with arrows indicating the direction of blood flow. (D) The curve shows the shear rate at the edge of the wound calculated with the model, as a function of the time after injury. (E), The graph shows the maximum shear rates at the edge of the wound calculated with the model for 2 different shapes of the lesion (circle and ellipse), whose 3D geometry is presented in the upper right corner. The presence or absence (+ or –) of the vessel borders rolled inside the lumen was used to mimic the presence or absence of the ruptured ends of the carotid artery, whose 3D geometry is presented in the lower right corner. Individual symbols in the columns represent individual mice, and symbols pertaining to the same mouse are joined by a line. (F) The dot plot shows the maximum shear rates at the edge of the wound calculated with the model. Data are presented as the mean ± SEM, and individual symbols represent individual mice. (G) The graph shows the maximum shear rates at the edge of the wound calculated with the model, as a function of the area of the injury. Individual symbols represent individual mice. (H) Representative image obtained with the model, whose 3D geometry is presented in the upper right corner. The red rectangle defines the zx-section of observation, and the injury appears at the top of the cylinder mimicking the carotid artery. At the side, the colors indicate the elongational flows 8.75 seconds after puncture in the zx-section. The schema in the lower right corner depicts the positions of the external space and vessel lumen with arrows indicating the direction of blood flow.
Shear rates after puncture of a mouse carotid artery. (A) The dot plot shows the mean blood flow velocities in the intact left carotid artery. Data are presented as the mean ± SEM, and individual symbols represent individual mice. (B-H) Injury was induced by needle puncture of the left common carotid artery of wild-type mice. (B) The curves show the blood flow velocities upstream and downstream of the site of injury, as a function of the time after injury. (C) Representative image obtained with the model, whose 3D geometry is presented in the upper right corner. The red rectangle defines the zx-section of observation, and the injury appears at the top of the cylinder mimicking the carotid artery. At the side, the colors indicate the shear rates 8.75 seconds after puncture in the zx-section. The schema in the lower right corner depicts the positions of the external space and vessel lumen with arrows indicating the direction of blood flow. (D) The curve shows the shear rate at the edge of the wound calculated with the model, as a function of the time after injury. (E), The graph shows the maximum shear rates at the edge of the wound calculated with the model for 2 different shapes of the lesion (circle and ellipse), whose 3D geometry is presented in the upper right corner. The presence or absence (+ or –) of the vessel borders rolled inside the lumen was used to mimic the presence or absence of the ruptured ends of the carotid artery, whose 3D geometry is presented in the lower right corner. Individual symbols in the columns represent individual mice, and symbols pertaining to the same mouse are joined by a line. (F) The dot plot shows the maximum shear rates at the edge of the wound calculated with the model. Data are presented as the mean ± SEM, and individual symbols represent individual mice. (G) The graph shows the maximum shear rates at the edge of the wound calculated with the model, as a function of the area of the injury. Individual symbols represent individual mice. (H) Representative image obtained with the model, whose 3D geometry is presented in the upper right corner. The red rectangle defines the zx-section of observation, and the injury appears at the top of the cylinder mimicking the carotid artery. At the side, the colors indicate the elongational flows 8.75 seconds after puncture in the zx-section. The schema in the lower right corner depicts the positions of the external space and vessel lumen with arrows indicating the direction of blood flow.
Table of the shear rates calculated for different scenarios
| Vessel | Species | Type of vessel injury | Diameter of the injury, μm | SR at the wound, s−1 | SR in the intact vessel, s−1 | |
|---|---|---|---|---|---|---|
| Median | 25%-75% percentile | |||||
| Carotid artery | Mouse | Puncture | 108-280 | 22 000 | 5 600-85 000 | 950 |
| Aorta | Mouse | Puncture | 40-240 | 25 000 | 6 000-138 000 | 900 |
| Saphenous vein | Mouse | Puncture | 66-173 | 7 000 | 3 000-31 000 | 1 000 |
| Spermatic artery | Mouse | Disruption | 215 | 14 500 | 11 000-20 000 | 900 |
| Median cubital vein | Man | Puncture | 310 | 7 400 | 5 400-27 300 | 250 |
| 410 | 3 500 | 2 300-5 400 | 250 | |||
SR, shear rate.
Puncture of large or small mouse vessels generates high shear at the edge of the wound
To determine whether high shear in the wound is a general feature occurring after puncture of a vessel, blood flow velocities were measured following injury of 2 additional vessels, the aorta and the saphenous vein, which present distinct features with respect to the carotid in terms of diameter, pressure, and vessel wall composition. Ultrasound Doppler measurements in the intact aorta and saphenous vein indicated mean flow velocities of 2.9 ± 0.6 and 1.9 ± 0.1 cm/s, respectively (Figure 3A). The blood flow dynamics during hemostasis were similar to those in the carotid artery in both vessels, with maximal velocities of 4.1 ± 0.4 cm/s (Figure 3B) and 3.6 ± 0.5 cm/s (Figure 3C) resulting in maximal shear rates of 25 000 s−1 (Figure 3D) and 7000 s−1 (Figure 3E), in the aorta (injury area of 1 × 10³ to 47 × 103 μm2) and the saphenous vein (injury area of 3 × 10³ to 24 × 103 μm2), respectively (Figure 3F; Table 1; supplemental Table 3). These shear levels were 28 and 7 times higher in the aorta and the saphenous vein, respectively, as compared with the steady conditions in the intact vessels. The maximum shear rate in both types of vessels decreased with increasing wound area, in line with the results obtained in the carotid artery (Figure 3G). The rates of elongational flow were also highly elevated, reaching 8000 ± 5000 s−1 and 1500 ± 600 s−1 in a broad region in front of the wound, and 13 000 ± 8000 s−1 and 3000 ± 1000 s−1 at the edge of the injury in the aorta and saphenous vein, respectively (Figure 3H). These results indicate that in 2 additional mouse vessels, puncture of small and large veins or arteries leads to extremely high shear rates and elongational flows at the edge of the wound.
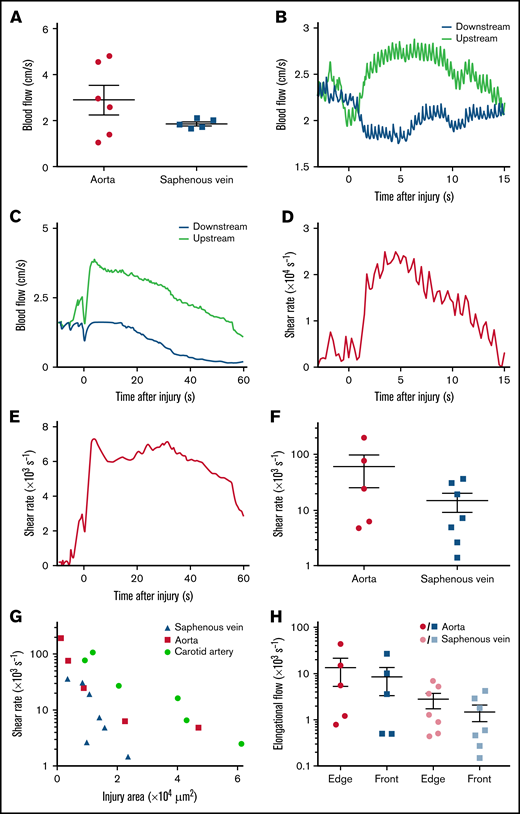
Shear rates after puncture of the mouse aorta or saphenous vein. (A) The dot plots show the mean blood flow velocities in the intact aorta and saphenous vein. Data are presented as the mean ± SEM, and individual symbols represent individual mice. (B) The curves show the blood flow velocities upstream and downstream of the site of injury after puncture of the aorta, as a function of the time after injury. (C) The curves show the blood flow velocities upstream and downstream of the site of injury after puncture of the saphenous vein, as a function of the time after injury. (D) The curve shows the shear rate at the edge of the wound in the aorta, calculated with the model as a function of the time after injury. (E) The curve shows the shear rate at the edge of the wound in the saphenous vein, calculated with the model as a function of the time after injury. (F) The dot plot shows the maximum shear rates at the edge of the wound in the aorta or saphenous vein calculated with the model. Data are presented as the mean ± SEM, and individual symbols represent individual mice. (G) The graph shows the maximum shear rates at the edge of the wound in the carotid artery, aorta, or saphenous vein, calculated with the model as a function of the area of the injury. Individual symbols represent individual mice. (H) The dot plots show the maximum elongational flows at the edge of the wound (edge) and the mean elongational flows in a broad area in front of the wound (front), calculated with the model for puncture of the aorta or saphenous vein. Data are presented as the mean ± SEM, and individual symbols represent individual mice.
Shear rates after puncture of the mouse aorta or saphenous vein. (A) The dot plots show the mean blood flow velocities in the intact aorta and saphenous vein. Data are presented as the mean ± SEM, and individual symbols represent individual mice. (B) The curves show the blood flow velocities upstream and downstream of the site of injury after puncture of the aorta, as a function of the time after injury. (C) The curves show the blood flow velocities upstream and downstream of the site of injury after puncture of the saphenous vein, as a function of the time after injury. (D) The curve shows the shear rate at the edge of the wound in the aorta, calculated with the model as a function of the time after injury. (E) The curve shows the shear rate at the edge of the wound in the saphenous vein, calculated with the model as a function of the time after injury. (F) The dot plot shows the maximum shear rates at the edge of the wound in the aorta or saphenous vein calculated with the model. Data are presented as the mean ± SEM, and individual symbols represent individual mice. (G) The graph shows the maximum shear rates at the edge of the wound in the carotid artery, aorta, or saphenous vein, calculated with the model as a function of the area of the injury. Individual symbols represent individual mice. (H) The dot plots show the maximum elongational flows at the edge of the wound (edge) and the mean elongational flows in a broad area in front of the wound (front), calculated with the model for puncture of the aorta or saphenous vein. Data are presented as the mean ± SEM, and individual symbols represent individual mice.
Transection of the mouse spermatic artery generates high shear at the edge of the wound
To determine the flow conditions occurring during the other scenario of vessel injury, we applied the transection model to sectioning of the murine spermatic artery with microscissors (Figure 1F). Because of the small size of this vessel, which precludes the use of an ultrasound Doppler probe, the absolute blood flow velocities for normalization were derived from larger vessels (detailed in the supplemental methods) (Figure 4A). The dynamics of blood flow after transection of the spermatic artery presented a rapid rise to a maximal value of 7 ± 1 cm/s reached 11 ± 4 seconds after injury (Figure 4B-D). Calculation of the shear rates with the computational model indicated the presence of elevated shear levels attaining 15 000 ± 2000 s−1, 17-fold higher than under homeostatic conditions (Figure 4E-G; Table 1). The elongational flow rates were also significantly elevated both in front of the outlet (1000 ± 300 s−1) and at the edge of the wound (1700 ± 500 s−1), exceeding the threshold levels for unfolding of vWF (Figure 4H). These results indicate that after vessel rupture, as following vessel puncture, the shear rate and elongational flow can reach very high levels.
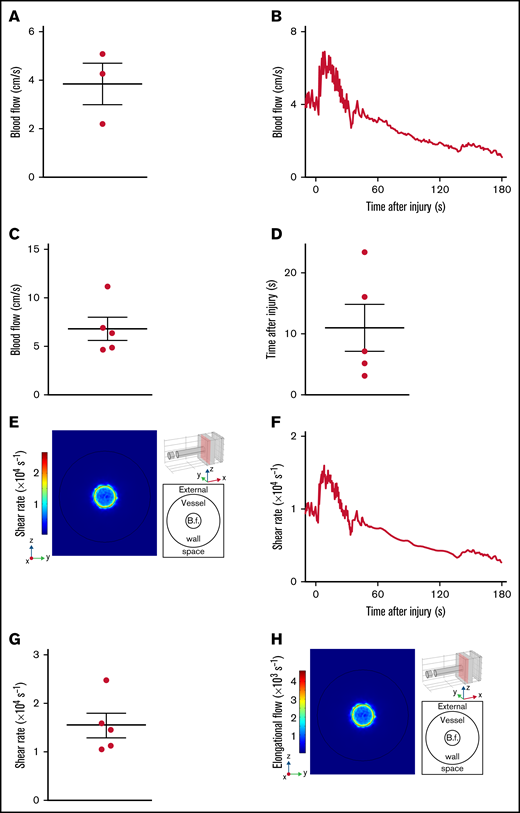
Shear rates after transection of the mouse spermatic artery. (A) The dot plot shows the mean blood flow velocities in the intact spermatic artery. Data are presented as the mean ± SEM, and individual symbols represent individual mice. (B-H) Injury was induced by transection of the spermatic artery of wild-type mice with microscissors. (B) The curve shows the blood flow velocities upstream of the site of injury, as a function of the time after injury. (C) The dot plot shows the maximum blood flow velocities upstream of the site of injury. Data are presented as the mean ± SEM, and individual symbols represent individual mice. (D) The dot plot shows the times after injury at which the maximum upstream blood flow velocities were reached. Data are presented as the mean ± SEM, and individual symbols represent individual mice. (E) Representative image obtained with the model, whose 3D geometry is presented in the upper right corner. The red rectangle defines the zy-section of observation. and the injury appears at the top of the cylinder mimicking the spermatic artery. At the side, the colors indicate the shear rates 8.5 seconds after transection in the zx-section. The schema in the lower right corner depicts the positions of the external space and vessel lumen with the blood flow (B.f.) in the middle. (F) The curve shows the shear rate at the edge of the wound calculated with the model, as a function of the time after injury. (G) The dot plot shows the maximum shear rates at the edge of the wound calculated with the model. Data are presented as the mean ± SEM, and individual symbols represent individual mice. (H) Representative image obtained with the model, whose 3D geometry is presented in the upper right corner. The red rectangle defines the zy-section of observation, and the injury appears at the top of the cylinder mimicking the spermatic artery. At the side, the colors indicate the elongational flows 8.5 seconds after transection in the zx-section. The schema in the lower right corner depicts the positions of the external space and vessel lumen with the blood flow in the middle.
Shear rates after transection of the mouse spermatic artery. (A) The dot plot shows the mean blood flow velocities in the intact spermatic artery. Data are presented as the mean ± SEM, and individual symbols represent individual mice. (B-H) Injury was induced by transection of the spermatic artery of wild-type mice with microscissors. (B) The curve shows the blood flow velocities upstream of the site of injury, as a function of the time after injury. (C) The dot plot shows the maximum blood flow velocities upstream of the site of injury. Data are presented as the mean ± SEM, and individual symbols represent individual mice. (D) The dot plot shows the times after injury at which the maximum upstream blood flow velocities were reached. Data are presented as the mean ± SEM, and individual symbols represent individual mice. (E) Representative image obtained with the model, whose 3D geometry is presented in the upper right corner. The red rectangle defines the zy-section of observation. and the injury appears at the top of the cylinder mimicking the spermatic artery. At the side, the colors indicate the shear rates 8.5 seconds after transection in the zx-section. The schema in the lower right corner depicts the positions of the external space and vessel lumen with the blood flow (B.f.) in the middle. (F) The curve shows the shear rate at the edge of the wound calculated with the model, as a function of the time after injury. (G) The dot plot shows the maximum shear rates at the edge of the wound calculated with the model. Data are presented as the mean ± SEM, and individual symbols represent individual mice. (H) Representative image obtained with the model, whose 3D geometry is presented in the upper right corner. The red rectangle defines the zy-section of observation, and the injury appears at the top of the cylinder mimicking the spermatic artery. At the side, the colors indicate the elongational flows 8.5 seconds after transection in the zx-section. The schema in the lower right corner depicts the positions of the external space and vessel lumen with the blood flow in the middle.
Puncture of the human cubital vein results in high shear rates at the edge of the wound
We next investigated whether shear rates were also dramatically increased after injury of a human vessel, using a puncture model in the human cubital vein (Figure 5A). For ethical reasons, an open wound was not induced with a needle. Instead, a 22- or 24-gauge needle coupled to a 25-mm-long catheter was inserted into the cubital vein of healthy volunteers. The mean velocity of the outflow, measured by weighing the tubes into which the blood was collected, was calculated to be 0.6 ± 0.2 and 0.19 ± 0.04 m/s for wound surface areas of 75 × 103 and 132 × 103 μm2, respectively, corresponding to the outer circumference of the needle (Figure 5B). Poiseuille’s equation led to estimated shear rates of 14 500 ± 5000 and 3700 ± 800 s−1, respectively, for these injury sizes (Figure 5C; Table 1). In control experiments, we used a numerical and an experimental approach to obtain evidence that use of a catheter did not cause overestimation of the shear rates. First, a hybrid model of median cubital vein puncture (Figure 5D) predicted maximum shear rates of 47 000 and 2400 s−1 at the edge of the wound and in the catheter, respectively, for an injury size of 132 × 103 μm2 (Figure 5E). Second, an experimental model of murine carotid artery puncture using a catheter indicated shear rates of 2000 ± 300 s−1 at the edge of the injury, 70 times lower than in the experiment without a catheter, confirming that the presence of a catheter in fact underestimates the shear levels in the wound (Figure 5F-G). Thus, in humans as in mice, the level of shear at the edge of a wound was found to be strongly increased after vessel damage.
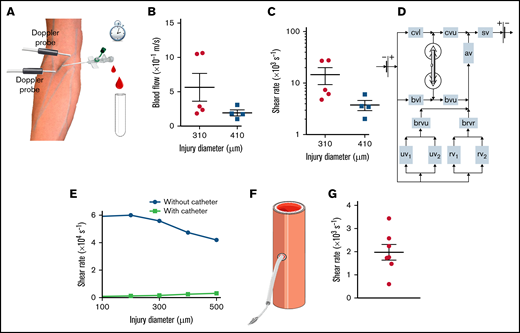
Shear rates after puncture of a human median cubital vein. (A) Schema of the human vessel puncture model using a catheter. (B) The dot plots show the mean blood flow velocities through the catheter after puncture of the median cubital vein with a 22-gauge (diameter = 0.41 mm) or 24-gauge (diameter = 0.31 mm) needle. Data are presented as the mean ± SEM, and individual symbols represent individual donors. (C) The dot plots show the shear rates at the edge of the wound calculated with Poiseuille’s equation for puncture of the median cubital vein with a 22- or 24-gauge needle. Data are presented as the mean ± SEM, and individual symbols represent individual donors. (D) Schema of the hybrid computational model of blood flow in the intact and injured venous network of the human arm. The intact vessels are represented as rectangles with the following abbreviations: av, axillary vein; brvr, brachial vein divided into 2 radial veins; brvu, brachial vein divided into 2 ulnar veins; bvl, lower part of the basilic vein; bvu, upper part of the basilic vein; cvl, lower part of the cephalic vein; cvu, upper part of the cephalic vein; rv1, radial vein 1; rv2, radial vein 2; sv, subclavian vein; uv1, ulnar vein 1; uv2, ulnar vein 2. The damaged median cubital vein is represented in 3D geometry. (E) The curves show the maximum shear rate at the edge of the wound calculated with the hybrid model for experiments with and without a catheter, as a function of the diameter of the injury. Individual symbols represent individual simulations. (F) Schema of the murine carotid artery puncture model with a catheter. (G) The dot plot shows the shear rates at the edge of the wound calculated with Poiseuille’s equation. Data are presented as the mean ± SEM, and individual symbols represent individual mice.
Shear rates after puncture of a human median cubital vein. (A) Schema of the human vessel puncture model using a catheter. (B) The dot plots show the mean blood flow velocities through the catheter after puncture of the median cubital vein with a 22-gauge (diameter = 0.41 mm) or 24-gauge (diameter = 0.31 mm) needle. Data are presented as the mean ± SEM, and individual symbols represent individual donors. (C) The dot plots show the shear rates at the edge of the wound calculated with Poiseuille’s equation for puncture of the median cubital vein with a 22- or 24-gauge needle. Data are presented as the mean ± SEM, and individual symbols represent individual donors. (D) Schema of the hybrid computational model of blood flow in the intact and injured venous network of the human arm. The intact vessels are represented as rectangles with the following abbreviations: av, axillary vein; brvr, brachial vein divided into 2 radial veins; brvu, brachial vein divided into 2 ulnar veins; bvl, lower part of the basilic vein; bvu, upper part of the basilic vein; cvl, lower part of the cephalic vein; cvu, upper part of the cephalic vein; rv1, radial vein 1; rv2, radial vein 2; sv, subclavian vein; uv1, ulnar vein 1; uv2, ulnar vein 2. The damaged median cubital vein is represented in 3D geometry. (E) The curves show the maximum shear rate at the edge of the wound calculated with the hybrid model for experiments with and without a catheter, as a function of the diameter of the injury. Individual symbols represent individual simulations. (F) Schema of the murine carotid artery puncture model with a catheter. (G) The dot plot shows the shear rates at the edge of the wound calculated with Poiseuille’s equation. Data are presented as the mean ± SEM, and individual symbols represent individual mice.
Possible mechanisms governing the decrease in shear rate with increasing wound size
The experimental values measured in different mouse or human injuries, ranging from 50 to 410 μm in size, displayed an unexpected inverse relationship between the shear rate and the size of the wound (Figure 6A). In an attempt to explain this result, we first considered the simple analytical case of Poiseuille flow in a cylinder, which showed that the wall shear rate increased linearly as a function of the radius for a constant pressure drop and decreased as the inverse cube of the radius for a constant flow velocity (detailed in the supplemental materials; supplemental Figure 5A). To explore this finding in the more realistic setting of wound hemodynamics, we used the in silico model of the median cubital vein injury described above (Figure 5D). The shear rates in the wound displayed a linear dependence on size for injury radii <30 μm, and an inverse cube dependence for radii >150 μm (Figure 6B red dots), in agreement with the results for a Poiseuille flow dictated by a “constant pressure regime” and a “constant flow regime,” respectively (Figure 6B lines). Evaluation of the blood flow rate through the wound showed that it was much lower than the flow through the downstream vessel network for very small injuries (<50 μm). For large injuries (>200 μm), it was comparable to the inflowing bloodstream, corresponding to essentially constant flow conditions (Figure 6C). To gain insight into the causes of the transition between these 2 fluid regimes, the threshold of hydrodynamic resistance in the wound was determined and found to be 1, 16, 32, and 22 × 103 Pa*s/mL for the cubital vein, carotid artery, aorta, and saphenous vein, respectively. Above these values, the blood flow through the injury is determined by the capacity of the vessel supplying it, while below them only a fraction of the blood flow passes through the injury (Figure 6D-E; supplemental Figure 5B-E). This shift in the relative vessel-wound resistance determines the redistribution of the blood flow between the wound and the downstream vessel, the blood passing mostly through the downstream vessel network for small injuries and through the wound for large injuries. Altogether, these results indicate that all our experimental data for injuries in human and mouse vessels were obtained under constant flow conditions, which explains the inverse relationship between shear rate and injury size.
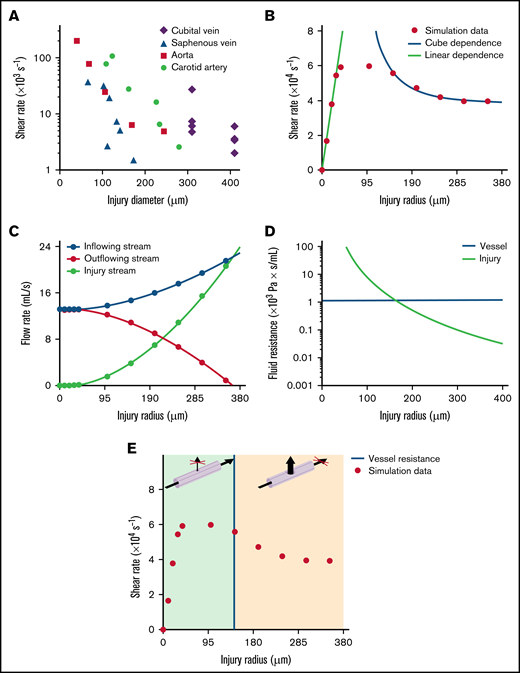
Mechanism governing the decrease in shear rate with increasing wound size. (A) The graph shows the maximum shear rates at the edge of the wound after puncture of the carotid artery, aorta, saphenous vein, or median cubital vein, as a function of the diameter of the injury. Individual symbols represent individual mice or donors. (B-E) Simulations of puncture of the median cubital vein without a catheter. (B) The dot plot shows the maximum shear rates at the edge of the wound calculated with the hybrid model, as a function of the radius of the injury. Individual symbols represent individual simulations. The dots are approximated by linear (linear dependence) and inverse cube (cube dependence) functions for injury radii of 0 to 30 μm and 150 to 350 μm, with adjusted R2 values of 0.99 and 0.98, respectively. (C) The curves show the blood flow rate upstream (inflowing stream) and downstream (outflowing stream) of the site of injury and through the wound (injury stream) calculated with the hybrid model, as a function of the radius of the injury. Individual symbols represent individual simulations. (D) The green curve represents the hydrodynamic resistance of the wound, as a function of the radius of the injury. The horizontal blue line represents the hydrodynamic resistance of the median cubital vein. (E) The dot plot shows the maximum shear rates at the edge of the wound calculated with the hybrid model, as a function of the radius of the injury. Individual symbols represent individual simulations. The vertical blue line represents the threshold value of the radius of the injury at which the hydrodynamic resistance of the median cubital vein is equal to that of the wound. The green and orange areas indicate the ranges of injury radii for which the blood flow passes mostly through the downstream vessel network or through the injury, respectively, as shown in the 3D schemas above.
Mechanism governing the decrease in shear rate with increasing wound size. (A) The graph shows the maximum shear rates at the edge of the wound after puncture of the carotid artery, aorta, saphenous vein, or median cubital vein, as a function of the diameter of the injury. Individual symbols represent individual mice or donors. (B-E) Simulations of puncture of the median cubital vein without a catheter. (B) The dot plot shows the maximum shear rates at the edge of the wound calculated with the hybrid model, as a function of the radius of the injury. Individual symbols represent individual simulations. The dots are approximated by linear (linear dependence) and inverse cube (cube dependence) functions for injury radii of 0 to 30 μm and 150 to 350 μm, with adjusted R2 values of 0.99 and 0.98, respectively. (C) The curves show the blood flow rate upstream (inflowing stream) and downstream (outflowing stream) of the site of injury and through the wound (injury stream) calculated with the hybrid model, as a function of the radius of the injury. Individual symbols represent individual simulations. (D) The green curve represents the hydrodynamic resistance of the wound, as a function of the radius of the injury. The horizontal blue line represents the hydrodynamic resistance of the median cubital vein. (E) The dot plot shows the maximum shear rates at the edge of the wound calculated with the hybrid model, as a function of the radius of the injury. Individual symbols represent individual simulations. The vertical blue line represents the threshold value of the radius of the injury at which the hydrodynamic resistance of the median cubital vein is equal to that of the wound. The green and orange areas indicate the ranges of injury radii for which the blood flow passes mostly through the downstream vessel network or through the injury, respectively, as shown in the 3D schemas above.
Discussion
The main finding of this study is that various types of lesions in small and large mouse and human blood vessels result in extremely high shear rates at the edge of the wound where hemostasis occurs. Such shear levels far exceed those observed in healthy vessels under homeostatic conditions and are even more elevated than those found in pathological arteries with evolved atherosclerotic plaques, in which very high shear rates appear at the apex of a stenosis. Our results indicate that high shear is not restricted to pathological conditions and can also occur in healthy vessels following an injury. We also demonstrate the presence of elevated levels of elongational flow in the wound with values far >1000 s−1, known to efficiently unfold circulating vWF. This further highlights the notion that such rheological conditions are not specific to arterial thrombosis.
Our study indicates that upon vessel puncture, the shear rate reaches elevated values ranging from 103 to 106 s−1. These levels might seem surprisingly high but are in general agreement with a numerical study predicting that shear in a wound could be higher than in intact vessels.21 Our results are also concordant with work based on an in vitro device mimicking vessel injury, which indicated that shear rates in the wound could reach 10 000 s−1.30 The 2 latter studies nevertheless propose lower shear levels in the wound as compared with our in vivo measurements, which could be due to the fact that their calculations were based on a model of pressure difference between the circulation system and the outside. Another explanation might be that both studies focused on small arteries of capillary size, unlike in our work.
Our findings indicate that the blood flow after a puncture injury occurs under a “constant flow regime” for wounds with a radius well above that of the threshold fluid resistance (determined by the relative hydrodynamic resistance of the wound and the vessel) and under a “constant pressure regime” for wounds with a radius well below that of the threshold resistance. It is known that occlusive thrombus formation can occur only under a flow regime with a constant pressure drop, which correlates with our prediction that large wounds are less likely to close. This also explains why the disruption model led to smaller increases in shear rate. However, in our study it was technically impossible to realize injuries with a smaller diameter resulting in a “constant pressure regime.” Other studies also faced such technical limitations, notably a publication using an experimental hemostasis model based on laser injury of the saphenous vein where the injury diameter reached 48 μm.31
The approaches employed in this study present some limitations, notably the fact that we used smooth borders in the in silico model, and that vessel contraction was considered to be negligible because it was not detected by intravital microscopy. The model also does not take into account the thrombus formation in the wound, which does not change our main message, as a reduction in injury size would increase the shear as for a constant flow system. In addition, the blood flow was simulated as a laminar fluid, and its pulsatility was not taken into account. These assumptions were legitimate because the Reynold numbers were lower than the critical values (Re < 4 for all vessels) and the shear rates were high. As the order of magnitude of the shear rates after vessel injury being elevated (>103 s−1), one may postulate that these limitations did not affect the main results.
The nature of thrombus formation in our hemostasis model is in agreement with studies of other groups. We have the same dynamic of reversible platelet plug formation and comparable bleeding time for the same type of injury (for saphenous vein bleeding time was 4 to 20 seconds for 48 µm of injury diameter31 vs 37 seconds for 66 µm of injury diameter [A.A.Y., K.R.B., G.A.B., G.Z., A.E., F.I.A., C.G., M.A.P. and P.H.M., unpublished data]). The composition of thrombus was also similar, and the plug was composed mostly of tightly packed platelets with a small proportion of RBC and fibrin detected on the surface. Compared with work of Tomaiuolo et al, thrombi have the same composition, but although ours remained mainly located in the extravascular space, theirs were mainly located on the intraluminal side of the vessel wall.32
The high shear occurring at the edge of a wound is consistent with our knowledge of the molecular mechanisms of hemostasis. Indeed, platelet aggregation is strongly dependent on the GPIb-IX/vWF axis at high shear rates. Despite that our study was performed mostly in large vessels and not in the microvasculature, it may be considered that high shear rates also take place there because the bleeding phenotype observed in patients deficient in the high shear sensitive molecules GPIb-IX or vWF occur generally in the microvasculature.
Recently, shear-selective antiplatelet therapies have been proposed as an innovative treatment to prevent pathological thrombus formation while only modestly increasing the risk of bleeding. Two approaches to block high shear-mediated thrombosis were proposed, one focusing on inhibition of the shear-driven interaction between the vWF A1 domain and GPIbα, and the second based on shear-sensitive vehicles of antithrombotic agents, which release their contents only under high shear rates.18,19 As our study shows that elevated shear also occurs at the edge of a wound in healthy vessels, one may speculate that targeting high shear will probably not be devoid of bleeding complications after traumatic injuries (falls, trauma, surgery, etc).
In conclusion, we report that various types of lesions in small and large mouse and human blood vessels can result in extremely high shear rates and elongational flows. Such rheological conditions are therefore relevant to the physiological process of hemostasis and cannot be considered to be exclusively pathological.
Acknowledgments
The authors thank J.N. Mulvihill for reviewing the English of the manuscript and J.Y. Rinckel and F. Proamer for help in preparing the samples for SEM.
This work was supported by the Ministry of Education and Science of Russia grant 075-15-2022-242.
Authorship
Contribution: A.A.Y. acquired and analyzed the data; K.R.B. performed the human experiments; A.A.Y., G.A.B., and G.Z. carried out the computational experiments; A.A.Y., M.A.P., and P.H.M. interpreted the data and wrote the manuscript; A.E. and A.A.Y. performed the SEM experiments and analyzed the data; C.G. and F.I.A. handled funding; and M.A.P. and P.H.M. conceived and designed the research and handled funding and supervision.
Conflict-of-interest disclosure: The authors declare no competing financial interests.
Correspondence: Pierre H. Mangin, Université de Strasbourg, INSERM, EFS Grand-Est, BPPS UMR-S1255, FMTS, 10 rue Spielmann, F-67065 Strasbourg, France; e-mail: pierre.mangin@efs.sante.fr; and Mikhail A. Panteleev, Center for Theoretical Problems of Physicochemical Pharmacology, Russian Academy of Sciences, Moscow 119991, Russia; e-mail: mapanteleev@yandex.ru.

