

Key Points
HMGA2 expression associates with immature cells in normal and leukemic context.
Poor prognosis HMGA2+ AMLs share a unique transcriptional signature and sensitivity to G2/M inhibitors.

Abstract
High-mobility group AT-hook 2 (HMGA2) is a nonhistone chromatin-binding protein that is normally expressed in stem cells of various tissues and aberrantly detected in several tumor types. We recently observed that one-fourth of human acute myeloid leukemia (AML) specimens express HMGA2, which associates with a very poor prognosis. We present results indicating that HMGA2+ AMLs share a distinct transcriptional signature representing an immature phenotype. Using single-cell analyses, we showed that HMGA2 is expressed in CD34+ subsets of stem cells and early progenitors, whether normal or derived from AML specimens. Of interest, we found that one of the strongest gene expression signatures associated with HMGA2 in AML is the upregulation of G2/M checkpoint genes. Whole-genome CRISPR/Cas9 screening in HMGA2 overexpressing cells further revealed a synthetic lethal interaction with several G2/M checkpoint genes. Accordingly, small molecules that target G2/M proteins were preferentially active in vitro and in vivo on HMGA2+ AML specimens. Together, our findings suggest that HMGA2 is a key functional determinant in AML and is associated with stem cell features, G2/M status, and related drug sensitivity.
Introduction
High-mobility group AT-hook 2 (HMGA2) is a nonhistone chromatin-binding protein known as an architectural transcriptional factor. Without any transcriptional activity of its own, HMGA2 binds to the minor groove of AT-rich DNA sequences to alter the chromatin structure and acts, positively or negatively, on the transcription of target genes.1 HMGA2 regulates numerous pathways in a context-dependent manner, which include cell cycle control, DNA repair, E2F, NF-ΚB, transforming growth factor-β, and the epithelial–mesenchymal transition.2 Although its expression is silenced in most human adult tissues,3,4 HMGA2 is ubiquitously expressed during embryogenesis, where it is critical for development and cell growth. Abnormal re-expression of HMGA2 in several solid neoplasms has been reported and is linked to chemo-resistance, advanced tumor grade, and poor prognosis.5-8
In mouse and human hematopoiesis, HMGA2 is preferentially expressed in hematopoietic stem and progenitor cells (HSPCs), at fetal and adult stages.9,10 Previous reports showed that HMGA2 promotes expansion of myeloid progenitors11 and that its overexpression in mouse bone marrow (BM) leads to a growth advantage and clonal expansion of HSPCs.12 Overexpression of HMGA2 in transgenic mice is also sufficient to induce tumor development, including hematologic malignancies.13-15
We previously showed that elevated HMGA2 levels identify a subgroup of AML patients with lower frequency of complete remission, higher frequency of relapse, and resistance to induction therapy.16 We established that HMGA2 expression predicts poor clinical outcome in AML, independently of cytogenetic risk, and that it represents a novel prognosis marker for this disease. Indeed, positivity for HMGA2 in high-risk AML patients further decreases the prognosis to near zero, defining a very-high-risk category for which no curative therapy is available.
In this report, we studied HMGA2 expression at the single-cell level and show that HMGA2 is predominantly expressed in stem and early progenitors, whether normal or leukemic. Using CRISPR/Cas9 whole-genome screening, we identified vulnerabilities of HMGA2 overexpressing leukemic cells in a cell cycle G2/M checkpoint. This finding was further confirmed in vitro and in vivo with the use of chemical inhibitors and may provide new therapeutic avenues for this poorly curable disease.
Methods
Study approval
The Leucegene project is an initiative approved by the Research Ethics Boards of Université de Montréal and Maisonneuve-Rosemont Hospital. All leukemia samples and paired normal DNA specimens were collected and characterized by the Quebec Leukemia Cell Bank after obtaining an institutional Research Ethics Board–approved protocol with informed consent according to the Declaration of Helsinki. The Quebec Leukemia Cell Bank is a biobank certified by the Canadian Tissue Repository Network.
Cytogenetic analyses and cohort definitions
Cytogenetic aberrations and composite karyotypes of the Leucegene cohort were described according to the International System for Human Cytogenomic Nomenclature 2016 guidelines.17 Complex karyotype was defined as having ≥3 clonal chromosomal abnormalities in the absence of World Health Organization–designated recurrent genetic abnormalities, including t(8;21), inv(16) or t(16;16), t(9;11), t(6;9), inv(3) or t(3;3), and AML with BCR-ABL1.18
Whole-genome CRISPR/Cas9 screen
The extended-knockout pooled lentiviral library composed of 278 754 single-guide RNAs (sgRNAs) targeting 19 084 RefSeq genes, 3872 hypothetical open reading frames, and 20 852 alternatively spliced isoforms developed by Bertomeu et al19 was used for whole-genome CRISPR/Cas9 screen. This library, for which each gene is targeted by ∼10 sgRNAs, was introduced within a clone of the OCI-AML5 cell line expressing a doxycycline-inducible Cas9. Cells were infected at a multiplicity of infection of 5 with HMGA2-YFP and control YFP lentiviral vectors (backbone, MNDU-pgk-YFP) in media supplemented with polybrene for 48 hours. Infection efficiency, determined by the percentage of YFP+ cells, was monitored by using flow cytometry. The extended-knockout library (kept at a minimum of 500 cells per sgRNA) was then cultured in 10% fetal bovine serum Dulbecco’s modified Eagle medium supplemented with 2 μg/mL doxycycline for a period of 7 days to induce knockouts. The infected library was maintained in culture 7 more days without doxycycline. Cell concentration and percentage of YFP+ cells were assessed every 2 days. Finally, genomic DNA was extracted by cell lysis in buffer containing 50 mM Tris, 50 mM EDTA, and 1% sodium dodecyl sulfate and treated with proteinase K followed by RNAse and then precipitation of proteins with 7.5 M ammonium acetate and isopropanol precipitation of genomic DNA. sgRNA sequences were recovered and fitted with Illumina adaptors by polymerase chain reaction and next-generation sequencing performed on an Illumina HiSeq 2000 device as previously described.19 Resulting reads were trimmed by using Trim Galore (https://www.bioinformatics.babraham.ac.uk/projects/trim_galore/) and aligned to the sgRNA sequences by using Bowtie aligner version 2.3.3.20 Synthetic rescue/positive selection and synthetic lethality/negative selection β scores, as well as statistical significance, were determined by using the MAGeCK-VISPRMAGeCK-MLE method.21
Primary AML sample culture and chemical screens
Freshly thawed primary AML specimens were used for chemical screens. Cryopreserved cells were thawed at 37°C in Iscove modified Dulbecco medium containing 20% fetal bovine serum and DNase I (100 μg/mL). Cells were resuspended in Iscove modified Dulbecco medium supplemented with 15% BIT (bovine serum albumin, insulin, and transferrin; Stemcell Technologies), 100 ng/mL stem cell factor (#100-04; Shenandoah Biotechnology Inc.), 50 ng/mL FLT3L (#100-21; Shenandoah Biotechnology Inc.), 20 ng/mL interleukin-3 (Shenandoah Biotechnology Inc.), 20 ng/mL granulocyte colony-stimulating factor (Shenandoah Biotechnology Inc.), 10−4 mol/L β-mercaptoethanol, gentamicin (50 μg/mL), ciprofloxacin (10 μg/mL), SR1 (500 nmol/L; Alichem), and UM729 (500 nmol/L; IRIC). Cells were plated in 384-well white plates, 5000 cells per well in 50 μL. Compounds were dissolved in dimethyl sulfoxide (DMSO), diluted in media immediately before use, and added to seeded cells in serial dilutions (8 dilutions, 1:3, 10 μM down to 4.5 nM for primary AML screen) in duplicate wells. The exception was daunorubicin, for which dilutions from 1 μM to 0.45 nM were performed. Control wells received DMSO (0.1%) only. Cell viability was evaluated after 6 days in culture using the CellTiterGlo assay (Promega) according to the manufacturer’s instruction. Percentage of inhibition for dose-response curves was calculated as 100 – (100 × [mean luminescence (compound)/mean luminescence (DMSO)]). Fifty percent inhibitory concentration (IC50) values were calculated using ActivityBase SARview Suite (IDBS). Dose-response curves were generated by using nonlinear regression in GraphPad Prism version 6.01 (GraphPad Software). For cases in which compounds failed to inhibit AML cell survival/proliferation, IC50 values were arbitrarily reported at the highest dose tested (10 000 nM).
In vivo treatments on patient-derived xenograft models
All animal procedures complied with recommendations of the Canadian Council on Animal Care and were approved by the Deontology Committee on Animal Experimentation at the University of Montreal. NSG mice were purchased from The Jackson Laboratory and bred in a pathogen-free animal facility. Eight- to twelve-week-old female littermates were randomly assigned to experimental groups and transplanted with 2 million patient-derived xenograft (PDX) cells via the tail vein. Adverse cytogenetic AML specimens 05H179 (EVI1 rearranged) and 09H057 (Complex Karyotype, TP53 mutated) were chosen as relevant models because of their high HMGA2 expression levels. Two weeks after transplantation, mice (5 mice per treatment arm per AML) were treated with volasertib (IV, 10 mg/kg, diluted in 0.9% NaCl, 2 days per week during 4 weeks), AraC (intraperitoneally, 50 mg/kg, diluted in phosphate-buffered saline, 5 days per week during 1 week), or vehicle (IV 0.9% NaCl, intraperitoneal phosphate-buffered saline). Mice were monitored daily, including weight follow-up, to assess tolerability of the treatment. BM aspirations were performed, and collected cells were analyzed by flow cytometry (BD Canto II cytometer). Percentage of leukemic cell engraftment was assessed by using the following antibodies: anti-human CD45 Pacific Blue (#304029; BioLegend), anti-human CD33 PE (#555450; BD Biosciences), anti-human CD3 FITC (#555332; BD Biosciences), anti-human CD19 PE-Cy7 (#557835; BD Biosciences), and anti-mouse CD45.1 APC-eFluor780 (#47-0453-82; eBioscience). Results were analyzed with FlowJo software 10.7.2 (Becton, Dickinson and Company). Investigators were not blinded to treatment groups during the analysis.
Statistical analyses
Statistical differences in dot plots were determined by using the nonparametric Mann-Whitney test. Differences in response to small molecules between genetic groups were evaluated by using a Wilcoxon rank sum test performed on IC50 values in R version 3.1.2 (R Foundation for Statistical Computing). Graphics and statistical analysis were performed by using GraphPad Prism version 6.0.
Results
HMGA2 is expressed in hematopoietic stem cells, early progenitors, and erythroid lineage
The Human Cell Atlas single cell transcriptomic data sets of freshly isolated adult BM was first exploited to better characterize HMGA2 expression (Figure 1A).22 Interestingly, its expression is most prevalent in a subset of CD34+ hematopoietic stem cells (HSCs) (black arrow in Figure 1A-B) with low PCNA expression (Figure 1B), suggestive of a quiescent or low-cycling state. Accordingly, HMGA2-expressing cells distribute preferentially in the G1 cell cycle phase (supplemental Figure 1A). HMGA2 expression was also observed in proliferative megakaryocyte progenitor cells (CD34+), megakaryocyte-erythroid progenitor cells (CD34+), early erythroblasts, and erythroblasts.
![HMGA2 is expressed in HSCs, early progenitors, and erythroid lineage. (A) Overview of hematopoietic cell populations identified in human BM from the Human Cell Atlas data set (integrated data from 8 donors, Uniform Manifold Approximation and Projection [UMAP] reduction, preprocessed data, clusters, and labels adopted from Hay et al22). CD34+ HSC cluster is indicated by the black arrow. (B) UMAP plot of HMGA2, CD34, and PCNA expression (MAGIC imputation). (C) Single-cell transcriptomic overview of hematopoietic cell populations identified in human CB cells. Fresh and UM171-expanded CD34+ cells (7 days) were integrated and clustered using Seurat 3 (2 samples each condition, 15 921 cells total). Fifteen cell clusters (left) were identified and defined using Seurat (v3) procedure: HSCs, multipotent progenitors (MPP), lymphoid-primed multipotent progenitors (LMPP), granulo-monocytic progenitors (GMP), megakaryocyte-erythroid progenitors (MEP), common lymphoid progenitors (CLP), pre-dendritic cells (pre-DC), plasmacytoid dendritic cells (pDC), myeloid dendritic cells (mDC), monocytes (Mono), neutrophils (Neut), erythroid progenitors (ERP), megakaryocytes (MK), erythrocytes (Ery), and eosinophils/basophils/mast cells(Eo/Bas/Ma). Unsupervised ordering of the HSCs was done with Seurat 3 integrated results as input to build a tree-like differentiation trajectory using the DDRTree algorithm of the Monocle v3 R package (right). (D) UMAP plot of representative stem cell and lineage associated genes compared with HMGA2 expression (integrated data from fresh and UM171-expanded CB cells, MAGIC imputation). (E) UMAP plot of representative stem cell, lineage, and proliferative genes in fresh CD34+ CB cells vs UM171 ex vivo expanded cells (MAGIC imputation). Red circle: non-proliferative CD34+ cells, orange circle: proliferative CD34+ FLT3+ progenitors. (F) Irradiated NSG mice were transplanted with CD34+ cells infected with short hairpin (sh) RNA green fluorescent protein (GFP) vectors targeting HMGA2 gene or a control locus. Twenty weeks after transplantation, reconstitution was assessed by measuring the percentage of human CD45+ GFP+ cells in BM (n = 6, median is depicted, Mann-Whitney U test). Gran, granulocytes.](https://ash.silverchair-cdn.com/ash/content_public/journal/bloodadvances/6/16/10.1182_bloodadvances.2021005828/4/m_advancesadv2021005828f1.png?Expires=1769337640&Signature=DlBdhzlB7CdkrOjFk2OiIfwITBEHucNjg4JgKp-KbtULo1Nw0McKXwMHnj3snpKNiC0frVHWJTazDvjCoZAHxK5mmxURWNeKTQorcxLYzGisOtLA8VJcUfpVnxoh30nkgUrfGNrHMt2PlDPbW18FWT-GRGO66u~ATOMXvDHFTvJmES3-2p1-qHAPRJeWLR~gFNJhs9D3xCjxStgvyHjquMurZnWp-nueZXunEGBi-w~y2wSERDUU~6In5vvfEEt0aR9PaDgM1tO0BPJq2tPhry3MkyiYzPjIeLywc6XOBTLnT31VYmzIIbMePU9nhuST4VNK0AXHeYdeBUR6TQv5wQ__&Key-Pair-Id=APKAIE5G5CRDK6RD3PGA)
HMGA2 is expressed in HSCs, early progenitors, and erythroid lineage. (A) Overview of hematopoietic cell populations identified in human BM from the Human Cell Atlas data set (integrated data from 8 donors, Uniform Manifold Approximation and Projection [UMAP] reduction, preprocessed data, clusters, and labels adopted from Hay et al22 ). CD34+ HSC cluster is indicated by the black arrow. (B) UMAP plot of HMGA2, CD34, and PCNA expression (MAGIC imputation). (C) Single-cell transcriptomic overview of hematopoietic cell populations identified in human CB cells. Fresh and UM171-expanded CD34+ cells (7 days) were integrated and clustered using Seurat 3 (2 samples each condition, 15 921 cells total). Fifteen cell clusters (left) were identified and defined using Seurat (v3) procedure: HSCs, multipotent progenitors (MPP), lymphoid-primed multipotent progenitors (LMPP), granulo-monocytic progenitors (GMP), megakaryocyte-erythroid progenitors (MEP), common lymphoid progenitors (CLP), pre-dendritic cells (pre-DC), plasmacytoid dendritic cells (pDC), myeloid dendritic cells (mDC), monocytes (Mono), neutrophils (Neut), erythroid progenitors (ERP), megakaryocytes (MK), erythrocytes (Ery), and eosinophils/basophils/mast cells(Eo/Bas/Ma). Unsupervised ordering of the HSCs was done with Seurat 3 integrated results as input to build a tree-like differentiation trajectory using the DDRTree algorithm of the Monocle v3 R package (right). (D) UMAP plot of representative stem cell and lineage associated genes compared with HMGA2 expression (integrated data from fresh and UM171-expanded CB cells, MAGIC imputation). (E) UMAP plot of representative stem cell, lineage, and proliferative genes in fresh CD34+ CB cells vs UM171 ex vivo expanded cells (MAGIC imputation). Red circle: non-proliferative CD34+ cells, orange circle: proliferative CD34+ FLT3+ progenitors. (F) Irradiated NSG mice were transplanted with CD34+ cells infected with short hairpin (sh) RNA green fluorescent protein (GFP) vectors targeting HMGA2 gene or a control locus. Twenty weeks after transplantation, reconstitution was assessed by measuring the percentage of human CD45+ GFP+ cells in BM (n = 6, median is depicted, Mann-Whitney U test). Gran, granulocytes.
HMGA2 is expressed in HSCs, early progenitors, and erythroid lineage. (A) Overview of hematopoietic cell populations identified in human BM from the Human Cell Atlas data set (integrated data from 8 donors, Uniform Manifold Approximation and Projection [UMAP] reduction, preprocessed data, clusters, and labels adopted from Hay et al22 ). CD34+ HSC cluster is indicated by the black arrow. (B) UMAP plot of HMGA2, CD34, and PCNA expression (MAGIC imputation). (C) Single-cell transcriptomic overview of hematopoietic cell populations identified in human CB cells. Fresh and UM171-expanded CD34+ cells (7 days) were integrated and clustered using Seurat 3 (2 samples each condition, 15 921 cells total). Fifteen cell clusters (left) were identified and defined using Seurat (v3) procedure: HSCs, multipotent progenitors (MPP), lymphoid-primed multipotent progenitors (LMPP), granulo-monocytic progenitors (GMP), megakaryocyte-erythroid progenitors (MEP), common lymphoid progenitors (CLP), pre-dendritic cells (pre-DC), plasmacytoid dendritic cells (pDC), myeloid dendritic cells (mDC), monocytes (Mono), neutrophils (Neut), erythroid progenitors (ERP), megakaryocytes (MK), erythrocytes (Ery), and eosinophils/basophils/mast cells(Eo/Bas/Ma). Unsupervised ordering of the HSCs was done with Seurat 3 integrated results as input to build a tree-like differentiation trajectory using the DDRTree algorithm of the Monocle v3 R package (right). (D) UMAP plot of representative stem cell and lineage associated genes compared with HMGA2 expression (integrated data from fresh and UM171-expanded CB cells, MAGIC imputation). (E) UMAP plot of representative stem cell, lineage, and proliferative genes in fresh CD34+ CB cells vs UM171 ex vivo expanded cells (MAGIC imputation). Red circle: non-proliferative CD34+ cells, orange circle: proliferative CD34+ FLT3+ progenitors. (F) Irradiated NSG mice were transplanted with CD34+ cells infected with short hairpin (sh) RNA green fluorescent protein (GFP) vectors targeting HMGA2 gene or a control locus. Twenty weeks after transplantation, reconstitution was assessed by measuring the percentage of human CD45+ GFP+ cells in BM (n = 6, median is depicted, Mann-Whitney U test). Gran, granulocytes.
We also analyzed HMGA2 expression by single-cell RNA-sequencing in human CD34+ cells purified from cord blood (CB), either fresh or after a 7-day culture in the presence of the small molecule UM171, which is able to maintain functional HSPCs in culture.23,24 As found in BM CD34+ populations, HMGA2 expression in CB is mostly detected in HSPCs coexpressing CD34, AVP, and HLF (Figure 1C-D; supplemental Figure 1B-C). Uniform Manifold Approximation and Projection of hematopoietic hierarchy clearly shows that HMGA2 expression markedly decreases along with differentiation, being nearly absent in mature cells at the exception of the erythroid lineage. Interestingly, the pattern of HMGA2 expression changes upon ex vivo culture. Indeed, although HMGA2 is markedly expressed in noncycling cells from fresh CB, its expression becomes more prominent in proliferative CD34+FLT3+ progenitors in culture, concomitant with MKI67 expression (orange vs red circles in Figure 1E and supplemental Figure 1D-E). Again, CD34+AVP+HMGA2+ HSC candidates remain mostly negative for MKI67 in cultured cells.
HMGA2high AML share an immature transcriptional signature
To assess the functional role of HMGA2 in AML, we looked at HMGA2 expression in the Leucegene cohort comprising 452 primary AML specimens representative of the AML subgroup diversity. HMGA2 expression comprised between 0 and 17.1 reads per kilobase of transcript per million reads mapped (RPKM) (log transformed scale, Figure 2A), and we thus defined extreme groups of AML samples with HMGA2 null (RPKM = 0, n = 83 or 18.4% of the cohort) or HMGA2 high (RPKM >2, n = 39 or 8.6% of the cohort) expression. As found with normal CD34+ cells, Gene Set Enrichment Analysis revealed a strong enrichment for an HSC gene signature in HMGA2high AMLs (Figure 2B; supplemental Table 1), again indicating a stem cell–like identity associated with this gene. Multidimensional scaling (MDS) analysis also showed that specimens with high HMGA2 expression cluster together, independently of their genetic subgroup affiliation, suggesting that a specific HMGA2 transcriptional signature exists in AML and that HMGA2high AML represents a distinct entity (Figure 2C-D).
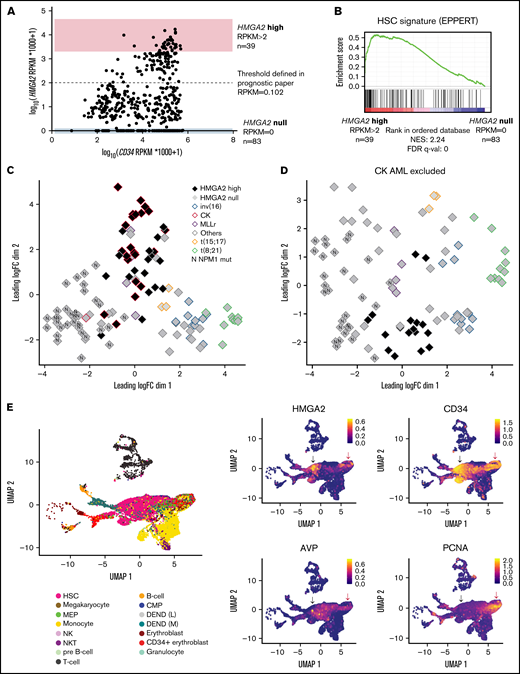
HMGA2high AML share an immature transcriptional signature. (A) Dot plot representation of HMGA2 and CD34 expression assessed by total RNA-sequencing in the Leucegene cohort of 452 primary AML specimens. Log-transformed scale is used to better visualize AMLs with low expression of these markers. Extreme AML groups of HMGA2 expression are depicted, and dotted line defines HMGA2 positivity threshold defined in our previous prognostic paper.16 (B) Gene Set Enrichment Analysis plot comparing HMGA2high (RPKM >2; n = 39) vs HMGA2 null (RPKM = 0; n = 83) transcriptomic signatures in primary AML specimens. Results obtained for EPPERT_HSC_R gene set that includes upregulated genes in HSC-enriched populations. (C) MDS constructed using expression data (100 genes presenting the largest standard deviations between samples, excluding HMGA2) obtained from inv(16), CK, MLL-rearranged (MLLr), t(15;17), t(8;21), NPM1 mutated (N), and other subgroups, presenting either high (>2 RPKM) or null HMGA2 expression. The subgroup denominated as “others” is composed of samples presenting none of the alterations defining the plotted groups. (D) Same analysis as in panel C with the exclusion of CK AML specimens. (E) Single-cell transcriptomic overview obtained from the integration of 5 primary AML specimen data sets from Petti et al.29 Only leukemic cells, defined by the presence of at least 1 somatic mutation, are displayed. Black arrow: non-cycling HMGA2+ cells, red arrow: cycling HMGA2+ cells. Cell type annotations were adopted as published: HSC, megakaryocyte-erythroid progenitors (MEP), common myeloid progenitor (CMP), natural killer (NK), and natural killer T (NKT) (left). Uniform Manifold Approximation and Projection (UMAP) plot of HMGA2, stem cell, and proliferative genes (right). FDR, false discovery rate; NES, normalized enrichment score.
HMGA2high AML share an immature transcriptional signature. (A) Dot plot representation of HMGA2 and CD34 expression assessed by total RNA-sequencing in the Leucegene cohort of 452 primary AML specimens. Log-transformed scale is used to better visualize AMLs with low expression of these markers. Extreme AML groups of HMGA2 expression are depicted, and dotted line defines HMGA2 positivity threshold defined in our previous prognostic paper.16 (B) Gene Set Enrichment Analysis plot comparing HMGA2high (RPKM >2; n = 39) vs HMGA2 null (RPKM = 0; n = 83) transcriptomic signatures in primary AML specimens. Results obtained for EPPERT_HSC_R gene set that includes upregulated genes in HSC-enriched populations. (C) MDS constructed using expression data (100 genes presenting the largest standard deviations between samples, excluding HMGA2) obtained from inv(16), CK, MLL-rearranged (MLLr), t(15;17), t(8;21), NPM1 mutated (N), and other subgroups, presenting either high (>2 RPKM) or null HMGA2 expression. The subgroup denominated as “others” is composed of samples presenting none of the alterations defining the plotted groups. (D) Same analysis as in panel C with the exclusion of CK AML specimens. (E) Single-cell transcriptomic overview obtained from the integration of 5 primary AML specimen data sets from Petti et al.29 Only leukemic cells, defined by the presence of at least 1 somatic mutation, are displayed. Black arrow: non-cycling HMGA2+ cells, red arrow: cycling HMGA2+ cells. Cell type annotations were adopted as published: HSC, megakaryocyte-erythroid progenitors (MEP), common myeloid progenitor (CMP), natural killer (NK), and natural killer T (NKT) (left). Uniform Manifold Approximation and Projection (UMAP) plot of HMGA2, stem cell, and proliferative genes (right). FDR, false discovery rate; NES, normalized enrichment score.
We next investigated whether HMGA2 expression in HMGA2high AMLs was caused by cancer-related anomalies such as gene translocation, gene amplification, or 3′ untranslated region (3′ UTR) truncation.5,25-28 To address this, we analyzed the HMGA2 locus in HMGA2high AMLs by low-pass whole-genome sequencing and transcriptomics, and did not detect any gene amplifications (supplemental Figure 2A), fusions, or 3′ UTR truncations that could explain the aberrant HMGA2 expression observed in a subset of our AML cohort.
Interestingly, single-cell RNA-sequencing analysis of primary AMLs (from Petti et al29 ) showed that, when expressed, HMGA2 is restricted to a subset of CD34+ leukemic cells (Figure 2E; supplemental Figure 2B). As observed in normal hematopoiesis, HMGA2 expression in leukemic cells was observed in both noncycling cells - that coexpress the primitive marker AVP, lack PCNA expression as well as differentiation markers such as ELANE and FCGR3A (likely quiescent stem cells [black arrow in Figure 2E and supplemental Figure 2C]) - and in cycling progenitor cells (red arrow in Figure 2E and supplemental Figure 2C). Together, these data suggest that HMGA2 expression in AML is determined by the cell of origin rather than acquired through genetic events and points to a particular leukemia subset that originates from primitive CD34+ BM cells. To support this, HMGA2high AMLs display a HMGA2 expression level comparable to that of primitive CD34+ and CD34+CD45RA– human cells (supplemental Figure 2D).
Genome-wide search for vulnerabilities associated with HMGA2 expression
HMGA2+ AMLs remain extremely difficult to cure,16 representing a true unmet medical need. To identify vulnerabilities linked to this AML subgroup, we turned to genome-wide approaches. First, we looked at genetic dependencies and small molecule sensitivities associated with HMGA2 using the Cancer Dependency Map (DepMap). However, this showed poor codependencies, with the best gene (MSRB3) presenting a Pearson correlation of only 0.28 with HMGA2. Next, we engineered an AML cell line overexpressing HMGA2 (OCI-AML5) (Figure 3A), whose proliferation was not altered by this manipulation (Figure 3B), and conducted a whole-genome CRISPR/Cas9 screen in these cells with a particular focus on synthetic lethal genes (Figure 3C). Focusing on genes conferring a growth disadvantage, several pathways with potential for therapeutic intervention were identified (Figure 3D-E; supplemental Table 2). In line with the known functions of HMGA2 in the stability of replication forks30 and telomeres,31 we found synthetic lethal interactions between HMGA2 overexpression and the loss of genes involved in DNA replication and telomere maintenance. Interestingly, this genomic screen also identified synthetic lethal interactions between HMGA2 and the loss of genes involved in cell cycle regulation and DNA repair. In particular, disruption of genes regulating cell cycle phase transition appeared critical, which is further supported by a role of HMGA2 in maintaining genome stability.32,33 In line with the upregulation of a G2/M checkpoint gene signature identified in HMGA2high primary AML specimens (Figure 3F), G2/M cell cycle phase transition was also pinpointed in this CRISPR screen.
![Whole-genome CRISPR/Cas9 screen identifies cell cycle regulation as a vulnerability in HMGA2-expressing cells. (A) Western blot validation of HMGA2 protein expression in Cas9 OCI-AML5 15 days after infection with HMGA2-YFP and YFP vectors. (B) After infection with HMGA2-YFP– and YFP-expressing vectors, the percentage of YFP-expressing cells was monitored by flow cytometry during the course of CRISPR/Cas9 whole-genome screen. (C) Schematic overview of the CRISPR/Cas9 whole-genome screen performed in Cas9 OCI-AML5 cells containing the Extended Knockout sgRNA library. (D) Volcano plot representing results of whole-genome CRISPR/Cas9 screen performed in OCI-AML5 cells overexpressing HMGA2 compared with YFP control vector. Most significant genes belonging to the Gene Ontology (GO) terms 1901987 (regulation of cell cycle phase transition, P value = 5.0E-16, false discovery rate [FDR] q-value = 1.1E-13) and 0006281 (DNA repair, P value = 1.2E-13, FDR q-value = 1.9E-11) that enriched in synthetic lethal interaction are depicted. ATR, CHEK1, and WEE1 are also depicted. Asterisks indicate genes belonging to both GO terms. (E) Nonexhaustive list of significant GO terms associated with synthetic lethality in cells overexpressing HMGA2 compared with YFP control cells. (F) Gene Set Enrichment Analysis plot comparing HMGA2 high (RPKM >2; n = 39) vs HMGA2 null (RPKM = 0; n = 83) transcriptomic signatures in primary AML specimens. Results obtained for G2/M checkpoint hallmark gene set. DOX, doxycycline; ER, endoplasmic reticulum; NES, normalized enrichment score.](https://ash.silverchair-cdn.com/ash/content_public/journal/bloodadvances/6/16/10.1182_bloodadvances.2021005828/4/m_advancesadv2021005828f3.png?Expires=1769337640&Signature=gqjhQrmpzm7LTTPeFf-tvkYykunddvsTcPPi2ktvrlUAnsZF-VvPh6AsX29RQY0loCqUycBz235JGjxKyPSnuNJA6uTwydIJFAwNCOrXn9eM51n9zJIm3lL-B0zIv9heBvh2UrDbZYaSnoNnkt~SdpLK~yom8AW~3gYPzZAXUi0QPAT1l~ktMKsm5VFEEeFakXxdcbB2A7tmrR77HZ5lrzGyqazGYkGFZi1gnWJuajk0S8WlNP~9usAAT~AexxRamM4hzGt9XWm2ogrXzoUncI--Z0bNiI4SeMUE282k8np0joU1Vy7a5f0mXqpsWggxtWiCv~PLNSZ98k1JDgVxGg__&Key-Pair-Id=APKAIE5G5CRDK6RD3PGA)
Whole-genome CRISPR/Cas9 screen identifies cell cycle regulation as a vulnerability in HMGA2-expressing cells. (A) Western blot validation of HMGA2 protein expression in Cas9 OCI-AML5 15 days after infection with HMGA2-YFP and YFP vectors. (B) After infection with HMGA2-YFP– and YFP-expressing vectors, the percentage of YFP-expressing cells was monitored by flow cytometry during the course of CRISPR/Cas9 whole-genome screen. (C) Schematic overview of the CRISPR/Cas9 whole-genome screen performed in Cas9 OCI-AML5 cells containing the Extended Knockout sgRNA library. (D) Volcano plot representing results of whole-genome CRISPR/Cas9 screen performed in OCI-AML5 cells overexpressing HMGA2 compared with YFP control vector. Most significant genes belonging to the Gene Ontology (GO) terms 1901987 (regulation of cell cycle phase transition, P value = 5.0E-16, false discovery rate [FDR] q-value = 1.1E-13) and 0006281 (DNA repair, P value = 1.2E-13, FDR q-value = 1.9E-11) that enriched in synthetic lethal interaction are depicted. ATR, CHEK1, and WEE1 are also depicted. Asterisks indicate genes belonging to both GO terms. (E) Nonexhaustive list of significant GO terms associated with synthetic lethality in cells overexpressing HMGA2 compared with YFP control cells. (F) Gene Set Enrichment Analysis plot comparing HMGA2 high (RPKM >2; n = 39) vs HMGA2 null (RPKM = 0; n = 83) transcriptomic signatures in primary AML specimens. Results obtained for G2/M checkpoint hallmark gene set. DOX, doxycycline; ER, endoplasmic reticulum; NES, normalized enrichment score.
Whole-genome CRISPR/Cas9 screen identifies cell cycle regulation as a vulnerability in HMGA2-expressing cells. (A) Western blot validation of HMGA2 protein expression in Cas9 OCI-AML5 15 days after infection with HMGA2-YFP and YFP vectors. (B) After infection with HMGA2-YFP– and YFP-expressing vectors, the percentage of YFP-expressing cells was monitored by flow cytometry during the course of CRISPR/Cas9 whole-genome screen. (C) Schematic overview of the CRISPR/Cas9 whole-genome screen performed in Cas9 OCI-AML5 cells containing the Extended Knockout sgRNA library. (D) Volcano plot representing results of whole-genome CRISPR/Cas9 screen performed in OCI-AML5 cells overexpressing HMGA2 compared with YFP control vector. Most significant genes belonging to the Gene Ontology (GO) terms 1901987 (regulation of cell cycle phase transition, P value = 5.0E-16, false discovery rate [FDR] q-value = 1.1E-13) and 0006281 (DNA repair, P value = 1.2E-13, FDR q-value = 1.9E-11) that enriched in synthetic lethal interaction are depicted. ATR, CHEK1, and WEE1 are also depicted. Asterisks indicate genes belonging to both GO terms. (E) Nonexhaustive list of significant GO terms associated with synthetic lethality in cells overexpressing HMGA2 compared with YFP control cells. (F) Gene Set Enrichment Analysis plot comparing HMGA2 high (RPKM >2; n = 39) vs HMGA2 null (RPKM = 0; n = 83) transcriptomic signatures in primary AML specimens. Results obtained for G2/M checkpoint hallmark gene set. DOX, doxycycline; ER, endoplasmic reticulum; NES, normalized enrichment score.
In contrast, fewer genes were identified that conferred a growth advantage (ie, synthetic rescue) when disrupted concomitantly with HMGA2 overexpression (supplemental Table 2). This included a known HMGA2-interacting partner, PARK2 (Parkin E3 ubiquitin-protein ligase)34 ; however, no significant enrichment for canonical pathways was observed.
G2/M checkpoint inhibitors are particularly active on HMGA2+ AMLs
To further investigate results obtained from the CRISPR/Ca9 screen, we screened a selected library of cell cycle and DNA damage protein inhibitors (Figure 4A) on 38 primary AML specimens (Figure 4B). Tested samples included complex karyotype (CK) and intermediate-risk AML specimens chosen from the Leucegene cohort according to their TP53 and HMGA2 status. Overall results showed strong antiproliferative activity of CHK1 and dual CHK1/CHK2 inhibitors on primary specimens, contrasting sharply with the lack of activity of selective CHK2 inhibitors (supplemental Figure 3A-B; supplemental Table 3). The most active compounds were also directed against ATR (VE-822), WEE1 (MK-1775), poly(ADP-ribose) polymerase (talazoparib), and phosphatidylinositol 3-kinase (PI3K; PI-103) activity, whereas ATM, DNA-dependent protein kinase (DNA-PK), CHK2, replication protein A (RPA), and broad DNA-PK/PI3K inhibitors did not show substantial activity on these primary specimens.
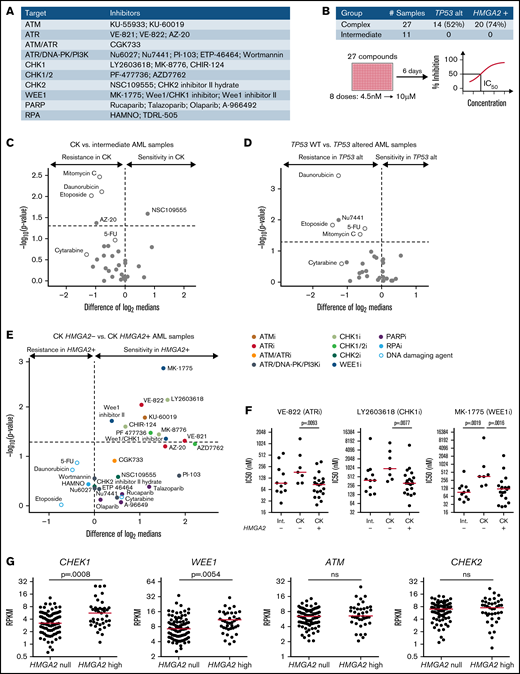
Increased sensitivity of HMGA2+ primary AMLs toward G2/M checkpoint inhibitors. (A) List of inhibitors and their primary target(s) used in the chemical screen. Genotoxic agents used as controls are not listed. (B) Repartition of the primary AML specimens selected and screen layout. Volcano plot showing the differential compound sensitivity in CK vs intermediate-risk AML specimens (C), TP53 wild-type (WT) vs TP53 altered AML samples (D), and CK HMGA2– vs CK HMGA2+ samples (E). White dots represent genotoxic agents. (F) Dot plot comparison of representative ATR, CHK1, and WEE1 inhibitors between intermediate, CK HMGA2–, and CK HMGA2+ specimens (median is depicted, Mann-Whitney U test). (G) CHEK1, WEE1, ATM, and CHEK2 messenger RNA expression in HMGA2 null (RPKM = 0; n = 83) and HMGA2 high (RPKM >2; n = 39) AML samples (median is depicted, Mann-Whitney U test). 5-FU, 5-fluorouracil; ns, not significant; PARP, poly(ADP-ribose) polymerase.
Increased sensitivity of HMGA2+ primary AMLs toward G2/M checkpoint inhibitors. (A) List of inhibitors and their primary target(s) used in the chemical screen. Genotoxic agents used as controls are not listed. (B) Repartition of the primary AML specimens selected and screen layout. Volcano plot showing the differential compound sensitivity in CK vs intermediate-risk AML specimens (C), TP53 wild-type (WT) vs TP53 altered AML samples (D), and CK HMGA2– vs CK HMGA2+ samples (E). White dots represent genotoxic agents. (F) Dot plot comparison of representative ATR, CHK1, and WEE1 inhibitors between intermediate, CK HMGA2–, and CK HMGA2+ specimens (median is depicted, Mann-Whitney U test). (G) CHEK1, WEE1, ATM, and CHEK2 messenger RNA expression in HMGA2 null (RPKM = 0; n = 83) and HMGA2 high (RPKM >2; n = 39) AML samples (median is depicted, Mann-Whitney U test). 5-FU, 5-fluorouracil; ns, not significant; PARP, poly(ADP-ribose) polymerase.
Comparison of sensitivity profiles of CK and intermediate-risk AML revealed no differential sensitivity to potent DNA damage inhibitors (Figure 4C). Not surprisingly, we found that TP53-altered specimens were more resistant to DNA-damaging agents, including drugs used in anticancer therapy (Figure 4D), and none of the DNA damage protein inhibitors were selectively active toward TP53-altered AML specimens. Interestingly, however, we observed that HMGA2+ CK specimens were more sensitive to ATR, CHK1, and WEE1 inhibitors. Conversely, compounds active on CHK2, DNA-PK, poly(ADP-ribose) polymerase, RPA, and PI3K showed no specificity toward HMGA2+ specimens (Figure 4E-F). It is worth noting that ATR and CHK1 kinases belong to the same DNA damage–signaling pathway, which is critical for DNA repair and G2/M checkpoint transition, and WEE1 acts downstream by regulating mitotic entry and integrating signals from the ATR/CHK1 checkpoint35 (supplemental Figure 3C). HMGA2high AML specimens expressed elevated levels of CHEK1 and WEE1, whereas ATM and CHEK2 expression levels were not affected by HMGA2 status (Figure 4G). Expression of the adaptors Claspin and TOPBP1 that facilitate CHK1 phosphorylation by ATR were also increased in HMGA2high samples without affecting ATR levels (supplemental Figure 3D). Together with the CRISPR/Cas9 screen results, our data suggest that the G2/M cell cycle transition, targeted genetically or pharmacologically, is a potential therapeutic target in HMGA2+ AML.
HMGA2 overexpression in cell lines modulates sensitivity to G2/M checkpoint inhibitors
Using lentiviral gene transfer, HMGA2 was overexpressed in several hematopoietic cell lines, including K562, OCI-AML5, and THP-1, to investigate whether manipulating HMGA2 levels can modulate sensitivity to G2/M checkpoint inhibitors. Of note, the impact of HMGA2 expression on proliferation and cell cycle profile was absent or very limited (Figure 5A-C; supplemental Figure 4A-C, 4E-G). We found that cell lines engineered to overexpress HMGA2 had a twofold to sevenfold increase in sensitivity to ATR and CHK1 inhibitors (Figure 5D-E; supplemental Figure 4D,H; supplemental Table 4). Importantly, results appeared p53 independent, as similar patterns were obtained using TP53 wild-type (OCI-AML5) and TP53-deficient (K562 and THP-1) cells. Overall, these results suggest that HMGA2 levels modulate sensitivity to G2/M checkpoint inhibitors.
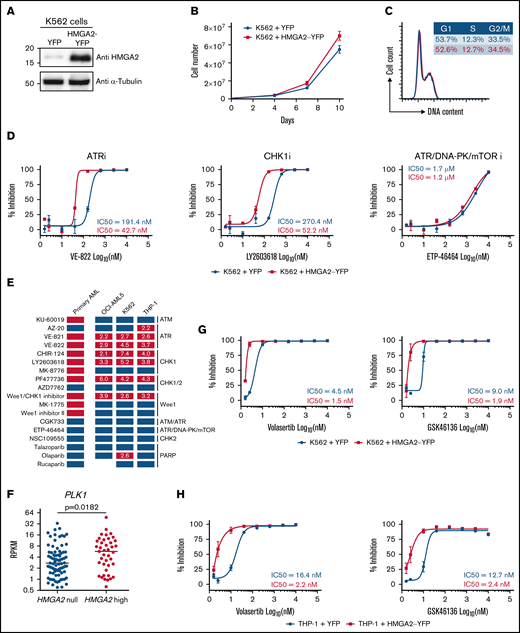
Induced HMGA2 expression sensitizes leukemic cells to ATR, CHK1, and PLK1 inhibitors . HMGA2 protein expression (A), proliferation curves (B), and cell cycle analysis (C) were performed in K562 cells infected with control YFP– or HMGA2-YFP–expressing vectors. (D) Dose-response curves and IC50 values for representative ATR, CHK1 and ATR/DNA-PK/mTOR inhibitors in K562 cells infected with vectors expressing control YFP (blue) or HMGA2-YFP (red). (E) Representation of overall chemical screen results in primary AML and cell lines (K562, OCI-AML5, and THP-1). Compounds with a significant increased activity in CK HMGA2+ vs CK HMGA2– primary AML (see Figure 4E) are depicted in orange while nonsignificant compounds are in blue. In cell lines, compounds with more than a twofold decrease in IC50 values in HMGA2-expressing cells vs control are in red; others are in blue. Fold change in IC50 values are indicated in corresponding boxes. (F) PLK1 messenger RNA expression in HMGA2 null (RPKM = 0; n = 83) and HMGA2 high (RPKM >2; n = 39) AML samples (median is depicted, Mann-Whitney U test). Dose-response curves and IC50 values for volasertib and GSK46136 PLK1 inhibitors in K562 (G) and THP-1 (H) cells infected with vectors expressing control YFP (blue) or HMGA2-YFP (red). mTOR, mammalian target of rapamycin; PARP, poly(ADP-ribose) polymerase.
Induced HMGA2 expression sensitizes leukemic cells to ATR, CHK1, and PLK1 inhibitors . HMGA2 protein expression (A), proliferation curves (B), and cell cycle analysis (C) were performed in K562 cells infected with control YFP– or HMGA2-YFP–expressing vectors. (D) Dose-response curves and IC50 values for representative ATR, CHK1 and ATR/DNA-PK/mTOR inhibitors in K562 cells infected with vectors expressing control YFP (blue) or HMGA2-YFP (red). (E) Representation of overall chemical screen results in primary AML and cell lines (K562, OCI-AML5, and THP-1). Compounds with a significant increased activity in CK HMGA2+ vs CK HMGA2– primary AML (see Figure 4E) are depicted in orange while nonsignificant compounds are in blue. In cell lines, compounds with more than a twofold decrease in IC50 values in HMGA2-expressing cells vs control are in red; others are in blue. Fold change in IC50 values are indicated in corresponding boxes. (F) PLK1 messenger RNA expression in HMGA2 null (RPKM = 0; n = 83) and HMGA2 high (RPKM >2; n = 39) AML samples (median is depicted, Mann-Whitney U test). Dose-response curves and IC50 values for volasertib and GSK46136 PLK1 inhibitors in K562 (G) and THP-1 (H) cells infected with vectors expressing control YFP (blue) or HMGA2-YFP (red). mTOR, mammalian target of rapamycin; PARP, poly(ADP-ribose) polymerase.
In addition, we observed that PLK1 expression is significantly higher (P = .018) in HMGA2high AML samples than in those that do not express this gene (Figure 5F). HMGA2 overexpression in 2 different cell lines also confers enhanced sensitivity to 2 potent polo-like kinase 1 (PLK1) inhibitors (threefold and sevenfold for volasertib and fourfold and fivefold for GSK46136) (Figure 5G-H). These data are interesting in the context that PLK1 is a key player in G2 phase and mitosis initiation36 and that CK AMLs, which frequently express HMGA2, are also sensitive to PLK1 inhibition.37 Together, these results are consistent with the hypothesis that HMGA2 expression sensitizes cells to molecules that target G2/M transition.
HMGA2high PDXs are sensitive to PLK1 inhibitors in vivo
To gain insights on the in vivo response of HMGA2high AML to PLK1 inhibition, we transplanted 2 PDX specimens in NSG mice and monitored response to AraC and to volasertib, a clinically available and potent PLK1 inhibitor. PDX 05H179 and 09H057 were derived from an EVI1 rearranged and a CK specimen, respectively, and both express high levels of HMGA2 (RPKM = 11.8 and 6). After confirmation of engraftment by PDX cells, animals were treated with AraC, volasertib, or control vehicle. For PDX 05H179 (Figure 6A-B), development of leukemia in mice was monitored by measurement of human CD45+ cells in BM at days 10 and 28 after the onset of treatment. Although leukemia engraftment progressed in vehicle- and AraC-treated mice, volasertib was able to contain leukemia development. For PDX 09H057 (Figure 6C-D), treatments were initiated early after transplantation and animals followed up for a long period of time to monitor the effectiveness of treatments at early stages and development of leukemia from therapy-resistant cells. At day 78 posttreatment initiation, this leukemia clearly progressed in the majority of control mice, reaching a median level of human CD45+ of >20% (Figure 6D). At this time point, both AraC and volasertib treatments were able to contain the disease in most animals. At 94 days’ posttreatment, however, disease progression was significant in the control and AraC treatment groups, whereas the percentage of leukemia engraftment remained <1% in most of the mice treated with volasertib. These data indicate that the 4 weeks of exposure to volasertib could contain leukemia cell expansion in the majority of the mice analyzed 10 weeks’ posttreatment.
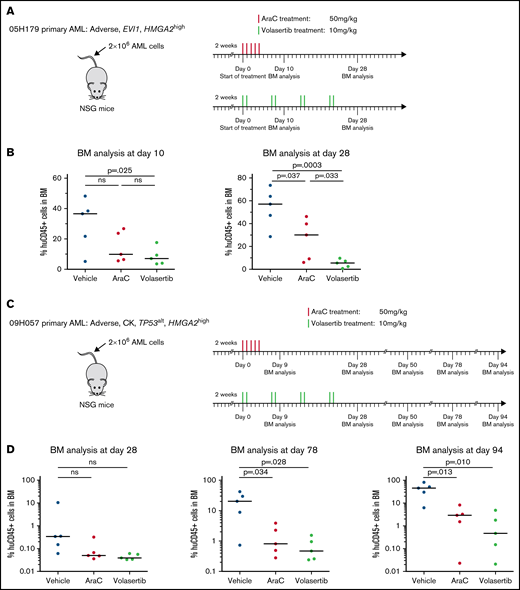
Poor prognosis HMGA2high PDXs are sensitive to PLK1 inhibitors in vivo. Summary of the treatment protocols and time point analysis for NSG mice transplanted with 2 million of 05H179 (A) or 09H057 (C) AML cells. Two weeks after transplantation, mice were treated with AraC (50 mg/kg, 5 days per week during 1 week), volasertib (10 mg/kg, 2 days per week during 4 weeks), or vehicle. BM aspiration was performed at indicated times. (B) Percentage of human CD45+ cells in BM at day 10 and 28 after AraC, volasertib, or vehicle treatment (n = 5, median is depicted; t test). (D) Percentage of human CD45+ (huCD45+) cells in BM at days 28, 78, and 94 after AraC, volasertib, or vehicle treatment (n = 5, median is depicted; t test). ns, not significant.
Poor prognosis HMGA2high PDXs are sensitive to PLK1 inhibitors in vivo. Summary of the treatment protocols and time point analysis for NSG mice transplanted with 2 million of 05H179 (A) or 09H057 (C) AML cells. Two weeks after transplantation, mice were treated with AraC (50 mg/kg, 5 days per week during 1 week), volasertib (10 mg/kg, 2 days per week during 4 weeks), or vehicle. BM aspiration was performed at indicated times. (B) Percentage of human CD45+ cells in BM at day 10 and 28 after AraC, volasertib, or vehicle treatment (n = 5, median is depicted; t test). (D) Percentage of human CD45+ (huCD45+) cells in BM at days 28, 78, and 94 after AraC, volasertib, or vehicle treatment (n = 5, median is depicted; t test). ns, not significant.
Discussion
In solid tumors, gene translocation, gene amplification, or 3′ UTR HMGA2 truncations have been reported to explain aberrant HMGA2 expression.5,25-28 In hematologic malignancies, however, only a few cases of chromosomal rearrangements at the HMGA2 locus have been reported,38-41 and none detected in our AML cohort. Rather, our data suggest that HMGA2 expression reflects a stem cell origin or a more immature state of these leukemias. Looking at single-cell analyses, we confirmed that HMGA2 expression in normal hematopoiesis is predominant in HSPCs, early progenitors, and the erythroid lineage.9,12,42 In AML, a similar pattern was observed with a marked expression of HMGA2 in the most immature cells while absent in differentiated cell clusters. As a result of this restricted expression, HMGA2 protein could not be detected at the protein level in bulk primary AML specimens.
Our group reported that HMGA2 is expressed in most CK AMLs; nevertheless, elevated HMGA2 expression can occur in a non-CK background.16 In addition, MDS-based gene expression clustering showed that HMGA2high specimens cluster together, independent of their karyotype or genetic group, and that HMGA2 is a prognostic marker independent of the cytogenetic risk. Altogether, these data suggest that the transcriptional regulator HMGA2 could have an important imprint in AML and define a distinct AML identity.
HMGA2 has become an attractive therapeutic target, but due to its nature, HMGA2 is not considered an easily druggable protein. Minor groove-binding agents such as netropsin and trabectedin displace HMGA2 from its target promoters and achieve antitumoral activity but lack specificity.43-45 Targeting microRNAs46 or downstream pathways activated by HMGA2 represent alternative approaches to be explored. Tan et al41 indeed reported that HMGA2 activates the PI3K/protein kinase B/mammalian target of rapamycin pathway in HL60 and NB4 cells and promotes AML proliferation. By conducting a whole-genome CRISPR/Cas9 screen in leukemic cells, we identified cell cycle regulation and DNA repair as synthetic lethal interactions with HMGA2 overexpression. These results highlighted a vulnerability of HMGA2 overexpressing cells toward cell cycle regulation. Accordingly, we found that the strongest gene expression signature associated with HMGA2 in AML is the upregulation of G2/M checkpoint genes. It has also been reported that HMGA2 interacts with the base excision repair machinery and protects cancer cells from DNA lesions induced by chemotherapeutic agents,32 and that HMGA2 expression increases ATR/CHK1 phosphorylation in cancer cell lines and helps maintain genome stability upon DNA damage.33 Interrogation of a DNA damage inhibitor library on primary AML specimens indeed confirmed an increased sensitivity of HMGA2+ AML to ATR, CHK1, and WEE1 inhibitors. These data suggest that HMGA2 expression, irrespective of the TP53 status, is of importance regarding the response to G2/M inhibitors in AML.
Together, our results showed that HMGA2 expression in AMLs associates with the most immature leukemic cells, a distinct transcriptional profile, and sensitivity to agents targeting G2/M transition. Because some of these agents have been or are currently under evaluation in clinical trials,47-50 our results suggest that these trials may benefit from targeted subgroup analyses and in particular patients with HMGA2+ AML. The recently developed and reliable clinical test for this gene would be useful in this context.16
Acknowledgments
The authors thank Mélanie Fréchette and Valérie Blouin-Chagnon for in vivo experimentations, Muriel Draoui for project coordination, Raphaëlle Lambert at the IRIC genomics platform for sequencing, and Jean Duchaine, Sébastien Guiral, Karine Audette, and Caroline Gauvin at the IRIC high-throughput screening platform for chemical screens. The collaboration of BCLQ (Quebec Leukemia Cell Bank) coinvestigators and the dedicated work of the BCLQ staff, namely Giovanni d’Angelo, Claude Rondeau, and Sylvie Lavallée, are also acknowledged. The authors also thank Charles-Le Moyne Hospital for providing human umbilical CB units.
This work was supported by the Government of Canada through Genome Canada and the Ministère de l’économie et de l’innovation du Québec through Génome Québec (grant 4524 and grant 13528). Support from the Leukemia Lymphoma Society and Canadian Cancer Society Research Institute to G.S. is also acknowledged. J.H. and G.S. hold a research chair from Industrielle-Alliance at Université de Montréal and a Bégin-Plouffe chair in blood stem cell chemogenomics of the Faculty of Medicine of Université de Montréal, respectively. BCLQ is supported by grants from the Cancer Research Network of the Fonds de recherche du Québec–Santé. RNA-sequencing read mapping and transcript quantification were performed on the supercomputer Briaree from Université de Montréal, managed by Calcul Québec and Compute Canada. The operation of this supercomputer is funded by the Canada Foundation for Innovation, NanoQuébec, RMGA, and the Fonds de recherche du Québec–Nature et technologies. C.M. is the recipient of a Canadian Institutes of Health Research fellowship (MFE-148251), and C.T. is supported by the Cole Foundation. V.-P.L. is the recipient of a Cole Foundation fellowship and a Vanier Canada Graduate Scholarship. J.-F.S. is supported by an IVADO (Institute for Data Valorization) and Canada First Research Excellence Fund (Apogée/CFREF) postdoctoral award and a Canadian Institutes of Health Research fellowship (MFE-158159).
Authorship
Contribution: C.M. contributed to project conception and single-cell data analysis, performed and analyzed CRISPR/Cas9 and chemical screens, generated corresponding material, and wrote the manuscript; J.-F.S. contributed to project conception, MDS, and CRISPR/Ca9 screen analyses; J.C. contributed to project conception, single-cell data analysis, and CRISPR/cas9 screen; V.-P.L. contributed to genomic and chemical screen analysis; B.L. contributed to single-cell data analysis; C.T. performed primary AML chemical screen; I.B. contributed to chemical screen and data validation; N.M. contributed to in vivo studies; T.M. contributed to CRISPR/Cas9 screen; A.M. is responsible for the chemistry team as part of the Leucegene project; J.H. selected and provided all primary AML samples and analyzed cytogenetic and clinical data; and G.S. contributed to project conception and supervision, and cowrote the paper.
Conflict-of-interest disclosure: The authors declare no competing financial interests.
Correspondence: Guy Sauvageau, Institute for Research in Immunology and Cancer (IRIC), PO Box 6128, Station Centre-Ville, Montreal, QC, Canada, H3C 3J7; e-mail: guy.sauvageau@umontreal.ca.

