

Key Points
APL cells in situ deposited fibrin(ogen) and activated platelets through membrane CD44.
Partial CD44 knockdown may alleviate APL bleeding complications.

Abstract
Early hemorrhagic death is still the main obstacle for the successful treatment of acute promyelocytic leukemia (APL). However, the mechanisms underlying hemostatic perturbations in APL have not been fully elucidated. Here, we report that CD44 on the membrane of APL blasts and NB4 cells ligated bound fibrinogen, resulting in in situ deposition of fibrin and abnormal fibrin distribution. Clots formed by leukemic cells in response to CD44 and fibrinogen interaction exhibited low permeability and resistance to fibrinolysis. Using flow cytometry and confocal microscopy, we found that CD44 was also involved in platelet and leukemic cell adhesion. CD44 bound activated platelets but not resting platelets through interaction with P-selectin. APL cell-coated fibrinogen-activated platelets directly induce enhanced procoagulant activity of platelets. In vivo studies revealed that CD44 knockdown shortened bleeding time, increased the level of fibrinogen, and elevated the number of platelets by approximately twofold in an APL mouse model. Moreover, CD44 expression on leukemic cells in an APL mouse model was not only associated with bleeding complications but was also related to the wound-healing process and the survival time of APL mice. Collectively, our results suggest that CD44 may be a potential intervention target for preventing bleeding complications in APL.
Introduction
Acute promyelocytic leukemia (APL) is characterized by the PML/RARA fusion gene, which is the result of t(15:17) translocation.1 Coagulopathy-induced hemorrhagic death is the main obstacle for complete remission, as up to 29% of early deaths are caused by hemorrhage in APL.2-4 However, anticoagulant or antifibrinolytic agents, as well as induction therapy, did not achieve the expected effect.5 Thus, other mechanisms underlying the hemostatic perturbations in APL remain unknown.
Fibrinogen is the main effector protein of the coagulation cascade, and its variation contributes to hemorrhage.6,7 Increased risk of hemorrhage in APL was associated with low fibrinogen levels during the all-trans retinoic acid (ATRA)/arsenic trioxide (ATO) eras.8-11 Other factors associated with fibrinogen consumption in APL are thus unclear. Our previous studies revealed that phosphatidylserine (PS) exposure on the membrane of APL cells induced in situ deposition of fibrin through its ligation with coagulation factors.12 Interestingly, we also observed that fibrinogen could spontaneously bind to the APL cell membrane. Fibrinogen mediates infection factors and tumor cell metastasis by serving as a ligand for various cell surface receptors.13,14 However, no APL-associated protein reportedly interacts with fibrinogen directly, and the signaling pathways involved in this process are also unknown.
CD44 is a transmembrane glycoprotein expressed in all AML blasts and stem cells.15 CD44 acts as a main receptor for fibrin/fibrinogen on the surface of solid tumor cells.16,17 However, the functional contributions of CD44 and fibrinogen interactions to the coagulation system in APL have not yet been elucidated. In addition, the molecules that participate in this process and the effect of their interaction on hemostatic disorders are poorly understood. CD44 is involved in various cell-signaling pathways that induce cell proliferation, survival, and cellular motility.18 A combination of ATRA and ATO is the new standard front-line therapy for patients with APL.19 However, the regulatory effect of this treatment on CD44 expression requires further investigation. Fibrin clots are crucial players in coagulation and wound healing. In situ thrombin generation and cell membrane fibrinogen receptors affect the structural characteristics of fibrin clots.20 Thus, we also explored whether these effects could regulate the structure of the fibrin clot formed by APL cells through CD44.
Here, we investigated the role of CD44 in APL cell surface fibrinogen localization in vitro and explored the association between this binding and hemorrhage in vivo. We also explored the effect of induction therapy medicine and daunorubicin (DNR) on the expression and function of CD44. This work reveals that the membrane protein CD44 contributes to hemorrhage through fibrinogen and activated platelet binding. However, PS exposure is still the main cause of in situ fibrin formation in apoptotic APL cells. Thus, our study provides new insight into understanding and treating hemorrhagic complications in APL.
Methods
Patients
Patients with APL (n = 28) and healthy volunteers (n = 25) were enrolled between September 2019 and July 2021. The diagnosis of APL was determined by the following examinations: cytogenetics, morphology, immunology, cytochemistry, and molecular pathology testing or alternative confirmation of the presence of the t(15; 17) (PML-RARA) fusion gene.21 This study was designed according to the Declaration of Helsinki and was approved by the Institutional Ethics Committee of Harbin Medical University. All patients provided informed consent. The clinical characteristics of the control subjects and patients are presented in Table 1.
Demographic and laboratory characteristics of 25 volunteer control subjects and 28 patients newly diagnosed with APL
| Characteristic | Control (n = 25) | Patients with APL (n = 28) |
|---|---|---|
| Age, y | 58 (28-78) | 42 (18-66) |
| Sex (female/male) | 10/15 | 11/17 |
| BMI, kg/m2 | 22.63 (22.4-25.81) | 23.75 (22.1-25.83) |
| WBC count, ×109/L | 5.95 (4.73-7.91) | 6.18 (0.96-19.04)* |
| <4 × 10⁹/L | – | 9 (32%) |
| 4-10 × 109/L | – | 16 (57%) |
| >4 × 10⁹/L | – | 3 (11%) |
| PLT count, ×109/L | 242.51 (196.4-273.81) | 173.31 (20.67-345.9)* |
| Hemoglobin, g/L | 133.21 (115.23-157.14) | 126.11 (63.13-170) |
| Blast, BM% | – | 48.32 (10.02-91.24) |
| PT, s | 12.67 (11.5-14.2) | 12.05 (10.5-17.3)* |
| APTT, s | 28 (25-35.6) | 25.83 (19.8-33.4) |
| PTINR | 1.01 (0.85-1.21) | 1.09 (0.95-1.59) |
| Fibrinogen, g/L | 3 (2.5-3.8) | 2.1 (0.41-3.61)* |
| d-dimer, mg/L | 0.23 (0.15-0.32) | 3.25 (0.12-21.82)* |
| Physical signs of bleeding (yes/no)† | – | 10/18 |
Data are presented as n (%) or median values (25th and 75th percentiles).
APTT, activated partial thromboplastin time (normal range: 20-40 seconds); Blasts, promyelocytes + blasts; BMI, body mass index (normal range: 18.5-25 kg/m2); PLT, platelet; PT, prothrombin time (normal range: 10-15 seconds); WBC, white blood cell.
P < .05 vs the healthy control subjects.
Physical signs of bleeding include mucosal bleeding, hematuria, petechiae, spontaneous ecchymoses, melena, menorrhagia, and hematemesis.
Reagents and antibodies
The NB4 cell line was obtained from Meisen (Zhejiang, People’s Republic of China). Fetal bovine serum and RPMI 1640 medium were purchased from HyClone (Logan, UT). Hyaluronan and human fibrinogen were obtained from Suolaibao (Beijing, People’s Republic of China). Anti–phosphatidylinositol 3-kinase (PI3K) antibodies and anti–protein kinase B (Akt) antibodies were purchased from Wanleibio (Shanghai, People’s Republic of China). Anti-mTor, anti–P-mTor, and anti-CD44 antibodies were purchased from Proteintech (Hubei, People’s Republic of China). Human thrombin was obtained from Enzyme Research Laboratories (South Bend, IN). The human CD44 enzyme-linked immunosorbent assay (ELISA) kit was obtained from Abcam (Stamford, CT). ATRA, ATO, and DNR were purchased from Sigma (St. Louis, MO). Polyvinylidene difluoride membranes, anti-mouse antibodies, and anti-rabbit antibodies were obtained from Beyotime (Shanghai, People’s Republic of China). We prepared Alexa Fluor-488– or Alexa Fluor-647–conjugated lactadherin. Anti-CD41a and anti–P-selectin antibodies were purchased from Abcam.
Cell culture
Fresh APL blasts were isolated from bone marrow (BM) specimens through Ficoll-Hypaque density gradient centrifugation. The isolated cells (5 × 10⁵ cells/mL) were maintained in complete RPMI 1640 medium (20% fetal bovine serum, 1% penicillin-streptomycin solution, and 2 mM l-glutamine) at 37°C in a 5% carbon dioxide humidified atmosphere. NB4 cells were maintained under the same conditions. Cells between passages 2 and 4 were prepared for the experiments.
Flow cytometry analyses for leukemic cell–platelet complexes
Citrated peripheral blood from patients or healthy volunteers who provided informed consent was used to obtain platelet-rich plasma by centrifugation at 37°C and 250g for 13 minutes. A total of 1 × 10⁶ APL cells/NB4 cells (500 μL) were incubated with 500 μL of platelet-rich plasma for 45 minutes at room temperature with rotation. PBST (phosphate-buffered saline + 0.1% Tween 20) + 3% fetal bovine serum was used to block the complexes for 30 minutes. The incubated samples were then washed with phosphate-buffered saline (PBS) at 800g for 4 minutes. Finally, anti-CD41a and anti-myeloperoxidase were used for staining in the following experiments. Data analysis was performed with FlowJo version 10 (FlowJo LLC, Ashland, OR).
Confocal microscopy
Coverslips were coated with fibronectin overnight at 4°C. APL/NB4 cells were seeded onto fibronectin-coated plates, incubated with fibrinogen for 24 hours, fixed in 4% paraformaldehyde for 15 minutes, and blocked with PBS containing 1% bovine serum albumin. Thereafter, the cells were stained with primary anti-CD44 antibody, anti-fibrinogen antibody-conjugated secondary Alexa Fluor-488 anti-mouse and Alexa Fluor-555 anti-rabbit antibodies, and 4′,6-diamidino-2-phenylindole. In the apoptosis assays, the slides were incubated with lactadherin-Alexa Fluor-488 and propidium iodide before fixation. Images were obtained with a Zeiss LSM confocal microscope (Carl Zeiss Microscopy GmbH, Jena, Germany). Quantification was performed by using ImageJ software (National Institutes of Health, Bethesda, MD).
Clot formation and lysis assays
Venous blood was drawn by using antecubital venipuncture with a 21-gauge butterfly needle in a Vacuette tube coated with 3.2% sodium citrate (Greiner Bio-One). Platelet-poor plasma (PPP) was obtained by gradient centrifugation (200g for 15 minutes, 1500g for 20 minutes). Clotting and fibrinolysis were performed as previously described.22,23 PPP was mixed with leukemic cells and incubated with CaCl2 (25 mM) and thrombin to initiate clotting with/without tissue-type plasminogen activator (0.5 μg/mL). The final reaction volume was 100 μL in a 96-well plate. Clot formation was monitored by turbidity at 405 nm at room temperature for 2 hours (Infinite Pro 20 plate reader; Tecan Group Ltd., Männedorf, Switzerland). The time to peak was defined as the time to obtain the turbidity plateau. Lysis time was the gap between time to peak and the curve back to the baseline. Anti-CD44 antibodies were used to perform an inhibition assay.
Clot permeability assay
CaCl2 (25 mM) and thrombin (1 U/mL) were added to a mixture of 104 leukemic cells, and PPP was obtained as previously described. A clot was generated in a plastic pipette tip connected to a reservoir of Tris-buffered saline (TBS). The mixture was consolidated at room temperature for 2 hours. The volume of TBS flowing from the clot was measured within 45 minutes. The permeability coefficient was calculated according to the equation Ks = (Q × L × η)/(T × A × P), where Q is the flow rate, L is the length of a fibrin gel, η is the viscosity of liquid (in poise), T is the percolating time, A is the cross-sectional area (in cm2), and P is the differential pressure (in dyne/cm2).
Intrinsic/extrinsic Factor Xa and thrombin generation assay
For intrinsic factor Xa (FXa) formation, 104 leukemic cells treated with DNR and ATO were cultured with 130 nM FX, 1 nM FIXa, 5 nM FVIII, 0.2 nM thrombin, and 5 mM CaCl2 in FXa buffer (1 × TBS with 0.2% bovine serum albumin) for 5 minutes at room temperature. EDTA (7 mM) was then added to the complex for termination. The final reaction volume was 100 μL in a 96-well plate. The generation of FXa was shown by the chromogenic substrate S2765 with an Infinite Pro 20 plate reader at 405 nm. The measurement of extrinsic FXa was similar to that of intrinsic FXa, except that the leukemic cell complex was mixed with 130 nM FX, 1 nM FVIIa, and 5 mM CaCl2. For the thrombin formation assay, leukemic cells were cultured with 1 mM prothrombin, 1 nM FVa, 0.05 nM FXa, and 5 mM CaCl2 in IIa buffer (1 ×TBS with 0.05% bovine serum albumin) for 5 minutes at room temperature. EDTA was used to stop the reaction, and the chromogenic substrate S2238 was used for measurement.
Western blotting
Western blotting assays were performed as previously described.24 We incubated membranes with transferred protein overnight with the following antibodies: anti-CD44 (1:1000), anti-Akt (1:1000), anti-PI3K (1:1000), anti–P-Akt (1:1000), anti-mTor (1:4000), and anti–P-mTor (1:2000). β-actin was used as an internal control.
Scanning electron microscopy
Scanning electron microscopy was performed on an S-3400N electron microscope (Hitachi, Ltd., Tokyo, Japan) in ultra-high-resolution mode. Neutrophils, NB4, and APL were seeded on polylysine-coated coverslips. Next, 100 µL of PPP was added to each well with CaCl2 (25 mmol/L) for 5 minutes. We then washed the samples 3 times with PBS and fixed them with glutaraldehyde at 4°C overnight. The samples were rinsed with Na-cacodylate HCl buffer of 0.1 M and postfixed by 1% OsO4. The samples were then dehydrated in the following graded ethanol series: 30%, 50%, 70%, 90%, and 100% two times in 5 minutes. Finally, the samples were coated in gold (10 nm thick) before imaging.
Establishment of the APL mouse model
An in vivo xenograft model was established as previously described.24 Male/female SCID mice, 6 to 8 weeks of age, were intravenously injected with 5 × 10⁶ NB4 cells to obtain APL mouse models. Three to four weeks later, NB4 cells were detected in the peripheral blood by Giemsa staining. We then observed the appearance of typical symptoms: depression, wrinkled fur, arch position, decreased activity, gait instability, loss of appetite, cornering or circling, multiple lymphadenopathies, weight loss, and limb paralysis. The spleen, liver, and lungs of the mice were also infiltrated with leukemic cells. For secondary transplantation, diseased mice were immersed in 75% ethanol for 3 to 5 minutes. The femur and tibia were removed on an ultraclean table. The BM was then resuspended in RPMI 1640 solution. After the erythrocytes were lysed, 5 × 10⁶ (300 μL total volume) BM cells were transplanted into a new batch of 5- to 7-week-old mice. These new models were blindly divided into 7 groups for the following experiments.
Bleeding time
The tail of the mice was cut off at 3 mm from the tip after anesthetization. A timer was then used to measure the bleeding time. Blood samples were collected for soluble CD44 examination using a commercial ELISA (Solarbio, Beijing, People’s Republic of China). The concentrations of fibrinogen and d-dimer were measured by using a mouse fibrinogen detection ELISA Kit (Abcam) and mouse d-dimer detection ELISA Kit (Elabscience, Wuhan, People’s Republic of China).
Data analysis
Results are reported as the mean ± standard deviation. Group comparisons were determined by a t test and one-way analysis of variance as appropriate. Correlation assays were performed by using the Pearson correlation coefficient. P < .05 was considered significant, and all analyses were performed by using SPSS 20.0 (IBM SPSS Statistics; IBM Corporation, Armonk, NY).
Results
CD44 on the surface of NB4/APL cells interacts with fibrinogen
To explore whether NB4/APL cells bind fibrin spontaneously, we incubated NB4/APL cells and neutrophils with fibrinogen and thrombin for 1 hour. In the scanning electron microscopy images, narrow and thick fibrin fibers were observed surrounding NB4/APL cells. In contrast, very few fibrin networks were found around neutrophils (Figure 1A). CD44 on the surface of tumor cells has been reported to be ligated with fibrinogen.16,17 Thus, we next assessed whether CD44 expression by NB4/APL cells binds fibrinogen to mediate the interaction between leukemic cells and fibrin fibers.
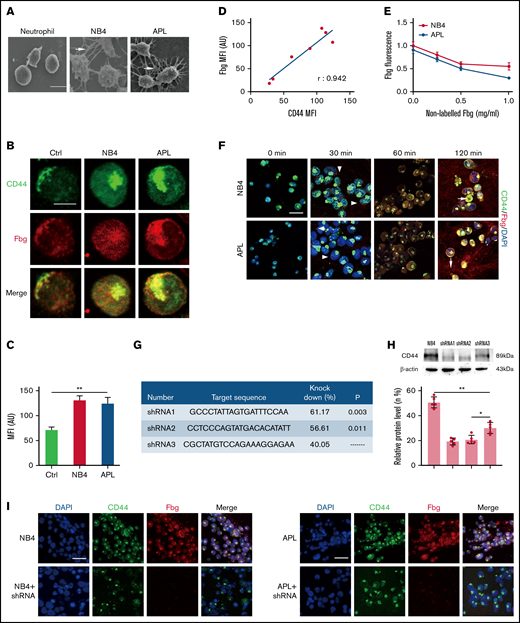
CD44 from NB4 and APL cells ligates with fibrinogen (Fbg). (A) Leukemia cells and neutrophils were mixed with Fbg (1 mg/mL) and thrombin (1 U/mL) for 2 hours. Dense fibrin networks formed among NB4 and APL cells (arrows). Almost no fibrin was located on the membrane of neutrophils. Scale bar, 10 µm. (B) Representative immunofluorescence images from direct staining of CD44 (green) and Fbg (red). Scale bar, 10 µm. (C) The MFI of Fbg in panel B. (D) The MFI of Fbg deposited on the membrane of NB4/APL cells was correlated with the MFI of CD44. (E) Competition assays. A nonlabeled Fbg was added to the mixture at different concentrations. The fluorescence of Fbg was detected by using flow cytometry. (F) APL/NB4 cells were incubated with Fbg, and images were obtained at the indicated time points. Fbg deposited on the surface of leukemic cells (arrowheads). Thrombin was added 60 minutes after leukemic cells were mixed with Fbg, and the mixture was treated as described in “Methods.” Leukemia cells were wrapped by fibrin networks (arrows). Scale bar, 10 µm. (G-H) The target sequence and the percent knockdown are shown as follows. The expression of CD44 was measured by western blotting, and the mean gray value was measured by using ImageJ. (I) NB4 cells/APL blasts with/without CD44 knockdown were cultured with Fbg for 1 hour. Fluorescence images showed decreased Fbg deposition on the CD44 knockdown cells. Scale bar, 20 µm. *P < .05, **P < .01. AU, arbitrary units; Ctrl, control; DAPI, 4′,6-diamidino-2-phenylindole.
CD44 from NB4 and APL cells ligates with fibrinogen (Fbg). (A) Leukemia cells and neutrophils were mixed with Fbg (1 mg/mL) and thrombin (1 U/mL) for 2 hours. Dense fibrin networks formed among NB4 and APL cells (arrows). Almost no fibrin was located on the membrane of neutrophils. Scale bar, 10 µm. (B) Representative immunofluorescence images from direct staining of CD44 (green) and Fbg (red). Scale bar, 10 µm. (C) The MFI of Fbg in panel B. (D) The MFI of Fbg deposited on the membrane of NB4/APL cells was correlated with the MFI of CD44. (E) Competition assays. A nonlabeled Fbg was added to the mixture at different concentrations. The fluorescence of Fbg was detected by using flow cytometry. (F) APL/NB4 cells were incubated with Fbg, and images were obtained at the indicated time points. Fbg deposited on the surface of leukemic cells (arrowheads). Thrombin was added 60 minutes after leukemic cells were mixed with Fbg, and the mixture was treated as described in “Methods.” Leukemia cells were wrapped by fibrin networks (arrows). Scale bar, 10 µm. (G-H) The target sequence and the percent knockdown are shown as follows. The expression of CD44 was measured by western blotting, and the mean gray value was measured by using ImageJ. (I) NB4 cells/APL blasts with/without CD44 knockdown were cultured with Fbg for 1 hour. Fluorescence images showed decreased Fbg deposition on the CD44 knockdown cells. Scale bar, 20 µm. *P < .05, **P < .01. AU, arbitrary units; Ctrl, control; DAPI, 4′,6-diamidino-2-phenylindole.
We first incubated leukemic cells with fibrinogen for 1 hour, and confocal microscopy showed that fibrinogen colocalized with CD44 on the surface of NB4/APL cells. The expression of CD44 in leukemic cells was higher than that in neutrophils (Figure 1B-C). The mean fluorescence intensity (MFI) of fibrinogen was positively correlated with the MFI of CD44 (Figure 1D). To further corroborate our fluorescence experiments, we performed a competition assay. With increasing nonlabeled fibrinogen levels, the absorbance of fibrinogen on NB4 and APL cells decreased by 45% and 66.67%, respectively. No significant difference in fibrinogen binding was detected between the NB4 and APL groups (Figure 1E). We then incubated NB4/APL cells with Alexa Fluor-555–conjugated fibrinogen. Fibrinogen showed dot deposition on the surface of leukemic cells, and fibrinogen was then spread over the entire membrane. Moreover, after fibrinogen turned to fibrin, leukemic cells were wrapped by fibrin fibers (Figure 1F). Finally, we constructed lenti–short hairpin RNA (shRNA) to decrease the expression of CD44. The knockdown percentage of three shRNAs was compared, and shRNA1 was selected for the following experiments (Figure 1G-H). The regression of CD44 expression on the membrane of leukemic cells decreased fibrinogen deposition (Figure 1I). In addition, NB4/APL cells treated with shRNA1 displayed thin and sparse surrounding fibrin fibers (Figure 2A). Together, these data identify CD44 as a key mediator of leukemic cells and fibrin/fibrinogen binding.
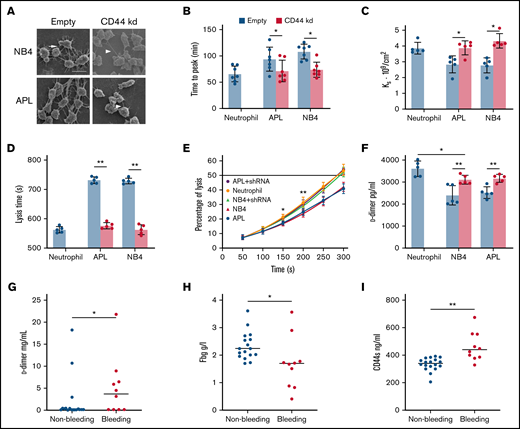
The effect of CD44 from APL cells on fibrin clot structure and properties. (A) APL/NB4 cells treated with empty vector and CD44 knockdown (kd) shRNA were incubated with fibrinogen (Fbg) and thrombin, leukemic cells were surrounded by thick fibrin networks (arrow), and CD44 kd cells exhibited thin fibers (arrowheads). Scale bar, 10 µm. (B) Clotting was induced by incubating leukemic cells with PPP. The time to the plateau of the clot was monitored according to turbidity. (C) The permeability of these clots was measured as described in “Methods.” (D-E) Clot lysis assays were performed in the presence of 1 nM tissue-type plasminogen activator. The time was recorded according to clot turbidity at 405 nm. (F) Five minutes after the clot assays began, the level of d-dimer was measured. (G-I) The levels of d-dimer, Fbg, and soluble CD44 (CD44s) in patient plasma were measured. *P < 0.05, **P <0 .01. Each image in panel A was from at least 3 experiments. *P < .05 vs previous data in the APL group, **P < .01 vs previous data in the NB4 group in panel E. Each value was from at least 5 experiments and is shown as the mean ± standard deviation.
The effect of CD44 from APL cells on fibrin clot structure and properties. (A) APL/NB4 cells treated with empty vector and CD44 knockdown (kd) shRNA were incubated with fibrinogen (Fbg) and thrombin, leukemic cells were surrounded by thick fibrin networks (arrow), and CD44 kd cells exhibited thin fibers (arrowheads). Scale bar, 10 µm. (B) Clotting was induced by incubating leukemic cells with PPP. The time to the plateau of the clot was monitored according to turbidity. (C) The permeability of these clots was measured as described in “Methods.” (D-E) Clot lysis assays were performed in the presence of 1 nM tissue-type plasminogen activator. The time was recorded according to clot turbidity at 405 nm. (F) Five minutes after the clot assays began, the level of d-dimer was measured. (G-I) The levels of d-dimer, Fbg, and soluble CD44 (CD44s) in patient plasma were measured. *P < 0.05, **P <0 .01. Each image in panel A was from at least 3 experiments. *P < .05 vs previous data in the APL group, **P < .01 vs previous data in the NB4 group in panel E. Each value was from at least 5 experiments and is shown as the mean ± standard deviation.
CD44–fibrinogen binding influences the fibrin clot structures formed by leukemic cells
We next assessed whether the CD44–fibrinogen interaction affects the structure and function of fibrin clots. NB4/APL cells were incubated with PPP to form the clot. Leukemic cells with CD44 expression required more time for fibrin formation compared with those decreased CD44 expression groups (Figure 2B). Our analysis showed significantly decreased permeability of the clots from the NB4 and APL cell groups (Figure 2C). We then added fibrinogen additionally; with the increase of fibrinogen concentration, the Ks of clots gradually decreased (Table 2). The regression of CD44 increased the permeability of the 2 groups. However, in the absence of CD44, there were 21% and 23% decreases in the time required to reach 100% lysis in the NB4 and APL groups, respectively (Figure 2D). Clots formed by leukemic cells in the presence of CD44 expression showed a delay in lysis compared with clots formed in the absence of CD44 (Figure 2E-F). We then measured the concentrations of d-dimer, fibrinogen, and soluble CD44 in the plasma of bleeding and nonbleeding patients. The level of soluble CD44 in the bleeding group was 38% higher than that in the nonbleeding group (Figure 2G-I). Using Pearson correlation analysis, the content of d-dimer was shown to be negatively correlated with soluble CD44 concentrations. The level of fibrinogen exhibited a positive correlation (supplemental Figure 2). Thus, binding of CD44 to fibrinogen on the leukemic cell surface produces clots that are less permeable and more resistant to lysis. In addition, CD44–fibrinogen binding may be associated with abnormal fibrinolysis in vivo.
Ks of fibrin clot with additional fibrinogen
| Fibrinogen level (mg/mL) | |||||
|---|---|---|---|---|---|
| 0 | 1 | 1.5 | 2 | 2.5 | |
| NB4 (109/cm2) | 2.83 ± 0.54 | 2.46 ± 0.20 | 2.18 ± 0.21* | 1.92 ± 0.18* | 1.74 ± 0.21* |
| APL (109/cm2) | 2.78 ± 0.48 | 2.54 ± 0.16 | 2.27 ± 0.11† | 1.90 ± 0.22† | 1.80 ± 0.20† |
| Fibrinogen level (mg/mL) | |||||
|---|---|---|---|---|---|
| 0 | 1 | 1.5 | 2 | 2.5 | |
| NB4 (109/cm2) | 2.83 ± 0.54 | 2.46 ± 0.20 | 2.18 ± 0.21* | 1.92 ± 0.18* | 1.74 ± 0.21* |
| APL (109/cm2) | 2.78 ± 0.48 | 2.54 ± 0.16 | 2.27 ± 0.11† | 1.90 ± 0.22† | 1.80 ± 0.20† |
P < .05 vs the data of NB4 cells with no additional fibrinogen.
P < .05 vs the data in APL groups at no fibrinogen addition.
Leukemic cell–CD44 also results in the deposition of activated platelets
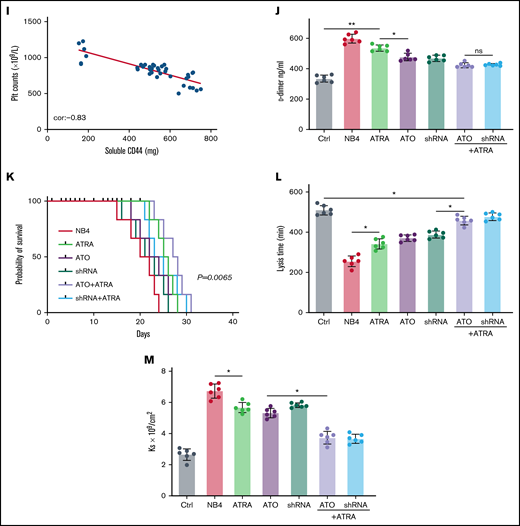
Platelets are essential for the pathogenesis of hemorrhage in APL.25 P-selectin, expressed on the surface of activated platelets, is commonly ligated with CD44. Thus, we incubated NB4 cells with resting and activated platelets to identify whether NB4 cell-CD44 could result in platelet deposition. As illustrated by flow cytometry, NB4 leukemic cells were specifically attached to activated platelets. Anti–P-selectin antibody and CD44 regression decreased the percentage of the leukemic cell–platelet complex from 4.99 ± 0.72% to 2.28 ± 0.23% and 2.39 ± 0.3%, respectively, in the NB4 group and from 4.92 ± 0.59% to 2.34 ± 0.41% and 2.16 ± 0.26% in the APL groups (Figure 3A-B). As expected, treatment with anti–P-selectin and CD44 knockdown shRNA inhibited the binding of activated platelets to NB4 leukemia cells (Figure 3C). Therefore, CD44 partly contributed to the binding of leukemic cells with activated platelets. However, when we mixed fibrinogen-coated leukemic cells with the resting platelets, the formation of FXa was significantly elevated (Figure 3D). The size of the FXa enhancement correlated with the concentration of APL cells (Figure 3E). We then found that platelets treated with fibrinogen and fibrinogen-coated leukemic cells displayed more PS exposure, which is a marker of platelet activation (Figure 3F-G). These results indicate that leukemic cells increase the procoagulant activity of platelets through in situ fibrinogen deposition.
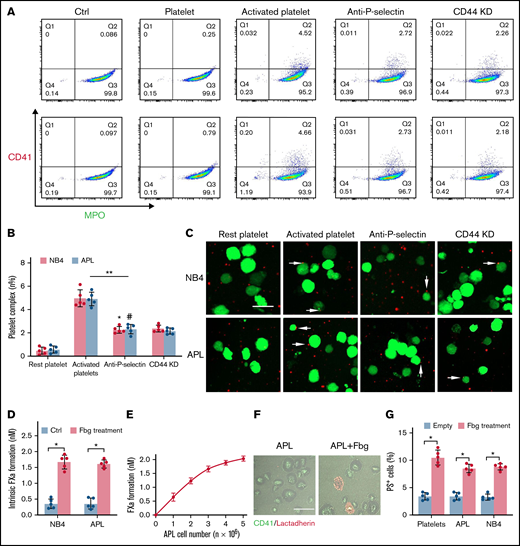
APL cells bind activated platelets through CD44. (A) Representative examples of leukemic cells (NB4 cells, upper; APL cells, the next row) interacting with resting/activated platelets. Activated platelet-bound cells were assessed by myeloperoxidase (MPO) (leukemic cells) and CD62P (activated platelets) staining. (B) The number of leukemia cell–platelet complexes from the data in panel A. (C) NB4 and APL cells (green) were mixed with resting and activated platelets (red) with/without anti–P-selectin antibody or CD44 knockdown (CD44 KD), respectively. The overlap indicates leukemic cell adherence to platelets (arrowheads). Scale bar, 20 µm. (D) A total of 1 × 10⁴ leukemic cells, with or without surrounding fibrinogen (Fbg), were mixed with isolated platelets (2 × 10⁶) for 45 minutes. The formation of FXa was measured as described in “Methods.” (E) APL cells coated with Fbg at various concentrations were mixed with isolated platelets, and the formation of FXa was measured. (F) Representative images of platelets with Fbg treatment. PS exposure was shown by lactadherin staining. Scale bar, 10 µm. (G) Platelets were treated with Fbg or Fbg-coated APL/NB4 cells, and PS exposure was measured by using flow cytometry. **P < .01, *P < .05, #P < .05 vs the data in the remaining platelet group in panel B. *P < .05 in panels D and G. Ctrl, control.
APL cells bind activated platelets through CD44. (A) Representative examples of leukemic cells (NB4 cells, upper; APL cells, the next row) interacting with resting/activated platelets. Activated platelet-bound cells were assessed by myeloperoxidase (MPO) (leukemic cells) and CD62P (activated platelets) staining. (B) The number of leukemia cell–platelet complexes from the data in panel A. (C) NB4 and APL cells (green) were mixed with resting and activated platelets (red) with/without anti–P-selectin antibody or CD44 knockdown (CD44 KD), respectively. The overlap indicates leukemic cell adherence to platelets (arrowheads). Scale bar, 20 µm. (D) A total of 1 × 10⁴ leukemic cells, with or without surrounding fibrinogen (Fbg), were mixed with isolated platelets (2 × 10⁶) for 45 minutes. The formation of FXa was measured as described in “Methods.” (E) APL cells coated with Fbg at various concentrations were mixed with isolated platelets, and the formation of FXa was measured. (F) Representative images of platelets with Fbg treatment. PS exposure was shown by lactadherin staining. Scale bar, 10 µm. (G) Platelets were treated with Fbg or Fbg-coated APL/NB4 cells, and PS exposure was measured by using flow cytometry. **P < .01, *P < .05, #P < .05 vs the data in the remaining platelet group in panel B. *P < .05 in panels D and G. Ctrl, control.
Expression of CD44 in NB4/APL cells is regulated by PI3K/Akt signaling
To determine the regulatory mechanisms for CD44 expression, BKM was used to interfere with the expression of PI3K.26 APL/NB4 cells were treated with BKM, and the cell viability was measured (supplemental Figure 3). To exclude the effect of apoptosis, APL/NB4 cells treated by BKM (1 μm) for 24 hours were used in following experiments. When the expression of PI3K and its downstream proteins was reduced, the expression level of CD44 was also decreased (Figure 4A-B; supplemental Figure 4). Decreased expression of CD44 significantly reduced fibrinogen localization while elevating the permeability of clots formed by leukemic cells (Figure 4C-D). The decrease of CD44 expression shortened the time for fibrin formation (supplemental Figure 5). The clots showed less resistance to fibrinolysis in the presence of BKM (Figure 4E). NB4/APL cells previously treated with BKM were then incubated with activated platelet complexes. We found that the interaction between leukemic cells and activated platelets was also inhibited (Figure 4F-G). Taken together, these results suggest that the PI3K/Akt pathway regulates the expression and function of CD44 (Figure 4H).
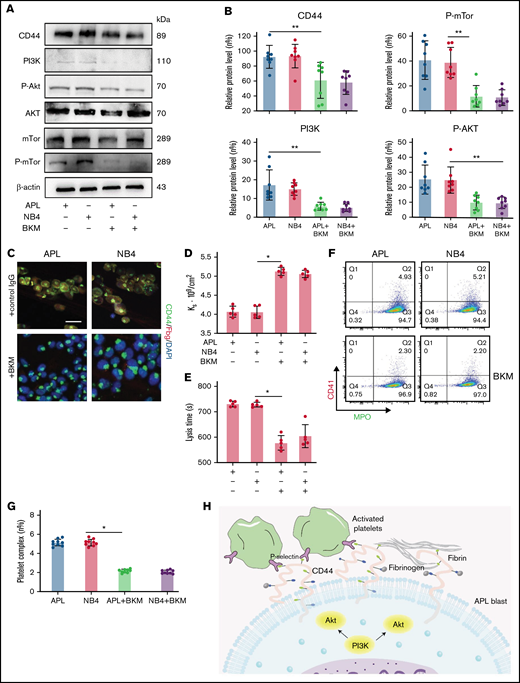
CD44 expression is regulated by the PI3K/Akt/mTOR pathway in APL cells. (A-B) Protein levels of CD44 and PI3K/Akt/mTor signals in APL and NB4 cells treated with/without the PI3K inhibitor BKM. The mean gray value was measured by using ImageJ. (C) Representative immunofluorescence images showing the presence of BKM. Scale bar, 10 µm. (D) Ks of the clot was measured as previously described. (E) Clot lysis assays were performed as previously described. (F-G) Leukemia cells with/without previous treatment with BKM were mixed with activated platelets. Leukemic cell–platelet complexes were detected by using flow cytometry. (H) The schema image of leukemic cells binding platelets and the signaling regulating CD44 expression in APL cells. *P < .05, **P < .01. Each data set is from at least 5 experiments. IgG, immunoglobulin G; MPO, myeloperoxidase.
CD44 expression is regulated by the PI3K/Akt/mTOR pathway in APL cells. (A-B) Protein levels of CD44 and PI3K/Akt/mTor signals in APL and NB4 cells treated with/without the PI3K inhibitor BKM. The mean gray value was measured by using ImageJ. (C) Representative immunofluorescence images showing the presence of BKM. Scale bar, 10 µm. (D) Ks of the clot was measured as previously described. (E) Clot lysis assays were performed as previously described. (F-G) Leukemia cells with/without previous treatment with BKM were mixed with activated platelets. Leukemic cell–platelet complexes were detected by using flow cytometry. (H) The schema image of leukemic cells binding platelets and the signaling regulating CD44 expression in APL cells. *P < .05, **P < .01. Each data set is from at least 5 experiments. IgG, immunoglobulin G; MPO, myeloperoxidase.
ATO and cytotoxic drugs decrease the in situ deposition of fibrin by influencing CD44 expression
To identify the effect of induction therapy and chemical therapy on CD44–fibrinogen binding, we incubated APL and NB4 cells with ATRA and ATO for 24 hours, and with DNR for 12 hours. Compared with the empty and ATRA groups, the ATO and DNR groups displayed reduced deposition of fibrinogen on the surface of leukemic cells (Figure 5A-B). We then found that the expression of CD44 was decreased by ATO and DNR but not ATRA (Figure 5C). Next, we determined whether ATO and DNR regulated CD44 generation through the PI3K/Akt pathway. After the treatment above (as described in Figure 5A), the PI3K, P-Akt, and P-mTor concentrations were apparently reduced in the ATO and DNR groups compared with the ATRA and empty groups (Figure 5D-E). To further characterize the target sites of ATO and DNR in PI3K/Akt signaling, NB4 leukemia cells were pretreated with 740-YP for 30 minutes, and the cells were then cultured with ATO and DNR. Elevated concentrations of P-Akt were observed and were comparable to those in primary NB4 cells with no stimulation (supplemental Figure 6). In addition, increased levels of CD44 expression were found (Figure 5F). Therefore, ATO and DNR regulate the expression and function of CD44 by PI3K/Akt signaling.
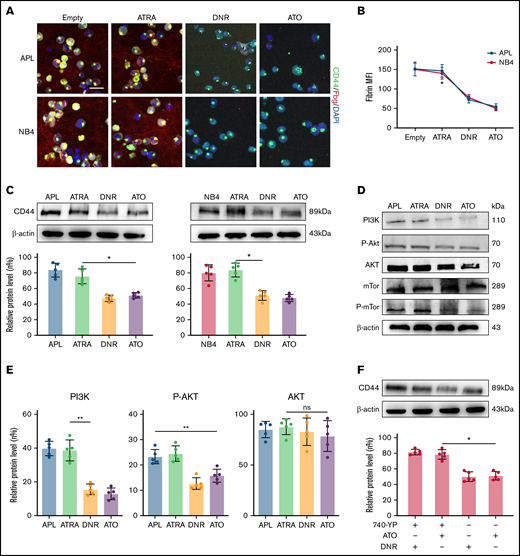
The effect of chemotherapy drugs on the expression and function of CD44. (A) Leukemia cells treated as described above were incubated with fibrinogen (Fbg) for 2 hours. Fluorescence images were observed by using confocal microscopy. Each image is from at least 3 experiments. Scale bar, 20 µm. (B) The MFI of Fbg on the surface of leukemic cells was measured by using ImageJ. (C) Western blotting was used to measure CD44 protein expression levels. The fold change was calculated by using ImageJ and compared with the data in the APL/NB4-only group. (D-E) APL/NB4 cells were treated as previously described, and the expression level of the PI3K pathway was studied. The data in the APL-only group were regarded as the baseline. (F) The expression of CD44 in the presence of ATO with/without the PI3K agonist 740-YP (20 µM/L). *P < .05, **P < .01 in panels C, E, and F. *P < .05 vs the empty group in panel B. DAPI, 4′,6-diamidino-2-phenylindole; ns, not significant.
The effect of chemotherapy drugs on the expression and function of CD44. (A) Leukemia cells treated as described above were incubated with fibrinogen (Fbg) for 2 hours. Fluorescence images were observed by using confocal microscopy. Each image is from at least 3 experiments. Scale bar, 20 µm. (B) The MFI of Fbg on the surface of leukemic cells was measured by using ImageJ. (C) Western blotting was used to measure CD44 protein expression levels. The fold change was calculated by using ImageJ and compared with the data in the APL/NB4-only group. (D-E) APL/NB4 cells were treated as previously described, and the expression level of the PI3K pathway was studied. The data in the APL-only group were regarded as the baseline. (F) The expression of CD44 in the presence of ATO with/without the PI3K agonist 740-YP (20 µM/L). *P < .05, **P < .01 in panels C, E, and F. *P < .05 vs the empty group in panel B. DAPI, 4′,6-diamidino-2-phenylindole; ns, not significant.
Interaction between fibrinogen and CD44 in leukemic cells disrupts hemostasis in vivo
We next tested our hypothesis that CD44 expression on APL blasts exacerbates fibrinogen consumption and bleeding in vivo. NB4 cells/NB4 cells transfected with shRNA were used to establish the APL mouse model (Figure 6A). On days 21 to 28, the expression of PML-RARA was detected in the model, including in the liver, spleen, lung, and brain (Figure 6B).
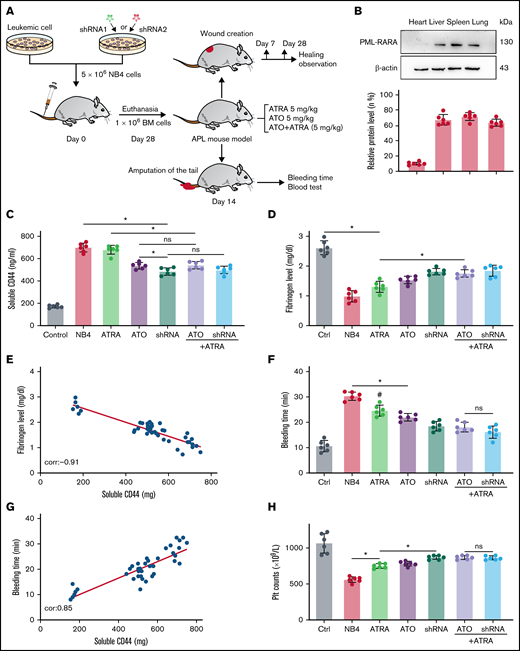
CD44 participates in hemorrhage in mice with APL. (A) The outline depicts the steps of the animal experiments. (B) On day 28, the hearts, livers, spleens, and lungs of APL model mice were extracted. The expression of PML-RARA was measured. ImageJ was used to calculate the gray value. (C) Soluble CD44 levels of APL mouse models treated as described above were measured by ELISA. (D) On day 21, fibrinogen levels in the different groups of mice were evaluated. (E) Pearson correlation between the fibrinogen level and soluble CD44 concentration at day 21. (F-G) Bleeding time was recorded, and the Pearson correlation between bleeding time and soluble CD44 concentration was measured, respectively. (H-I) Platelet (Plt) counts were measured, and the correlation between the number of platelets and plasma CD44 concentration was analyzed. (J) d-dimer levels were tested before the mice underwent bleeding time assays. (K) The survival curve and median survival time (days) of transplantation of bare or CD44 knockdown NB4 cells with/without ATRA/ATO treatment. (L-M) The measurement of clot lysis time and Ks number were performed as previously described. Statistical significance was calculated by using the log-rank test and nonparametric, unpaired, two-tailed, Mann-Whitney test. *P < .05, **P < .01, #P < .05 vs the data in ATO + shRNA group in panel F. Ctrl, control; ns, not significant.
CD44 participates in hemorrhage in mice with APL. (A) The outline depicts the steps of the animal experiments. (B) On day 28, the hearts, livers, spleens, and lungs of APL model mice were extracted. The expression of PML-RARA was measured. ImageJ was used to calculate the gray value. (C) Soluble CD44 levels of APL mouse models treated as described above were measured by ELISA. (D) On day 21, fibrinogen levels in the different groups of mice were evaluated. (E) Pearson correlation between the fibrinogen level and soluble CD44 concentration at day 21. (F-G) Bleeding time was recorded, and the Pearson correlation between bleeding time and soluble CD44 concentration was measured, respectively. (H-I) Platelet (Plt) counts were measured, and the correlation between the number of platelets and plasma CD44 concentration was analyzed. (J) d-dimer levels were tested before the mice underwent bleeding time assays. (K) The survival curve and median survival time (days) of transplantation of bare or CD44 knockdown NB4 cells with/without ATRA/ATO treatment. (L-M) The measurement of clot lysis time and Ks number were performed as previously described. Statistical significance was calculated by using the log-rank test and nonparametric, unpaired, two-tailed, Mann-Whitney test. *P < .05, **P < .01, #P < .05 vs the data in ATO + shRNA group in panel F. Ctrl, control; ns, not significant.
The mice injected with NB4 cells were next randomly divided into 3 groups. Mice of these 3 groups were then intravenously administered ATRA, ATO, and ATRA/ATO, respectively. To study the effect of ATO on decreasing CD44 expression in vivo, the mice treated by NB4 cells transfected with shRNA were divided into 2 groups. The mice in one group were treated with ATRA, and the other group was not. Compared with levels in control mice, the plasma level of CD44 was significantly higher in the APL mice models. The plasma level of CD44 was lower in the ATO and shRNA groups than in the ATRA group, whereas the data in the 2 groups were comparable to data in the ATRA + ATO and ATRA + shRNA groups (Figure 6C). CD44 knockdown upregulated the concentration of plasma fibrinogen, and the results were similar to those of the ATRA + ATO/shRNA groups (Figure 6D). In addition, the plasma level of fibrinogen was negatively correlated with the concentration of CD44 (Figure 6E).
We then aimed to study the impact of CD44 on bleeding in vivo. APL mice displayed a shorter bleeding time after induction therapy. However, the mice with CD44 knockdown exhibited results comparable to those of the ATRA + ATO/shRNA groups (Figure 6F). Interestingly, the bleeding time of experimental mice was positively correlated with CD44 levels (Figure 6G). Moreover, we found that platelet counts in APL mice were significantly higher in the CD44 knockdown, ATRA + ATO, and ATRA + shRNA groups than in the other groups (Figure 6H-I). Much lower concentrations of d-dimer were observed in mice treated with ATRA + ATO and ATRA + shRNA than in mice treated with shRNA alone (Figure 6J). However, CD44 knockdown alone did not significantly prolong the survival time of APL mice. Treatment with ATRA + ATO apparently improved the survival time of APL mice. The effect of ATRA + CD44 knockdown was better than that of ATO alone (Figure 6K). To further explore the effect of CD44 on the characters of fibrin clots formed by APL mice PPP. We measured the lysis time and Ks of the clots formed by the mice with the above treatment. With the increase of plasma fibrinogen level, the lysis time was prolonged and the Ks number also decreased (Figure 6L-M). These results suggest that APL-CD44 is involved in the process of bleeding and fibrinolysis in vivo.
CD44 together with PS exposure contributes to fibrin deposition on the membrane of apoptotic blasts
Previously, we found that apoptotic leukemic cells deposited fibrin in situ via the procoagulant activity of PS. We therefore aimed to determine the role of CD44 in fibrin deposition in apoptotic leukemic cells. NB4 cells underwent apoptosis from day 1 after DNR treatment, whereas ATO led to apoptosis at day 3 (Figure 7A). As the percentage of apoptotic cells increased, the PS exposure percentage increased consistently (Figure 7B). The procoagulant activity of apoptotic cells was measured by the generation of the coagulation protein complex. Compared with the fresh blast group, the DNR and ATO groups produced >3 times more intrinsic Xa, extrinsic Xa, and thrombin (Figure 7C). The NB4 cells treated as described above were then mixed with lactadherin and fibrinogen. The leukemic cells treated with DNR and ATO exhibited circular and brightly stained lactadherin, whereas fresh NB4 cells displayed little staining. In contrast, fresh NB4 cells exhibited high affinity to fibrinogen compared with that in the DNR and ATO groups, which showed weak fluorescence. After treatment with an anti-CD44 antibody, decreased levels of fibrinogen bound to leukemia blasts, and apoptotic cells still exhibited little fibrinogen binding (Figure 7E). Therefore, PS could not ligate fibrinogen by itself. Moreover, fresh leukemic cells could deposit comparable concentrations of fibrin in the presence of additional thrombin (Figure 7D).
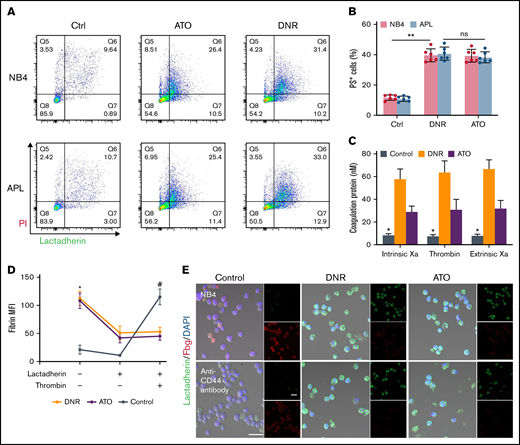
CD44 and PS exposure on the surface of leukemic cells contributes to the in situ deposition of fibrin. (A) Flow cytometry was used to quantify apoptotic cells stained with lactadherin after treatment with chemotherapy drugs. (B) The percentage of apoptotic leukemic cells. (C) A total of 1 × 10⁶ target APL cells were incubated with coagulation reaction substrates, and the production of thrombin, intrinsic FXa, and extrinsic FXa was measured by using a microplate reader. (D) Leukemia cells with various treatments were incubated with fibrinogen and coagulation reaction substrates in the presence of lactadherin or thrombin. Fibrin absorption was evaluated by using a microplate reader. (E) Leukemic cells treated as described above were stained with lactadherin (green), fibrinogen (red), and 4′,6-diamidino-2-phenylindole (DAPI; blue). Scale bars, 20 µm. Each image was from 5 experiments. **P < .01 in panel B. *P < .05 vs the data in the DNR group in panel C. *P < .05 vs the control, #P < .05 vs the DNR group in panel D. Each value was from at least 3 experiments and is shown as the mean ± standard deviation. Ctrl, control; ns, not significant; PI, propidium iodide.
CD44 and PS exposure on the surface of leukemic cells contributes to the in situ deposition of fibrin. (A) Flow cytometry was used to quantify apoptotic cells stained with lactadherin after treatment with chemotherapy drugs. (B) The percentage of apoptotic leukemic cells. (C) A total of 1 × 10⁶ target APL cells were incubated with coagulation reaction substrates, and the production of thrombin, intrinsic FXa, and extrinsic FXa was measured by using a microplate reader. (D) Leukemia cells with various treatments were incubated with fibrinogen and coagulation reaction substrates in the presence of lactadherin or thrombin. Fibrin absorption was evaluated by using a microplate reader. (E) Leukemic cells treated as described above were stained with lactadherin (green), fibrinogen (red), and 4′,6-diamidino-2-phenylindole (DAPI; blue). Scale bars, 20 µm. Each image was from 5 experiments. **P < .01 in panel B. *P < .05 vs the data in the DNR group in panel C. *P < .05 vs the control, #P < .05 vs the DNR group in panel D. Each value was from at least 3 experiments and is shown as the mean ± standard deviation. Ctrl, control; ns, not significant; PI, propidium iodide.
Discussion
In this study, we first showed that APL cells spontaneously bind to fibrinogen and activated platelets through the membrane CD44 protein. Our in vitro findings revealed that binding leads to structurally altered fibrin clots, which are more resistant to fibrinolysis. In vivo experiments showed that the CD44–fibrinogen interaction interrupts normal hemostasis. In addition, ATRA showed no effect on CD44 expression on the surface of leukemic cells. ATO and DNR significantly decreased CD44 expression.
Our studies showed that CD44 is distributed on the membrane of APL blasts as well as the cytosolic surface of endosome organelles. The interruption of membrane CD44–fibrinogen ligation significantly reduced intracellular fibrinogen deposition. Therefore, apart from consuming fibrinolysis,27 APL blasts adhere to and endocytose fibrinogen, thereby contributing to pathologic hemorrhage. Hyaluronic acid is a primary CD44 ligation. However, we showed that APL blast membrane CD44 showed similar adhesivity to fibrinogen and hyaluronic acid (supplemental Figure 7). There are a few possible reasons for this. First, CD44 is active and has low levels of N-glycosylation.28 Second, soluble CD44 and CD44 variant isoforms are both overexpressed on tumor cells. Soluble CD44 was shown to bind fibrinogen,29 and it is ubiquitously expressed and inactive unless activated under pathologic conditions.30 Because of its targeting of CD44, hyaluronic acid has been widely studied for cancer therapy.31 Thus, fibrinogen can also be a promising biomaterial for drug delivery.
We evaluated the relationship between fibrin clot structure and APL and found that decreased permeability and increased clot fibrinolysis were observed in subjects with APL. These structural properties of the clot, together with the high procoagulant effect of APL blasts, contribute to coagulation consumption.21 Our studies revealed that CD44 distributed around the membrane of leukemic cells deposited more fibrin on the surface of APL cells via binding with fibrinogen. Besides, abnormal deposition results in alteration of fibrin fiber distribution; leukemic cells were wrapped by fibrin fibers, leading to more dense clot formation. Studies have shown that the CD44-binding site of fibrinogen is localized at the β chain (residues 15-16).29 The binding of CD44 to fibrinogen may cover the αC region, which is next to the β chain, thereby impeding plasminogen binding.32 This process may be the possible mechanism by which clots with altered fibrin structures exhibited fibrinolysis resistance in this study. Previous studies showed that continuous occupancy of fibrinogen on platelets inhibits platelet activation, leading to hemorrhagic death.33 Nevertheless, because of the hyperfibrinolytic effect of APL blasts, CD44–fibrinogen binding could induce enhanced fibrinogen consumption and then contribute to bleeding in APL. Their heterogeneous distribution around liquid tumor cells therefore exacerbates hemorrhage diathesis, unlike the results in solid tumors.
Platelet activation and aggregation are the initial processes of primary hemostasis. However, thrombocytopenia is a common complication of acute leukemia, with an incidence rate of 75%. In patients with APL, thrombocytopenia results from several mechanisms, including inflammatory factor dysfunction,34 pathologic coagulation, and BM infiltration. Recent studies have shown that podoplanin in APL cells specifically induces platelet binding, aggregation, and activation. The expression of podoplanin could be substantially reduced by ATRA, whereas the effect of ATO was modest.35 In our study, we found that CD44 on the membrane of APL blasts bound activated platelets but did not inactivate platelets. Therefore, this binding may be attributed to the ligation of CD44 with P-selectin.36 In addition, ATO significantly decreased the expression of CD44 in APL cells, and ATRA had the opposite effect. The difference in their regulatory effects on leukemic cells can be attributed to different targets. ATRA degrades PML-RARA by activating the protease of the RARA protein, cleaving the PML moiety, and initiating autophagic vesicles. ATO induces PML protein breakdown.37 Thus, the expression of CD44 may be associated with the PML protein, whereas podoplanin is related to the RARA protein. Interestingly, leukemic cells also activated platelets through fibrinogen deposited on the membrane in this study. Accordingly, the procoagulant activity of platelets was evoked. PS exposure mediated more coagulation factor FVIII adhered to the APL cell surface.38 These mechanisms contribute to thrombocytopenia and consumption coagulation in APL.
Hyperactivation of the PI3K/Akt pathway is involved in leukemia cell proliferation, motility, and survival.39,40 PI3K/Akt has been reported to regulate the expression of CD44 in various cancers. In oral cancers, various CD44 isoforms are regulated by different mechanisms and exert different functions. CD44v4 is regulated by Raf-MERK signals and participates in tumor infiltration and metastasis. CD44v6 is regulated by PI3K/Akt and plays a major role in tumor cell angiogenesis.41 The results of our study showed that PI3K/Akt/mTOR signaling is closely associated with the expression of CD44. Inhibition of the PI3K pathway interrupts the deposition of fibrinogen on the membrane of leukemic cells, thereby benefiting antihemorrhagic therapy in APL. The binding between CD44 and hyaluronan inversely induces phosphorylation of Akt, resulting in a positive feedback loop between CD44 and the Akt pathway.42 However, the molecular mechanisms of CD44–fibrin(ogen) binding remain to be further studied.
An increasing number of studies have shown that ATRA-ATO combination therapy is not inferior to and may be better than ATRA chemotherapy.43-45 The 3-year disease-free survival rate and the 7-year cumulative incidence of relapse were lower in the ATO group than in the ATRA group. In addition, patients with ATO treatment showed a lower risk for grade 3 to 4 thrombocytopenia and reduced transfusion support.43,46 Our results showed that ATRA/ATO significantly shortened the bleeding time and elevated the number of platelets in vivo. The data were associated with the level of CD44, which suggests that CD44 proteins on the membrane of APL cells are involved in maintaining hemostasis homeostasis. Interestingly, mouse models of APL showed prolonged progression of the healing process compared with the controls. Coagulation, inflammation, proliferation, and maturation are the 4 steps of wound healing. Crosslinked fibrin within the blood clot provides a matrix into which fibroblasts and endothelial cells migrate for tissue regeneration. Studies have reported that the content of fibrinogen affects the secondary structure of fibrin nets, while dense fibrin scaffolds are beneficial for wound healing.47 In addition, fibrin promotes the healing process as an inhibitor of proinflammatory factors but an activator of anti-inflammatory factors and a mediator of growth factors.48,49 In our study, CD44 knockdown shortened healing progression (supplemental Figure 8). Therefore, CD44–fibrinogen binding may be the main reason for delayed wound construction. Moreover, endothelial cells and fibroblasts bind fibrin by CD44.49,50 Thus, APL cells in the blood may interrupt the healing process by binding sites for repair cells. The specific process requires further study, however.
In summary, unlike previous studies that focused on the function of CD44 in tumor cell regeneration and metastasis, our reports showed that binding of the APL cell membrane protein CD44 with fibrinogen and platelets results in abnormal consumption of hemostasis factors, in situ fibrin deposition, in situ coagulation, and fibrinolytic resistance. These bindings not only impaired normal hemostasis but also interrupted the survival time. Future therapies may target this binding to alleviate pathologic hemorrhage in APL.
Acknowledgments
The authors thank Yanming Xue, Jingdong Qu, and Rui Huang for the sample collection, and Yufeng Liu and Qiusheng Wang for excellent technical assistance.
This work was supported by grants (82170262 and 81870353) from the National Science Foundation of China.
Authorship
Contribution: C.W. designed the research, performed experiments, analyzed results, made the figures, and wrote the paper; J.S. obtained funding, designed the study, performed experiments, analyzed results, and revised the manuscript; Y.W. performed experiments and analyzed results; N.Z. and S.F. performed some experiments, analyzed data, and revised the manuscript; and all authors read and approved the final version of the manuscript.
Conflict-of-interest disclosure: The authors declare no competing financial interests.
Correspondence: Jialan Shi, Department of Hematology, The First Affiliated Hospital, Harbin Medical University, People’s Republic of China; Departments of Research and Medical Oncology, VA Boston Healthcare System, Dana-Farber Cancer Institute, Harvard Medical School, 1400 VFW Parkway, West Roxbury, MA 02132; e-mail: jialan_shi@dfci.harvard.edu; or Shaohong Fang, Department of Medicine, The Second Hospital, Harbin Medical University, 157 Baojian St, Nangang District, Harbin 150081, People’s Republic of China; e-mail: fangshaohong7802@163.com.

