

Key Points
Modified versions of the ACCP, VTE-BLEED, and HAS-BLED scores accurately predict major bleeding during extended anticoagulation.
The new CHAP model had comparable discriminatory power but is simpler and may improve risk estimation by using continuous predictors.

Abstract
No clinical prediction model has been specifically developed or validated to identify patients with unprovoked venous thromboembolism (VTE) who are at high risk of major bleeding during extended anticoagulation. In a prospective multinational cohort study of patients with unprovoked VTE receiving extended anticoagulation after completing ≥3 months of initial treatment, we derived a new clinical prediction model using a multivariable Cox regression model based on 22 prespecified candidate predictors for the primary outcome of major bleeding. This model was then compared with modified versions of 5 existing clinical scores. A total of 118 major bleeding events occurred in 2516 patients (annual risk, 1.7%; 95% confidence interval [CI], 1.4-2.1). The incidences of major bleeding events per 100 person-years in high-risk and non–high-risk patients, respectively, were 3.9 (95% CI, 3.0-5.1) and 1.1 (0.8-1.4) using the newly derived creatinine, hemoglobin, age, and use of antiplatelet agent (CHAP) model; 3.3 (2.6-4.1) and 1.0 (0.7-1.3) using modified ACCP score, 5.3 (0.6-19.2) and 1.7 (1.4-2.0) using modified RIETE score, 3.1 (2.3-3.9) and 1.1 (0.9-1.5) using modified VTE-BLEED score, 5.2 (3.3-7.8) and 1.5 (1.2-1.8) using modified HAS-BLED score, and 4.8 (1.3-12.4) and 1.7 (1.4-2.0) using modified outpatient bleeding index score. Modified versions of the ACCP, VTE-BLEED, and HAS-BLED scores help identify patients with unprovoked VTE who are at high risk of major bleeding and should be considered for discontinuation of anticoagulation after 3 to 6 months of initial treatment. The CHAP model may further improve estimation of bleeding risk by using continuous predictor variables, but external validation is required before its implementation in clinical practice.
Introduction
Venous thromboembolism (VTE), comprising deep vein thrombosis and pulmonary embolism, is a common, potentially fatal, and disabling disease.1 Whether to continue anticoagulant therapy after completing an initial 3- to 6-month course of anticoagulant therapy for VTE is a common and often vexing clinical question. Ultimately, patients, clinicians, and policymakers must balance the long-term risk of recurrent VTE if anticoagulant agents are discontinued2 with the long-term risk of major bleeding with continued anticoagulation.3
Patients with VTE provoked by major transient risk factors (eg, major surgery) have a low risk of recurrent VTE after discontinuation of anticoagulant agents4,5 and can safely stop anticoagulation after 3 to 6 months of initial therapy.6,7 Conversely, patients with a first episode of VTE that is unprovoked or associated with minor transient risk factors (ie, weakly provoked) have recurrent VTE risks of 10% at 1 year and 36% at 10 years without anticoagulation2 after having received 3 to 6 months of initial therapy. As a result, such patients require suppression of the risk of recurrent VTE with indefinite duration of anticoagulation unless their risk of major bleeding is or becomes high.6,7 Because mortality rates associated with anticoagulant-related major bleeding are 2 to 3 times higher than those associated with recurrent VTE with discontinued anticoagulation,2,3,8 patients with an annual risk of major bleeding >2.5% to 3% are not expected to gain a net clinical benefit from extended anticoagulation in the long term, even if their 10-year risk of recurrent VTE is as high as 36%.9,10 Unfortunately, there is no formal or systematic approach to assess who has a high risk of major bleeding; therefore, decision-making about stopping or continuing anticoagulation after 3 to 6 months in patients with unprovoked VTE remains a challenge.
To estimate the risk for anticoagulation-related bleeding in patients with VTE, several prediction scores have been proposed.11 The most extensively validated prediction scores include the ACCP,6 RIETE,12 VTE-BLEED,13 HAS-BLED,14 and modified outpatient bleeding index (OBRI)15 scores (supplemental Tables 1 and 2). However, these scores have not been validated in a study specifically focused on patients with unprovoked VTE receiving extended anticoagulation. Furthermore, these scores were developed in patients with atrial fibrillation receiving anticoagulant or antiplatelet agents14,15 or patients with VTE during the initial 3 to 6 months of anticoagulant therapy.12,13,16 -19 These patient populations have a higher bleeding risk than “anticoagulant-experienced” patients with VTE and may have different risk factors for bleeding. In addition, several risk scores to predict bleeding in patients with VTE include cancer as a predictor,6,12,13,18,20 which immediately limits the applicability of these scores for patients with unprovoked VTE. Because accurate estimation of major bleeding risk is essential to help optimize individualized long-term anticoagulation management of unprovoked VTE, we aimed to compare the predictive performance of a newly derived, easy-to-use clinical prediction model and modified versions of the ACCP, RIETE, VTE-BLEED, HAS-BLED, and OBRI scores in predicting the risk of major bleeding during extended anticoagulation in patients with unprovoked or weakly provoked VTE.
Methods
Reporting of this study is in accordance with the Transparent Reporting of a multivariable prediction model for Individual Prognosis Or Diagnosis recommendations.21
Study design and participants
We conducted a prospective cohort study at 12 tertiary-care centers in Canada, the United States, and the United Kingdom between September 2008 and September 2016 (ClinicalTrials.gov ID NCT00788736) that was specifically designed to derive a prediction model to estimate major bleeding risk during extended anticoagulation therapy in patients with unprovoked or weakly provoked VTE. Consecutive consenting participants were eligible for enrollment if they (1) had a first or recurrent objectively confirmed, symptomatic, proximal lower-limb deep vein thrombosis or pulmonary embolism that was unprovoked or weakly provoked (this criterion was added for the last 4 years of study enrollment); (2) had completed ≥3 months of anticoagulant therapy with a vitamin K antagonist (VKA) with an International Normalized Ratio (INR) therapeutic range of 2.0 to 3.0 or a direct oral anticoagulant (DOAC) at standard therapeutic dose; and (3) were deemed to require extended anticoagulation therapy with these agents and doses (ie, treatment with reduced-dose DOACs was not allowed). Weakly provoked VTE was defined as VTE associated with minor persistent risk factors (inflammatory bowel disease, lower-extremity paralysis or paresis) or minor transient risk factors (hospitalization for medical illness, travel >8 hours, pregnancy, exogenous estrogen, puerperium, or lower-limb trauma with transient impairment of mobility). Unprovoked VTE was defined as VTE occurring in the absence of major or the aforementioned minor risk factors. We excluded patients with VTE provoked by major transient or persistent risk factors including major surgery or active cancer, a major bleeding event while receiving oral anticoagulant therapy for the index VTE event, or active bleeding at study enrollment, and those who declined to participate or were unable to provide written informed consent. Active cancer was defined as cancer other than basal-cell or squamous-cell carcinoma of the skin at the time of enrollment or at VTE diagnosis, cancer ≤6 months before VTE diagnosis, any treatment for cancer within the prior 6 months, or recurrent or metastatic cancer. All included patients provided written informed consent. The institutional research ethics board at each participating center approved the study.
Data collection and follow-up
Using a standardized form, we collected baseline clinical data at enrollment, including potential predictors of anticoagulant-related major bleeding. Patients were instructed to contact study personnel if they experienced a bleeding event during follow-up. They were also interviewed every 6 months ± 3 weeks in person or via telephone by study personnel using a standardized script to ascertain bleeding events and ensure accurate recording of INR data. Participants were withdrawn and censored if they stopped taking anticoagulant agents, experienced a major bleeding event, were lost to follow-up, withdrew consent, or died.
Study outcome
The study outcome was major bleeding as defined by the International Society on Thrombosis and Haemostasis, ie, overt bleeding that was associated with a decrease in hemoglobin concentration of ≥20 g/L, required transfusion of ≥2 units of red blood cells or whole blood, occurred in a critical site (intracranial, intraspinal, intraocular, pericardial, intraarticular, intramuscular with compartment syndrome, and retroperitoneal), or was fatal.22 Death was attributed to bleeding if bleeding was the immediate cause of death or contributed to it. An independent adjudication committee, which was blinded to potential predictor data, assessed all suspected bleeding events and deaths by reviewing objective data including, but not limited to, transfusion records, surgical records, admitting diagnoses, imaging procedures, hemoglobin levels before and after the bleeding event, and clinical progress notes and interviews with next of kin in case of death.
Candidate predictor variables for new clinical prediction model
Candidate predictor variables were collected at enrollment and included demographic data, comorbidities, habits, concomitant medications, basic laboratory data, and genotyping for thrombophilia and genes influencing VKA metabolism (supplemental Table 3). Potential predictors were chosen based on previous literature and expert opinion. The time in the therapeutic INR range (2.0-3.0) was calculated according to Rosendaal’s method23 using all available INR values. Labile INR was considered absent in patients taking DOACs.
Existing clinical prediction scores
Based on clinical data collected at study enrollment, we calculated the ACCP, RIETE, VTE-BLEED, HAS-BLED, and modified OBRI scores (supplemental Tables 1 and 2) for each patient. To increase its usability, we used a modified version of the original ACCP index comprising fewer variables and only those available in this study cohort. Definitions for each variable used in the derivation studies of the prediction scores and our present study are provided in supplemental Table 1. Uncontrolled hypertension was the only variable whose definition was significantly modified: it was defined as systolic blood pressure ≥140 mm Hg and >160 mm Hg in the derivation studies of the VTE-BLEED and HAS-BLED scores, respectively, whereas, in the present study, treatment for hypertension at study enrollment was used as a proxy variable in the absence of baseline systolic blood pressure assessment. Patients were classified as being at high risk of major bleeding or not at high risk based on cutoffs proposed in the derivation studies of each prediction score (Table 1).
Prediction scores modified for use in patients with unprovoked VTE and simplified for daily clinical practice
| Variable | Modified ACCP | Modified RIETE | Modified VTE-BLEED | Modified HAS-BLED | Modified OBRI |
|---|---|---|---|---|---|
| Age | >65 y, +1; >75 y, +2 | >75 y, +1 | ≥60 y, +1.5 | >65 y, +1 | >65 y, +1 |
| Previous gastrointestinal bleed | +1 | – | +1.5 | +1 | +1 |
| Renal insufficiency/failure | +1 | +1.5 | +1.5 | +1 | * |
| Previous stroke | +1 | – | – | +1 | +1 |
| Diabetes | +1 | – | – | – | * |
| Anemia | +1 | +1.5 | +1.5 | – | * |
| Antiplatelet therapy | +1 | – | – | +1 | – |
| Nonsteroidal anti-inflammatory drug | +1 | – | – | – | |
| Time in therapeutic INR range <60% | +1 | – | – | +1 | – |
| Antihypertensive medication | – | – | Male, +1 | +1 | – |
| Symptomatic pulmonary embolism | – | +1 | – | – | – |
| Recent myocardial infarction | – | – | – | – | * |
| Bleeding risk stratification | – | – | – | – | – |
| Non–high risk | 0-1 risk factors | 0-4 points | 0-1 points | 0-2 points | 0-2 points |
| High risk | ≥2 risk factors | ≥5 points | ≥2 points | ≥3 points | ≥3 points |
1 point is scored for ≥1 comorbidity, including renal impairment, diabetes, anemia, or recent myocardial infarction.
All variables required to calculate the 5 existing scores were available except for alcohol use disorder and liver failure, which were not collected and assumed absent in all patients (supplemental Table 4). Because each of the 5 existing scores was modified because of a change in variable definitions (supplemental Table 1) or the absence of predictor variables in our study population (eg, active cancer), these scores are hereafter referred to as modified versions of the ACCP, RIETE, VTE-BLEED, HAS-BLEED, and OBRI scores. We conducted a complete case analysis, analyzing only patients for whom there were no missing data for the variables of interest. The proportion of patients in whom the modified scores could not be calculated as a result of missing values ranged from 0.2% to 5.8%.
Sample size
At the time of design of the study, a common methodological criterion for obtaining stable parameter estimates in a multivariable Cox regression model held that 5 to 10 events are required per predictor analyzed in the model. Given our interest in 22 predictors previously identified as potential predictors of major bleeding (supplemental Table 3), we planned to continue patient enrollment and follow-up until ≥100 major bleeding events had been adjudicated, assuming that the final number of bleeding events will be higher as a result of the lag between outcome occurrence and outcome adjudication.
Statistical analysis
We determined the incidence rates of a first major, intracranial, and fatal bleeding event per 100 person-years of follow-up. Bleeding rates were calculated as the total number of events divided by the total number of person-years of follow-up. We used the Kaplan-Meier method to estimate the cumulative incidence of major bleeding over time. The case-fatality rate of major bleeding was calculated as the total number of fatal bleeding events divided by the total number of major bleeding events.
We defined that a prediction score would be clinically useful for making decisions about duration of anticoagulation if it could (1) predict an average major bleeding rate of >2.5 events per 100 person-years in patients classified at high risk and (2) accurately discriminate between high- and non–high-risk patients. This high-risk threshold for major bleeding was chosen to identify patients who are not expected to gain a net benefit from extended anticoagulation in the long term, irrespective of their risk of recurrence,6,9,10 based on estimated case-fatality rates of recurrent VTE and major bleeding.2,3,8
Derivation and internal validation of new prediction model.
We first performed a univariable Kaplan-Meier analysis to determine the strength of association between each potential predictor variable and major bleeding. We assessed departure from linearity graphically and added quadratic and cubic terms when necessary. We then fit a multivariable Cox regression model with Firth’s penalization using candidate variables (supplemental Table 3) as predictor variables and major bleeding during follow-up as the outcome variable. Continuous variables were not dichotomized. Model selection was based on the objective to find the “best” combinations of predictor variables that could identify a subgroup of patients with a risk of major bleeding >2.5% per year.9,10 “Best” combinations were defined as those that are easy to use by clinicians, contain as few variables as possible (ie, ideally ≤4), and exhibit good discrimination (ie, reliably discriminating patients at high risk of bleeding vs those not at high risk). We did not use an automated predictor selection method because such procedures have several disadvantages (eg, overestimation of the performance of the selected model) and may lead to an extensive, cumbersome model with inclusion of predictors that only marginally change the performance of the model. β-Coefficients of the final model were derived using complete case analysis because <10% of patients had missing values. In a sensitivity analysis, multiple imputation was performed for missing values using predictive mean matching (only continuous variables had missing values) based on 20 imputation sets including all baseline variables but not the outcome.24
Model performance was measured in terms of discrimination and calibration. Discrimination was assessed using the C-statistic. Using the loess function, we created calibration plots to assess the agreement between predicted and observed risks in deciles of the predicted risk at 1 year. Calibration was further assessed using the calibration slope in internal validation. We also determined the incidences of major bleeding (expressed as events per 100 person-years) in patients classified at high risk (ie, ≥2.5%) and not at high risk (ie, <2.5%) according to the final model. Sensitivity, specificity, and positive and negative predictive values were determined for the cutoff of 2.5% predicted annual risk of major bleeding.
Finally, we performed an internal validation of the final model’s performance by bootstrapping methods.25-27 Bootstrap sampling was performed 500 times from the original sample, sampling the same number of patients as in the original sample with replacement. The final model was fit to each bootstrap sample, and each fitted model was applied to the bootstrap sample and the original sample. Discrimination and calibration were then assessed for both samples, and the difference between the performances was calculated, which is considered an estimate of the optimism in the apparent performance.27 These 500 differences were then averaged to obtain an estimate of the optimism.27 Finally, the optimism-corrected performance was calculated by subtracting the averaged optimism from the performance of the original model.26,27
External validation of existing scores.
We used the Cox proportional hazard model with Firth’s penalization to compare bleeding rates in patients classified as high-risk and non–high-risk for each score (Table 1). The discriminative performance to predict major bleeding was assessed by evaluating whether the lower and upper limits of the 95% confidence interval (CI) for the rates of major bleeding were ≥2.5% and <2.5% in patients at high risk and not at high risk, respectively. We also assessed discrimination by calculating the concordance statistic (ie, C-statistic). Model calibration was assessed by evaluating observed rates of major bleeding according to points stratification.
Subgroup analysis.
Subgroup analyses were performed according to the anticoagulant regimen (VKA vs DOAC) and duration of anticoagulation before enrollment (3-9 months vs >9 months).
A 2-sided P value <.05 was considered to indicate statistical significance. All analyses were conducted by a biostatistician using SAS version 9.4 software.
Results
A total of 2516 patients were enrolled and followed for a median 2.6 years (interquartile range [IQR], 1.5-3.9 years). Of these, 2481 (99%) completed follow-up. Patients who did not complete follow-up had their last study encounter after a median follow-up duration of 1.1 years (IQR, 0.6-2.0 years). The mean patient age was 60 years (standard deviation, 15 years), and 1609 patients (64%) were male. A total of 2280 patients (91%) received VKA, 186 (7.4%) received rivaroxaban, 30 (1.2%) received edoxaban, 16 (0.6%) received dabigatran, and 3 (0.1%) received apixaban. The anticoagulant drug for one patient was unknown. The median duration of anticoagulant treatment prior to study enrollment was 7.1 months (IQR, 5.9-27.7 months).
During 7030 person-years of follow-up, 118 patients experienced a major bleeding event, corresponding to an annual major bleeding risk of 1.7% (95% CI, 1.4%-2.1%) that remained linear during follow-up. A total of 7 bleeding events were fatal (0.10 per 100 person-years; 95% CI, 0.05-0.21), corresponding to a case-fatality rate of major bleeding of 5.8% (95% CI, 2.3%-11.9%). Annual major bleeding risks in patients receiving VKAs and DOACs were 1.8% (95% CI, 1.5%-2.2%) and 1.4% (95% CI, 0.6%-3.2%), respectively.
New clinical prediction model
In a univariable analysis, age, sex, treatment for hypertension, presence of the CYP2C9*3(T/G) mutation, antiplatelet agent use, statin use, exogenous estrogen use, anemia, creatinine levels, and hemoglobin levels were statistically significantly associated with major bleeding (Table 2). In patients receiving extended anticoagulation with VKAs, the time in therapeutic INR range (median, 74.3%; IQR, 62.5%-83.6%) was not associated with major bleeding (unadjusted odds ratio, 0.99; 95% CI, 0.98-1.002). The following predictors were selected for the final clinical prediction model: (1) creatinine, (2) hemoglobin, (3) age, and (4) use of antiplatelet agent (CHAP model; Table 3). Although creatinine was not statistically significantly associated with major bleeding in the multivariable analysis, we decided to include creatinine in the final model because creatinine has consistently been shown to be a predictor of major bleeding and was included in previous prediction scores for major bleeding. Female sex, hypertension, and statin use were strongly associated with major bleeding in univariable analysis (Table 1), but not in multivariable analysis (supplemental Table 4). Furthermore, when adding sex, hypertension, and statin use to the CHAP model, the discriminatory power did not increase meaningfully. To obtain a model with as few variables as possible, sex, hypertension, and statin use were therefore not included in the final model. There was no clinically meaningful change in the β-coefficients after performing the analysis using the multiple imputation dataset (Table 3). The C-statistic of the CHAP model based on complete case analysis of 2316 patients who experienced 112 major bleeding events was 0.68 (95% CI, 0.62-0.73). The calibration plot showed good agreement between predicted and observed risks (supplemental Figure 1).
Univariable association between predictor variables and major bleeding during follow-up
| Variable | Patients with major bleed (n = 118) | Patients without major bleed (n = 2398) | Hazard ratio (95% CI) | Missing values |
|---|---|---|---|---|
| Median age, y | 69 (57-76) | 61 (49-71) | 1.03 (1.02-1.05)* | 0 |
| Female sex | 58 (49) | 849 (35) | 1.81 (1.25-2.60) | 0 |
| Race | 5 (0.2) | |||
| White | 104 (88.1) | 2201 (92.0) | Ref. | |
| Black | 12 (10.2) | 155 (6.5) | 1.75 (0.96-3.19) | |
| Other | 2 (1.7) | 37 (1.5) | 1.34 (0.33-5.37) | |
| Prior myocardial infarction | 7 (5.9) | 119 (5.0) | 1.24 (0.58-2.66) | 0 |
| Prior gastrointestinal bleed | 4 (3.4) | 79 (3.3) | 1.16 (0.43-3.13) | 0 |
| Hypertension | 61 (51.7) | 887 (37.0) | 1.73 (1.20-2.49) | 0 |
| Diabetes | 17 (14.4) | 256 (10.7) | 1.45 (0.87-2.42) | 0 |
| Obesity | 61 (51.7) | 1149 (48.0) | 1.07 (0.75-1.55) | 5 (0.2) |
| Postthrombotic syndrome | 16 (14.0) | 491 (21.1) | 0.69 (0.40-1.19) | 73 (2.9) |
| Smoking | 8 (6.8) | 274 (11.4) | 0.57 (0.28-1.17) | 1 (<0.1) |
| Antiplatelet agent | 18 (15.2) | 129 (5.4) | 2.99 (1.80-4.96) | 0 |
| Statin | 48 (41.0) | 635 (26.5) | 1.99 (1.37-2.88) | 2 (0.1) |
| Exogenous estrogen | 48 (41.0) | 651 (27.2) | 1.92 (1.32-2.78) | 2 (0.1) |
| Selective serotonin reuptake inhibitor | 10 (8.5) | 129 (5.4) | 1.66 (0.87-3.16) | 0 |
| Hypercholesterolemia | 35 (36.5) | 660 (33.9) | 1.15 (0.76-1.75) | 475 (19) |
| Median creatinine, µmol/L | 85 (68-105) | 80 (69-94) | 1.002 (1.001-1.004)* | 174 (6.9) |
| Median hemoglobin, g/L | 138 (122-147) | 143 (133-152) | 1.02 (1.01-1.02)† | 37 (1.5) |
| Anemia, % | 34 (28.8) | 283 (12.0) | 3.19 (2.13-4.76) | 37 (1.5) |
| Prothrombin gene mutation or Factor V Leiden | 19 (46.3) | 345 (43.3) | 1.23 (0.66-2.28) | 1677 (67) |
| Antiphospholipid antibodies | 11 (22.9) | 176 (20.6) | 1.12 (0.57-2.21) | 1615 (64) |
| Protein C or S deficiency | 6 (14.3) | 117 (14.9) | 0.88 (0.37-2.06) | 1688 (67) |
| Antithrombin deficiency | 1 (2.1) | 28 (3.0) | 0.72 (0.10-5.21) | 1534 (61) |
| CYP2C93(T/G) | 21 (19.8) | 223 (10.4) | 2.03 (1.26-3.29) | 257 (10) |
Values presented as count (percentage) where applicable. Ranges in parentheses are IQRs.
Increased by 1 unit.
Decreased by 1 unit.
New CHAP multivariable prediction model
| Component | Original dataset | Imputation dataset | ||
|---|---|---|---|---|
| β-coefficient | HR (95% CI) | β-coefficient | HR (95% CI) | |
| Creatinine (per µmol/L increase) | 0.0017 | 1.002 (0.999-1.004) | 0.0017 | 1.002 (0.999-1.004) |
| Hemoglobin (per g/L increase) | −0.0127 | 0.987 (0.980-0.994) | −0.0125 | 0.987 (0.981-0.994) |
| Age (per year increase) | 0.0251 | 1.025 (1.011-1.04) | 0.0237 | 1.024 (1.01-1.038) |
| Antiplatelet agent | 0.8995 | 2.458 (1.47-4.112) | 0.8871 | 2.428 (1.457-4.047) |
Baseline hazard at 1 y = 0.02. Sample calculation in a 65-y-old patient receiving a concomitant antiplatelet agent with a creatinine level of 115 µmol/L and a hemoglobin level of 110 g/L: 0.02*exp(115*0.0017 + 110*(−0.0127) + 65*0.0251 + 1*0.8995) = 7.6% predicted risk of major bleeding at 1 y of extended anticoagulation.
HR, hazard ratio.
Using the CHAP model, the predicted risks of major bleeding at 1 year were ≥2.5% (ie, high risk) in 586 patients (25%) and <2.5% (ie, non–high risk) in 1730 patients (75%; sample calculation shown in Table 3). Observed major bleeding rates were 3.9 events per 100 person-years (95% CI, 3.0-5.1) in high-risk patients and 1.1 events per 100 person-years (95% CI, 0.8-1.4) in non–high-risk patients (Table 4). The cumulative incidence of major bleeding in high-risk and non–high-risk groups increased linearly over time (Figure 1). The case-fatality rates of major bleeding were 10% (95% CI, 3.7%-22%) in high-risk patients and 1.8% (95% CI, 0.1%-10%) in non–high-risk patients.
Rates of bleeding events during extended oral anticoagulation in patients at high risk versus those not at high risk
| Variable | All patients | Modified ACCP | Modified RIETE | Modified VTE-BLEED | Modified HAS-BLED | Modified OBRI | CHAP Model | ||||||
|---|---|---|---|---|---|---|---|---|---|---|---|---|---|
| High risk | Non–high risk | High risk | Non–high risk | High risk | Non–high risk | High risk | Non–high risk | High risk | Non–high risk | High risk | Non–high risk | ||
| Patients | 2516 (100) | 832 (35) | 1538 (65) | 16 (1) | 2497 (99) | 739 (30) | 1708 (70) | 183 (8) | 2242 (92) | 39 (2) | 2468 (98) | 586 (25) | 1730 (75) |
| Person-years | 7030 | 2169 | 4576 | 38 | 6986 | 1961 | 4901 | 444 | 6422 | 83 | 6929 | 1525 | 4974 |
| Major bleeding | |||||||||||||
| Events | 121 | 71 | 44 | 2 | 119 | 60 | 56 | 23 | 94 | 4 | 117 | 60 | 55 |
| Event rate per 100 person-years | 1.7 (1.4-2.1) | 3.3 (2.6-4.1) | 1.0 (0.7-1.3) | 5.3 (0.6-19.2) | 1.7 (1.4-2.0) | 3.1 (2.3-3.9) | 1.1 (0.9-1.5) | 5.2 (3.3-7.8) | 1.5 (1.2-1.8) | 4.8 (1.3-12.4) | 1.7 (1.4-2.0) | 3.9 (3.0-5.1) | 1.1 (0.8-1.4) |
| Hazard ratio | — | 3.3 (2.3-4.9) | 3.1 (0.7-12.8) | 2.8 (1.9-4.0) | 3.6 (2.3-5.7) | 2.8 (1.1-7.4) | 3.4 (2.4-5.0) | ||||||
| Intracranial bleeding | |||||||||||||
| Events | 20 | 12 | 8 | 0 | 20 | 17 | 3 | 6 | 14 | 1 | 19 | 12 | 8 |
| Event rate per 100 person-years | 0.3 (0.2-0.4) | 0.6 (0.3-1.0) | 0.2 (0.1-0.3) | 0.0 | 0.3 (0.2-0.4) | 0.9 (0.5-1.4) | 0.1 (0.01-0.2) | 1.4 (0.5-2.9) | 0.2 (0.1-0.4) | 1.2 (0.03-6.7) | 0.3 (0.2-0.4) | 0.8 (0.4-1.4) | 0.2 (0.1-0.3) |
| Fatal bleeding | |||||||||||||
| Events | 7 | 6 | 1 | 0 | 7 | 7 | 0 | 3 | 4 | 1 | 6 | 6 | 1 |
| Event rate per 100 person-years | 0.1 (0.04-0.2) | 0.3 (0.1-0.6) | 0.02 (0.0-0.1) | 0.0 | 0.1 (0.04-0.2) | 0.4 (0.1-0.7) | 0.0 | 0.7 (0.1-2.0) | 0.1 (0.02-0.2) | 1.2 (0.03-6.7) | 0.1 (0.03-0.2) | 0.4 (0.1-0.9) | 0.02 (0.0-0.1) |
| Case-fatality rate of major bleeding, % | 5.8 (2.3-11.9) | 8.5 (3.1-18.4) | 2.3 (0.1-12.7) | 0.0 | 5.9 (2.4-12.1) | 11.7 (4.7-24.0) | 0.0 | 13.0 (2.7-38.1) | 4.3 (1.2-10.9) | 25.0 (0.6-100.0) | 5.1 (1.9-11.2) | 10 (3.7-21.8) | 1.8 (0.1-10.1) |
Values presented as count (percentage) where applicable. Ranges in parentheses are 95% CIs.
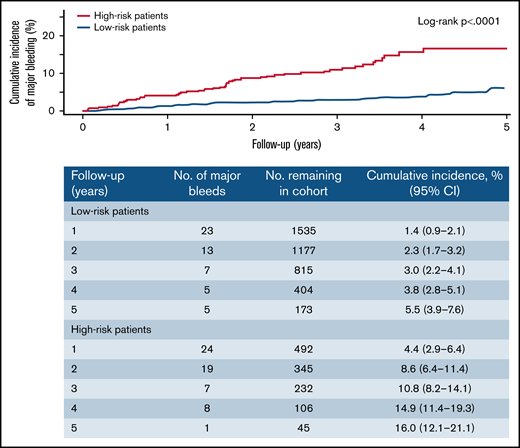
Cumulative incidence of major bleeding by predicted risk group according to the CHAP model. High-risk and non–high-risk patients were defined as those with ≥2.5% and <2.5% predicted risk of major bleeding at 1 year according to the CHAP model, respectively.
Cumulative incidence of major bleeding by predicted risk group according to the CHAP model. High-risk and non–high-risk patients were defined as those with ≥2.5% and <2.5% predicted risk of major bleeding at 1 year according to the CHAP model, respectively.
At the cutoff of 2.5% predicted risk of major bleeding at 1 year, the model’s sensitivity, specificity, positive predictive value, and negative predictive value were 52.7% (95% CI, 43.4%-61.9%), 76.1% (95% CI, 74.3%-77.9%), 10.1% (95% CI, 7.6%-12.5%), and 96.9% (95% CI, 96.1%-97.7%) over the entire follow-up duration, respectively (Table 5).
Measures of performance to predict major bleeding
| Prediction model | Sensitivity, % | Specificity, % | PPV, % | NPV, % | C-statistic |
|---|---|---|---|---|---|
| Modified ACCP | 61.6 (52.6-70.6) | 66.2 (64.3-68.2) | 8.3 (6.4-10.2) | 97.2 (96.4-98.0) | 0.65 (0.60-0.69) |
| Modified RIETE | 1.7 (0.0-4.0) | 99.4 (99.1-99.7) | 12.5 (0.0-28.7) | 95.1 (94.5-96.2) | 0.51 (0.49-0.52) |
| Modified VTE-BLEED | 53.1 (43.9-62.3) | 70.9 (69.1-72.8) | 8.1 (6.1-10.1) | 96.9 (96.1-97.7) | 0.61 (0.56-0.66) |
| Modified HAS-BLEED | 20.2 (12.8-27.5) | 93.1 (92.0-94.1) | 12.6 (7.8-17.4) | 95.9 (95.1-96.8) | 0.57 (0.53-0.61) |
| Modified OBRI | 3.4 (0.1-6.7) | 98.5 (98.1-99.0) | 10.3 (0.7-19.8) | 95.4 (94.6-96.2) | 0.51 (0.49-0.51) |
| CHAP model* | 52.7 (43.4-61.9) | 76.1 (74.3-77.9) | 10.1 (7.6-12.5) | 96.9 (96.1-97.7) | 0.65 (0.60-0.70) |
Values in parentheses are 95% CIs.
Calculated based on binary risk groups (high vs not high). High-risk and non–high-risk patients were defined as those with ≥2.5% and <2.5% predicted risk of major bleeding at 1 y, respectively, according to the CHAP model.
Using bootstrap sampling, the incidences of major bleeding were 3.9 events per 100 person-years (95% CI, 3.9-4.0) in high-risk patients and 1.2 events per 100 person-years (95% CI, 1.1-1.2) in non–high-risk patients. The optimism-corrected C-statistic was 0.67, and the optimism-corrected calibration slope was 0.87.
Performance of existing prediction scores
The distribution of the predictor variables comprising each score is presented in supplemental Table 5. The proportions of patients classified as being at high risk of major bleeding were 35.1% (95% CI, 33.2%-37.1%), 0.6% (0.4%-1.0%), 30.2% (28.4%-32.1%), 7.5% (6.5%-8.7%), and 1.6% (1.1%-2.1%) using the modified versions of the ACCP, RIETE, VTE-BLEED, HAS-BLED, and OBRI scores, respectively (Table 4).
Rates of major bleeding per 100 person-years in high-risk and non–high-risk patients were statistically significantly different for the modified versions of the ACCP, VTE-BLEED, HAS-BLED, and OBRI scores (Table 4). The case-fatality rate of major bleeding ranged from 0% to 25.0% in high-risk patients and from 0% to 5.9% in non–high-risk patients (Table 4). Sensitivity, specificity, positive predictive value, and negative predictive value of existing scores are presented in Table 5. The 5-year cumulative incidence of major bleeding in high-risk and non–high-risk patients was statistically significantly different for the modified versions of the ACCP, VTE-BLEED, HAS-BLED, and OBRI scores (Figure 2).
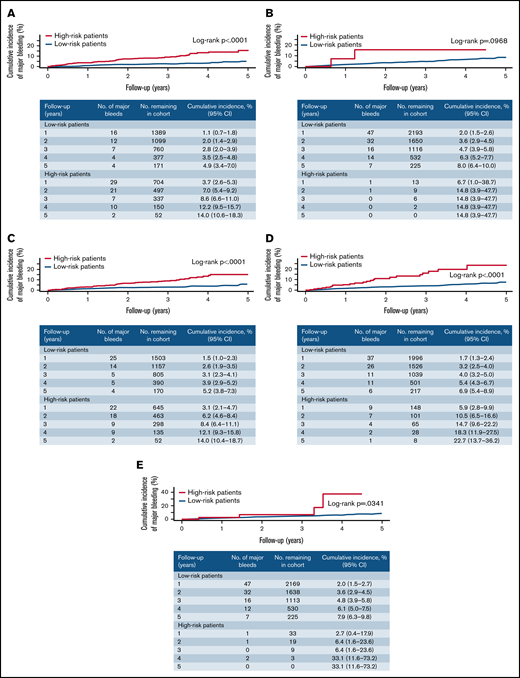
Cumulative incidence of major bleeding in patients classified as high- and non–high-risk according to existing prediction scores. (A) Modified ACCP score. (B) Modified RIETE score. (C) Modified VTE-BLEED score. (D) Modified HAS-BLED score. (E) Modified OBRI score.
Cumulative incidence of major bleeding in patients classified as high- and non–high-risk according to existing prediction scores. (A) Modified ACCP score. (B) Modified RIETE score. (C) Modified VTE-BLEED score. (D) Modified HAS-BLED score. (E) Modified OBRI score.
The C-statistics of existing scores to predict major bleeding ranged from 0.51 to 0.65 (Table 5). Estimates of major bleeding rates according to each point indicated poor to moderate calibration of existing scores (supplemental Table 6).
Subgroup analysis
Major bleeding rates in patients at high risk of bleeding vs those not at high risk did not meaningfully differ by type of anticoagulant agent and duration of anticoagulation prior to enrollment (supplemental Table 7).
Discussion
In this large prospective multicenter cohort study, we developed and internally validated a new clinical prediction model for major bleeding during extended anticoagulant therapy in patients with unprovoked or weakly provoked VTE and externally validated 5 existing bleeding risk scores. The newly derived CHAP model included creatinine, hemoglobin, age, and the use of an antiplatelet agent as predictor variables. Internal validation indicated low optimism in the apparent performance of the model and good calibration, which suggests low overfitting of the model and good agreement between predicted and observed risks of major bleeding. Of the 5 existing bleeding scores, modified versions of the ACCP, VTE-BLEED, and HAS-BLED scores accurately discriminated patients at high risk of major bleeding from those not at high risk. Importantly, whereas modified versions of the ACCP and HAS-BLED scores accurately discriminated patients with an annual major bleeding risk above and below the risk threshold of 2.5%, the modified VTE-BLEED score showed good discriminatory ability at a marginally lower threshold of 2.3%. Conversely, the RIETE and modified OBRI scores performed poorly in predicting major bleeding in our patient population, identifying only 1% to 2% of patients at high risk of major bleeding. Compared with the CHAP model, the modified versions of the ACCP, VTE-BLEED, and HAS-BLED scores had similar discriminatory power, but their calibration was only poor to moderate. In contrast to existing scores, the CHAP model uses continuous predictor variables. Whether this additional information leads to superior calibration and further improves estimation of bleeding risk needs to be evaluated in an external validation study.
Our CHAP model identified a clinically meaningful proportion (25%) of patients as being at high risk of major bleeding, and appropriately discriminated those at high risk of major bleeding from those not at high risk. The CHAP model appears to also predict bleeding-related mortality, which is of utmost importance for clinical decision-making. All predictors in our final model have been consistently identified as risk factors of bleeding in previous studies of patients receiving anticoagulant therapy, and each predictor is included in ≥3 of 7 existing bleeding risk models derived in or developed for patients with VTE.28 This similarity likely explains the comparable discriminatory power of the CHAP model and the modified versions of the ACCP, VTE-BLEED, and HAS-BLED scores. However, none of the existing models used our combination of predictors, and the CHAP model, which comprises only 4 easily available and reliably measurable predictors, is simpler than other scores. Furthermore, all existing models dichotomized continuous predictor variables. Dichotomization of predictors leads to a loss of information and power29 and could affect calibration, which was at most moderate for all existing scores in our study. Although we expect to have minimized the optimism of the CHAP model by applying rigorous methodological standards and conducting a dedicated prediction model derivation study, external validation of this model is required before its implementation in clinical practice.
Although previous prospective studies have assessed the performance of existing clinical scores in predicting anticoagulant-related major bleeding, they have been limited by small sample size,30,31 inclusion of heterogeneous populations (ie, VTE and atrial fibrillation or provoked and unprovoked VTE),32,33 inclusion of patients who had not completed 3 to 6 months of initial treatment for VTE,30,31,34 -36 focus on patients at high risk of major bleeding (eg, elderly patients),33,37 or short duration of follow-up during extended treatment (eg, ≤1 year).30,31,34 -36 As a result, these studies have yielded inconsistent and/or unreliable results about the predictive ability of available clinical scores for major bleeding.28 Findings from the present large prospective cohort study designed to identify predictors of major bleeding during extended anticoagulation not only indicate that the modified versions of the ACCP, VTE-BLEED, and HAS-BLEED scores accurately discriminate patients at high risk of major bleeding from those not at high risk, but also that the probability of a major bleeding event resulting in death appears to be much higher in patients at high risk of bleeding (range of case-fatality rates, 9%-13%) than in those not at high risk (range of case-fatality rates, 0%-4%). Hence, these scores may be predictive of major bleeding and bleeding-related mortality.
Our study has several strengths. First, we prospectively followed a large cohort of consecutive patients (N = 2516) with unprovoked or weakly provoked VTE receiving as much as 5 years of extended anticoagulation for a median follow-up duration of 2.6 years. Second, <1% of patients were lost to follow-up. Third, the study was specifically designed to derive a prediction model for major bleeding in patients with unprovoked or weakly provoked VTE receiving extended anticoagulation. Prespecified predictor variables were collected in a standardized manner after completion of ≥3 months of initial anticoagulation for acute VTE (ie, at the time the model is intended to be used to guide clinical management), which contrasts with previous prediction model derivation studies that measured predictors at the time of VTE diagnosis.12,13,15 ,, -20 Fourth, continuous variables were not dichotomized, and the CHAP model contains only readily available and reproducible predictors, which enhances power and makes the model easy to use by clinicians. Finally, major bleeding was adjudicated by a committee blinded to potential predictor data, which ensured standardized outcome assessment and minimized detection bias.
Our study also has limitations. First, even though studies suggest that many patients continue to take VKAs in the extended phase, there may be concern about applicability of our results to DOACs because only 8% of our study population received a DOAC. Calibration of the CHAP model may vary between patients receiving VKA and DOACs because DOACs are potentially associated with a lower risk of major bleeding during extended anticoagulation compared with VKAs,38 and, consequently, patients receiving DOACs who were classified at high risk of bleeding may not have an annual bleeding risk >2.5%. However, point estimates of hazard ratios for those at high bleeding risk (vs those not at high risk) and major bleeding rates in high-risk patients were similar for VKAs (3.9 major bleeding events per 100 person-years) and DOACs (4.9 major bleeding events per 100 person-years), and evidence from randomized trials does not suggest an interaction in terms of bleeding risk between type of anticoagulant and creatinine,39 hemoglobin,17 age,39,40 and antiplatelet therapy.41 Second, fatal bleeding was rare, and, consequently, estimates of case-fatality rates of major bleeding according to subgroups of predicted bleeding risk were imprecise. However, even when conservatively estimating the case-fatality rate of major bleeding in patients not at high risk of major bleeding to be equal to the upper bounds of the 95% CI of the estimates in our study, patients identified not to be at high risk of bleeding by the CHAP model or modified versions of the ACCP, VTE-BLEED, or HAS-BLED scores are likely to gain a net long-term mortality benefit from extended anticoagulation. Third, the use of the CHAP model and results of external validation of existing scores are limited to patients with unprovoked or weakly provoked VTE, and, as such, not applicable to patients with cancer-associated VTE. Although cancer is an important risk factor for bleeding, patients with cancer-associated VTE differ from those with unprovoked VTE with regard to comorbidities and comedications, and an individual approach to bleeding risk prediction and management is needed for these diverse patient populations.6,42 Fourth, to increase patient enrollment, we modified the inclusion criteria halfway through the study to allow enrollment of patients at potentially lower bleeding risk who were well beyond the 3- to 6-month period after initiation of anticoagulation. Regardless, the CHAP model and modified versions of the ACCP, VTE-BLEED, and HAS-BLED scores were equally predictive and discriminative in these patients. Fifth, we used treatment for hypertension as a proxy variable for uncontrolled hypertension, which may have led to overestimation of bleeding risk with the HAS-BLED or VTE-BLEED score. Conversely, failure to determine a history of alcohol use disorder and liver failure may have lowered the bleeding risk estimates for the HAS-BLED and ACCP scores. However, all these scores still accurately identified a high-risk patient population in our study. Sixth, we did not use an automated variable selection method, which may have resulted in omission of predictors that are statistically significantly associated with major bleeding or inclusion of predictors that are not strongly associated with major bleeding. However, all variables in the CHAP model were consistently shown to be predictors of major bleeding in previous studies, and we preferred selection of a model with few, but reliable, predictors over an extensive, purely data-driven model that may lead to an overestimated performance of the model. Finally, external validation of the CHAP model is required before its implementation in clinical practice.
In conclusion, modified versions of the ACCP, VTE-BLEED, and HAS-BLEED scores accurately identify patients with unprovoked or weakly provoked VTE who are at high risk of bleeding and should be considered for discontinuation of anticoagulation after 3 to 6 months of initial treatment. Whether the newly derived CHAP model with similar discriminative power may further improve estimation of bleeding risk by using continuous predictor variables needs to be evaluated in future studies.
Acknowledgments
This investigator-initiated study was sponsored by the Ottawa Hospital Research Institute and funded by grants from the Canadian Institutes of Health Research (MOP130388) and the Heart and Stroke Foundation of Canada. The funders had no role in the study design; in the collection, analysis, and interpretation of data; in the writing of the manuscript; or in the decision to submit the article for publication.
P.S.W., T.T., F.K., D.R.A., S.R.K., A.L.-L., M.C., G.L.G., L.A.C., C.K., S. Solymoss, S. Schulman, I.C., M.J.K., and M.A.R. are investigators of the CanVECTOR Network; the Network receives grant funding from the Canadian Institutes of Health Research (Funding Reference: CDT-142654). T.T.’s research was supported by grants from the Swiss National Science Foundation (SNSF P2ZHP3_177999) and the CanVECTOR Network. F.K. was supported by the Frederick Banting and Charles Best doctoral research scholarship from the Canadian Institutes of Health Research. S.R.K. holds a Tier 1 Canada Research Chair in Venous Thromboembolism. P.S.W., M.C., and G.L.G. all hold a Clinical Research Chair from the Department and Faculty of Medicine of the University of Ottawa. G.L.G. also holds a Clinician-scientist Award from the Heart and Stroke Foundation of Canada. L.A.C. is supported by a Tier 2 Research Chair in Thrombosis and Anticoagulation Safety from the Department and Faculty of Medicine of the University of Ottawa and a Heart and Stroke Foundation of Canada National New Investigator Award. M.A.R. is the McGill University Harry Webster Thorp Professor of Medicine.
Funding support for this article was provided by the Heart and Stroke Foundation of Canada and Canadian Institute of Health Research (CIHR).
Authorship
Contribution: P.S.W., T.T., F.K., D.R.A., S.R.K., C.K., M.A.R., and M.J.K. conceived and designed the study; P.S.W., D.R.A., S.R.K., A.L.-L., M.C., G.L.G., V.S., S.K., C.K., S. Solymoss, R.Z., S. Schulman, I.C., M.A.R., and M.J.K. provided study materials or patients; R.M. analyzed data; P.S.W., T.T., and F.K. drafted the article; and all authors critically revised the article for important intellectual content and approved the final version.
P.S.W. and R.M. are the guarantors of this work and, as such, had full access to all the data in the study and take responsibility for the integrity of the data and the accuracy of the data analysis. The corresponding author attests that all listed authors meet authorship criteria and that no others meeting the criteria have been omitted.
Conflict-of-interest disclosure: PW reports receiving honoraria for advisory board meetings from Bayer Healthcare, Sanofi, and Daiichi Sankyo, and Research Funding from BMS/Pfizer. LC has received honoraria from Amag Pharmaceuticals, Bayer Healthcare, BMS-Pfizer Alliance, The Academy, LEO Pharma, Sanofi, Servier, and Valeo. All payments were made to her institution. MC has received research funding from Leo Pharma, BMS, and Pfizer, and honoraria from Bayer, Sanofi, Servier, BMS, Pfizer, and LEO Pharma. All payments were made to his institution. GLG reports support from Portola Pharmaceuticals, Boehringer Ingelheim, Pfizer BMS, LEO Pharma, Daiichi Sankyo, Bayer, Sanofi, and bioMerieux. All payments were made to his institution. S.K. received a grant to develop educational materials from Alexion. S. Schulman has received research grant from Octapharma and honoraria for work in study committees from Daiichi-Sankyo, Boehringer Ingelheim, Bayer, and Sanofi, and for lectures from Servier and Bristol Myers Squibb. The remaining authors declare no competing financial interests.
Correspondence: Philip S. Wells, Department of Medicine, Ottawa Hospital Research Institute, The Ottawa Hospital, 501 Smyth Rd, PO Box 206, Ottawa, ON K1H 8L6, Canada; e-mail: pwells@toh.ca.

