

Key Points
We identified unique blood group variants among the healthy older Australian population compared with global data using RBCeq software.
Our detailed blood group profiling result may be a starting point for the creation of an Australian blood group variant database.

Abstract
There have been no comprehensive studies of a full range of blood group polymorphisms within the Australian population. This problem is compounded by the absence of any databases carrying genomic information on chronically transfused patients and low frequency blood group antigens in Australia. Here, we use RBCeq, a web server–based blood group genotyping software, to identify unique blood group variants among Australians and compare the variation detected vs global data. Whole-genome sequencing data were analyzed for 2796 healthy older Australians from the Medical Genome Reference Bank and compared with data from 1000 Genomes phase 3 (1KGP3) databases comprising 661 African, 347 American, 503 European, 504 East Asian, and 489 South Asian participants. There were 661 rare variants detected in this Australian sample population, including 9 variants that had clinical associations. Notably, we identified 80 variants that were computationally predicted to be novel and deleterious. No clinically significant rare or novel variants were found associated with the genetically complex ABO blood group system. For the Rh blood group system, 2 novel and 15 rare variants were found. Our detailed blood group profiling results provide a starting point for the creation of an Australian blood group variant database.
Introduction
Modern transfusion medicine has highlighted the geographical and ethnic variability in blood group allele and genotype frequencies. There is tremendous complexity and heterogeneity among red blood cell (RBC) group systems. The International Society of Blood Transfusion (ISBT) recognizes 43 blood group systems involving 48 genes, which encode over 360 red cell antigen phenotypes and are defined by more than 1500 alleles. In addition, 2 transcription factors also play a role in altering or silencing blood group expression.1-4 Blood group genes encode multiple structurally and functionally distinct molecules and exhibit varying degrees of polymorphic complexity (insertions/deletions, single-nucleotide variants, copy number variations, and structural variants) within the population.5,6 Misidentification of any of these variants may contribute toward alloimmunization of individuals requiring RBC transfusion support, which introduces a risk of adverse events such as hemolytic transfusion reactions (HTRs), hemolytic disease of the fetus and newborn (HDFN), pregnancy complications, or more subtle allergic reactions of clinical significance.7
Routinely in Australia, the Australian New Zealand Society of Blood Transfusion guidelines for Transfusion and Immunohematology Laboratory Practice advise selection of ABO and RhD matched red cell products to reduce risk in transfusions.8-10 The RH (eg, D, C/c, E/e) and MNS (eg, M/N, S/s, U) blood group antigens are encoded by multiple complex alleles. Genetic variations and gene rearrangements between RHD/RHCE and GYPA/GYPB/GYPE with distinct population-specific distributions. For example, the D− blood type prevalence varies between population groups of Caucasian (15%),11 African (8%), and Asian (<0.1%)12 ancestries. The variations in blood group antigen expression may also increase or decrease host susceptibility to infections in some diseases. One example of this, is the glycoprotein that carries the antigens of the Duffy blood group system (FY) – called atypical chemokine receptor 1 (ACKR1). ACKR1 acts as a receptor for two species of malaria; Plasmodium vivax and Plasmodium knowlesi. The absence of ACKR1 on the RBC surface is commonly due to homozygosity of the FY*02N.01 erythroid-silencing allele and a c.-67T>C change in the promoter region of the ACKR1 gene. This is common among African and African-Americans and is associated with resistance to malaria infection.13,14 Variations in ACKR1 are also associated with a survival advantage in leukopenic HIV patients.15 The recessive African-specific ACKR1 null allele increases the risk of HIV-1 infection.14 In the ABO blood group system, individuals with group O blood are more prone to vaso-occlusive crises associated with sickle cell disease (SCD).16 However, the sickle hemoglobin of SCD combined with the O- blood group also confers some resistance to Plasmodium falciparum infection.17 Additionally, group O blood has also been found to confer resistance toward developing cardiovascular disease and/or type-2 diabetes.18 Thus, the identification and analysis of blood group polymorphisms within a population is of critical importance.19
Blood group typing by traditional serological, molecular, or SNP microarray methods have limited functionality in characterizing blood group antigens that are rare, have weak expression, or recombinant, and are partial or novel.20 There is mounting evidence that clinically significant rare antigens and novel variants confound conventional serologic typing and SNP approaches.21 To achieve extended RBC typing, a more comprehensive approach would be to apply next-generation sequencing (NGS) to overcome the limitations of serological and SNP-based molecular techniques.22-26 NGS approaches including targeted exome sequencing, whole-exome sequencing, and whole-genome sequencing (WGS) have the potential to provide a new basis of pretransfusion testing by facilitating the accurate characterization of an individual’s complete blood group profile, supporting precision-based medicine.27,28 Curated and detailed DNA-phenotype annotated databases storing blood group allele and antigen data have been developed and maintained by the ISBT, providing a vital resource to support blood type calling from genetic data.
Accurate prediction of blood group phenotypes based on NGS data requires immuno-genetic knowledge as multiple genotypes can lead to the same phenotype (eg, ABO, MNS, and LE systems). Additionally, not all blood group antigens are direct products of primary genes like the ABO, LE, and H systems.27 Even though various tools/algorithms have been developed applying statistical and machine learning approaches to process NGS data,29,30 there is no single tool that provides complete and comprehensive automation of blood group characterization in a user-friendly manner. Only 2 tools are available to date, BOOGIE31 and BloodTyper,27 neither of which has the potential to identify novel blood group variants. To overcome this limitation, we developed a comprehensive and secure bioinformatics platform called RBCeq. RBCeq (https://www.rbceq.org/) is a web server–based blood group–genotyping software.32 It is able to provide fast and accurate extended mass screening of blood groups from diverse populations with distinctive and complex blood group profiles.
Blood group antigen profiles are well characterized for European, North American, and some East Asian populations, but no extensive study has been carried out to date on the blood group antigen profile of the Australian population. Australia constitutes a highly heterogeneous multicultural and multiethnic population.33,34 The patient population in Australia is more diverse than blood donors. Currently, there is a greater need for patients with rare blood types in Caucasian populations.35 Most donors are Caucasian; previous studies have indicated that immigrants and ethnic minorities are less involved in blood donation.35 One such example is the current need for Jk(a–b–) blood for patients in Australia.36 To date, there has not been any study on the blood group polymorphisms within the Caucasian Australian population as a whole. The problem is compounded by the absence of rare blood group antigen reports on a large number of Australian individuals.
However, recently, the Medical Genome Reference Bank was released, comprising WGS data of 4000 healthy elderly Australians mostly of European descent.37,38 These individuals are participants of the Aspirin in Reducing Events in the Elderly (ASPREE) study, initiated to investigate whether the daily use of aspirin would prolong the healthy life span of older adults. This is the largest ongoing study of healthy aging in the Southern Hemisphere.39 In this study, we use WGS data from the Medical Genome Reference Bank ASPREE participants to identify unique blood group variants among a healthy older Australian general population and compared this with global data. To the best of our knowledge, this is the first study using WGS data for identifying the prevalence of blood group polymorphisms within a large Australian population dataset compared with global trends. Results of this study will reveal frequencies of blood groups among the blood donor population, and reveal where the gaps exist in servicing the rare blood type needs of an increasingly diverse Australian patient population. This study will also provide proof of concept of the utility of RBCeq to analyze WGS data to facilitate accurate and higher-resolution RBC typing, with important implications for the future of transfusion precision–based medicine by facilitating antigen-matched blood for transfusions.
Methods
Study design
The design of this study included multiple interrelated components (Figure 1). We collated 2796 WGS data from the ASPREE study and 2504 from the 1KGP3 phase 3 (1KGP3) databases. Descriptions of the database ASPREE38 and 1KGP340 are included in supplemental Table 1. The genomic variant call file and BAM files were used to predict genotype and phenotype using RBCeq. We collated 96709 high-quality coding variants from genomes of ASPREE participants. Allele frequencies and clinical relevance of the variant were obtained using ANNOVAR41 (gnomAD genome collection [v2.1.1]). Additionally, sequencing coverage and sequence identity of the blood group genes were extracted from the alignment files using BAMSTAT42 and Integrative Genomics Viewer,43 respectively.
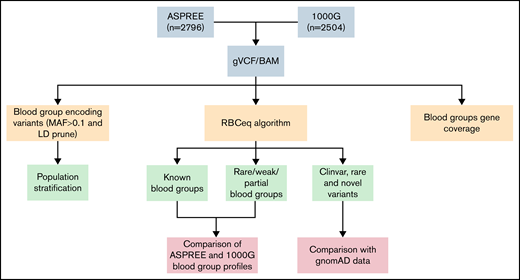
An overview of workflow to comprehensively characterize population-specific blood group variants and phenotypes. The population stratification was performed using plink. Blood group profiling using RBCeq, and blood group gene coverage calculation using BAMstat and bedtools.
An overview of workflow to comprehensively characterize population-specific blood group variants and phenotypes. The population stratification was performed using plink. Blood group profiling using RBCeq, and blood group gene coverage calculation using BAMstat and bedtools.
To evaluate the distinction between the ASPREE dataset and other global populations, we merged 789 linkage disequilibrium pruned coding variants of the ASPREE and 1KGP3 datasets, all of which had minor allele frequencies ≥0.1. We then used PLINK v1.944 to generate a principal component analysis (PCA) plot from the resultant merged data and plotted using ggplot245 (Figure 2). Next, we created a Circos plot containing variant frequencies and the gene annotation using R libraries circlize,46 tidyverse,47 dplyr,48 ComplexHeatmap,49 and stringr47 (Figure 3). The prediction of RHD zygosity and the presence of C/c antigen was detected by RBCeq using the RH blood group gene coverage plot. Initially, all sample RH genes coverage were calculated using BedTools,50 with a bin size of 1. The coverage data were then smoothed and downscaled by averaging every 300 bases. The smoothed data were plotted using R libraries.
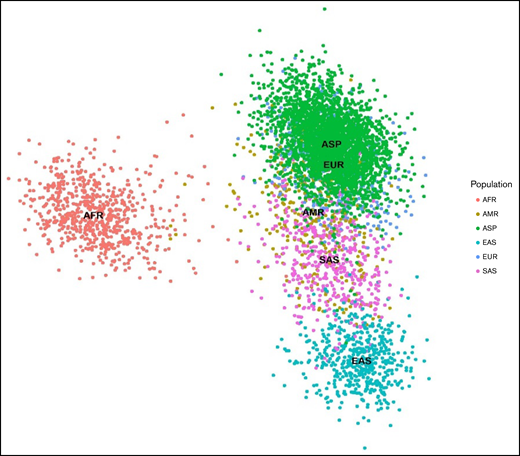
PCA plots showing 789 (minor allele frequencies ≥0.1 and linkage disequilibrium prune) markers in 5300 individuals from the ASPREE and 1KGP3 datasets.The X-axis denotes the value of PC1, whereas the Y-axis denotes the value of PC2, with each dot in the figure representing 1 individual. The first 2 principal components shown here account for ∼80% of the observed variance in the combined dataset. AFR, African; AMR, American; EAS, East Asian; EUR, European; SAS, South Asian.
PCA plots showing 789 (minor allele frequencies ≥0.1 and linkage disequilibrium prune) markers in 5300 individuals from the ASPREE and 1KGP3 datasets.The X-axis denotes the value of PC1, whereas the Y-axis denotes the value of PC2, with each dot in the figure representing 1 individual. The first 2 principal components shown here account for ∼80% of the observed variance in the combined dataset. AFR, African; AMR, American; EAS, East Asian; EUR, European; SAS, South Asian.
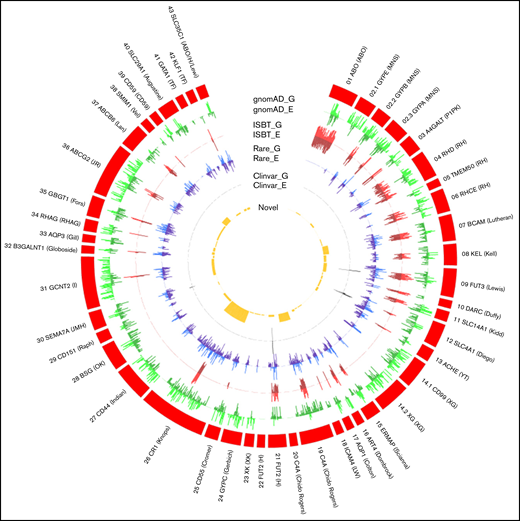
The distribution of gnomAD (genome and exome) datasets, genetic variants, and their frequency in RBC antigen-encoding genes. The outer ring (red) represents the RBC antigen-encoding genes, box length represents the number of variants observed, G denotes gnomAD genome frequency, and E denotes gnomAD exome frequency. The outer green (light/dark) circle indicates the distribution of variants frequency across different blood group genes from the gnomAD data. The red (light/dark) circle indicates the number of variants with ISBT associations relative to all gnomAD variants. The blue (light/dark) circle indicates the distribution of rare non-ISBT variants in all 6 populations. The dark gray circle indicates the number of non-ISBT variants annotated to the ClinVar database. The yellow circle shows the distribution of the number of novel variants.
The distribution of gnomAD (genome and exome) datasets, genetic variants, and their frequency in RBC antigen-encoding genes. The outer ring (red) represents the RBC antigen-encoding genes, box length represents the number of variants observed, G denotes gnomAD genome frequency, and E denotes gnomAD exome frequency. The outer green (light/dark) circle indicates the distribution of variants frequency across different blood group genes from the gnomAD data. The red (light/dark) circle indicates the number of variants with ISBT associations relative to all gnomAD variants. The blue (light/dark) circle indicates the distribution of rare non-ISBT variants in all 6 populations. The dark gray circle indicates the number of non-ISBT variants annotated to the ClinVar database. The yellow circle shows the distribution of the number of novel variants.
The study was approved by the Alfred Hospital Research Ethics Committee. Participants provided biospecimens and written informed consent for genetic analysis.
Genotyping using RBCeq32
The RBCeq algorithm determined the genotype and predicted phenotype of the ASPREE and 1KGP3 cohort individuals (https://www.rbceq.org/). RBCeq predicts blood group profiles based on both single-nucleotide variants and copy number variation data. The genomic variant call file of each sample was used as input along with the blood group gene coverage calculated using BAMTrimmer (https://github.com/MayurDivate/BamTrimmer). RBCeq generates predicted known blood group profiles for 36 blood group systems and 2 transcription factors and identifies ClinVar,51 Rare (≤0.05 in gnomAD dataset52 ), and potential deleterious novel variants. RBCeq uses 6 independent in silico tools (SIFT: D; Polyphen2: D/P; MutationTaster2: D; FATHMM: D; PROVEAN: D; CADD: >50) and reports variants that are considered damaging (D) by these tools.
Results
The blood group gene variant landscape in healthy aging Australians
The PCA plot revealed blood group genetics of the ASPREE and European cohort of the 1KGP3 datasets are similar and exhibit a unique genomic identity distinct from other global population groups. The nearest correlation to ASPREE and European blood group genetics was found in the American population. Clear differentiation between the African, East Asian, and South East Asian data were observed (Figure 2).
Distribution of rare phenotypes that lack high-prevalence antigens
Patients with null phenotypes against high prevalence antigens are at risk of alloimmunization if transfused. In the ASPREE dataset, 3 distinct rare blood group phenotypes lacking a high incidence of antigens were identified. The rare Colton Co(a−b+) phenotype was observed in 0.21% of ASPREE participants. The rare Vel− blood type was found only among the ASPREE participants (0.04%).53 In the YT system, the Yt(a−b+) phenotype was present in 0.14% of ASPREE, 0.20% of European, and 0.20% of South Asian participants. Transfusion of alloimmunized Co(a−) and Vel−, and in some cases Yt(a−) individuals, would require negative antigen blood to avoid HTR.
Distribution of weak, partial, and null antigens
Analysis of the distribution of the weak, partial, and null antigens among the representative populations from the 2 databases showed a 93.34% distribution of the Duffy null phenotype Fy(a−b−) among African participants, which was higher than that reported in previous studies (68%-70%) (Table 1). Apart from African populations, Duffy null was observed solely in the American population (African American) of the IKGP3 dataset. The Duffy null phenotype was not observed in other population groups, conforming with earlier reports.11,54 We report for the first time the distribution of a rare weak secretor H+W type (FUT2*01W.02.01) in a Caucasian population, which was found among the ASPREE (0.07%, n = 2) and East Asian (19.05%, n = 96) populations and was not represented in the European dataset. We also found a very low percentage of the rare Js(a+) (KEL:6,−7) antigen (0.15%) among the 1KGP3 African population, which is less than the previously reported frequency in the African populations of 19% and Caucasians <1%.55 The rare LU:−13 phenotype was found among the ASPREE participants (0.21%), previously reported only among European populations (0.40%).
Comparing weak, partial, and null blood group antigens’ distribution in the ASPREE and 1KGP3 datasets
| Blood group system | Phenotype | RBCeq prediction | |||||
|---|---|---|---|---|---|---|---|
| ASPREE (n = 2796) | AFR (n = 661) | AMR (n = 347) | EUR (n = 503) | EAS (n = 504) | SAS (n = 489) | ||
| LU | LU:-13 | 0.21 | — | — | 0.40 | — | — |
| H | H+W (saliva) | 0.07 | — | — | — | 19.05 | — |
| FY | Fy(a−b−)* | — | 93.34 | 1.73 | — | — | — |
| KEL | KEL:6,−7 | — | 0.15 | — | — | — | — |
| JK | Jk(a+W) | 0.54 | 4.39 | 4.74 | 1.19 | 16.47 | 8.38 |
| JR | Jr(a+W) | 1.43 | — | 1.73 | 1.19 | 7.94 | 0.61 |
| ABO | A3 | — | 0.15 | — | — | — | — |
| ABO | B3 | 1.65 | 0.15 | — | — | — | — |
AFR, African; AMR, American; EAS, East Asian; EUR, European; SAS, South Asian.
Only for erythroid cells.
Not a single individual with a very rare Jk(a−b−) phenotype was found among all 6 populations studied, which is most frequently observed in Polynesian populations (Table 1). The Jk(a+wb−) phenotype, which causes weak or partial expression of the Jka antigen, was represented at frequencies 0.54% (ASPREE), 4.39% (African), 4.74% (American), 1.19% (European), 16.47% (East Asians), and 8.38% (South Asian) within the 6 population datasets. We found the highest prevalence of the Jr(a+W) phenotype among East Asian populations (7.9%), whereas the African participants completely lacked the phenotype. Similar prevalence of Jr(a+W) phenotype was observed among the other populations in our study (ASPREE [1.4%], European [1.2%], South Asian [0.6%]).11 The A3 (0.15%) subtype was only observed in the African population, whereas the B3 phenotype was observed in both ASPREE (1.65%) and African (0.15%) populations.
Prevalence of RHD/RHCE blood group phenotypes
We compared the frequency of Rh blood group phenotypes frequencies in the ASPREE and 1KGP3 datasets with previously reported data (Table 2). We analyzed the RHD gene percentage with respect to homozygous and null expression within the 6 populations. Our results indicated that 99.8% of East Asian, 96.52% of African, 93.95% of American, and 94.48% of South Asian participants were homozygous for the RHD gene. Previous reports state ∼85% of the Caucasian population is D+, and RBCeq analysis predicts a frequency of 83.9% in the European population, consistent with earlier reports (supplemental Figure 1). In the 474 (16.92%) D− samples, 473 were due to deletion of the RHD gene, and 1 sample was homozygous for the RHD*01N.20 allele. This is possibly the first to report for partial RHD phenotype DIII type 4 and DUC2 in Australian Caucasian cohorts. In the ASPREE dataset, 2 hemizygous calls for DIII type 4 and 2 homozygous calls for DUC2 were observed. These phenotypes have been observed in the African and American populations. These 2 partial D types are rarely observed in Caucasians (0.1% European Americans), the same rarity we observed in other 1KGP3 populations.
RHD/RHCE blood group phenotype frequency prevalence in ASPREE and 1KGP3 samples compared with previously reported data
| Blood group gene | Predicted phenotype | RBCeq prediction | Previously published53 | |||||||
|---|---|---|---|---|---|---|---|---|---|---|
| ASPREE (n = 2796) | AFR (n = 661) | AMR (n = 347) | EUR (n = 503) | EAS (n = 504) | SAS (n = 489) | Caucasians | Africans | Asian | ||
| RHD | DD | 83.09 | 96.52 | 93.95 | 83.9 | 99.8 | 94.48 | 85.00 | 92.00 | 99.00 |
| RHD | D− | 16.92 | 3.48 | 6.05 | 16.10 | 0.20 | 5.52 | 15.00 | 8.00 | 1.00 |
| RHD | DIII type 4 | 0.07 (Two heterozygous call) | 2.87 (Four homozygous and 15 heterozygous) | — | — | — | — | — | — | — |
| RHD | DUC2 | 0.07 | — | 0.30 (Two heterozygous call) | — | — | — | — | — | — |
| RHCE | C+ | 61.87 | 53.10 | 80.11 | 71.57 | 95.833 | 88.13 | 68 | 27 | 93 |
| RHCE | c+ | 81.93 | 98.48 | 74.63 | 79.52 | 45.43 | 55.01 | 80 | 96 | 47 |
| RHCE | E ce | 25.04 | 13.16 | 10.09 | 24.25 | 1.19 | 9.41 | 10.00 | 4.00 | 30.00 |
| RHCE | C E c e | 26.18 | 17.39 | 47.83 | 28.43 | 62.10 | 22.90 | 10.00 | NA | NA |
| RHCE | C partial c Partial e | — | 0.61 | — | — | — | — | NA | NA | NA |
| RHCE | C partial ec | — | 0.90 | — | — | — | — | NA | NA | NA |
| RHCE | Cw partial C e MAR− | — | — | — | 0.20 | — | — | NA | 19.00 | 3.00 |
| RHCE | Partial c Partial e | — | 4.68 | — | — | — | — | NA | NA | NA |
| RHCE | Partial e c | — | 6.80 | — | — | — | — | NA | NA | NA |
AFR, African; AMR, American; EAS, East Asian; EUR, European; NA, the population-level frequency was not available in the literature; SAS, South Asian.
The RHCe/CE alleles encoding the RhC antigen consist of 7 nucleotides (c.48C, c.150T, c.178A, c.201G, c.203G, c.307T, and c.676G/C), 5 of which are located in exon 2.11 The RhC antigen also occurs when exon 2 of the RHCE gene is replaced by exon 2 of RHD. This genetic recombination event between the 2 genes and consequential sequence identity impacts on sequence alignment to the human reference genome with increased reads aligning to exon 2 of RHD instead of aligning to exon 2 of RHCE (supplemental Figure 2). The RBCeq algorithm also utilizes the sequence in intron 2 of RHCE associated with the 109bp insertion unique to RHCe to predict the presence or absence of Ce or CE based on the zygosity of the allele at this position (1:25732087G>A).56 Our data for C/c antigen distribution are similar to earlier reports, except for the African participant. Our predictions showed the prevalence of C antigen among the African participants was twofold higher than the previous report. We found the prevalence of the Ece and CEce phenotypes was twofold higher in the ASPREE and European populations when compared with previous data.57 We also detected partial c and e phenotypes in the 1KGP3 dataset only in the African population. Two samples from the European population exhibited the RHCE*02.08.01 allele at a homozygous level, which encodes low prevalence antigen Cw, a partial RhC and MAR null phenotype.
Homozygosity for the RHCE*02.08.01allele is clinically significant. Alloimmunization to the MAR antigen in pregnancy introduces the risk of HDFN affecting the fetus, and a rare blood requirement for the mother in the pre- and postnatal period if transfusion is indicated. HDFN due to anti-MAR has been reported more frequently in the polish population and there is a subsequent demand for MAR− donor blood in Poland.53 The frequency of RHCE*02.08.01 allele phenotype has not been previously reported in a large-scale study.
Comprehensive analysis of MNS phenotype
Table 3 shows the frequency of phenotype M+N−S+s− and M+N+S+s− in different ethnic background data (EAS/SAS/EUR/AMR). The frequency of M+N−S+s+, M+N+S−s+, and M+N+S+s+ was previously reported for Caucasian and African populations. Here we observed a two fold lower prevalence of all 3 of the latter MNSs phenotypes in European participants compared with earlier reports (4.97% vs 14.0%, 7.75% vs 22.0%, and 12.92% vs 24.0%, respectively). Conversely, the prevalence of M−N+S+s+ phenotype was found to be fivefold higher in the European participants (30.02%) in our study compared with previous data (6.0%). We found the prevalence of all 4 MNS phenotypes in the ASPREE participants to be similar to those reported for Caucasian populations earlier.
Comparison of MNS blood group phenotypes and frequencies observed in the ASPREE and 1KGP3 datasets
| Blood group | Phenotype | RBCeq prediction | Previously published53 | |||||||
|---|---|---|---|---|---|---|---|---|---|---|
| ASPREE (n = 2796) | AFR (n = 661) | AMR (n = 347) | EUR (n = 503) | EAS (n = 504) | SAS (n = 489) | Caucasians | Africans | Asian | ||
| MNS | M+N−S+s− | 5.90 | 0.15 | 2.31 | 1.79 | — | 2.25 | 6 | 2 | NA |
| MNS | M+N+S+s− | 3.11 | 0.45 | 4.32 | 3.38 | — | 4.50 | 4 | 2 | NA |
| MNS | M+N−S+s+ | 14.70 | 1.21 | 8.07 | 4.97 | 1.19 | 5.11 | 14.00 | 7.00 | NA |
| MNS | M+N+S+s+ | 23.86 | 4.54 | 13.26 | 12.92 | 1.98 | 11.45 | 24.00 | 13.00 | NA |
| MNS | M+N+S−s+ | 23.39 | 10.89 | 6.63 | 7.75 | 18.06 | 12.07 | 22.00 | 33.00 | NA |
| MNS | M−N+S+s+ | 5.04 | 20.12 | 22.19 | 30.02 | 3.57 | 25.15 | 6.00 | 5.00 | NA |
AFR, African; AMR, American; EAS, East Asian; EUR, European; NA, the population-level frequency was not available in the literature; SAS, South Asian.
Investigation of potential novel and clinically significant blood group variants among healthy ageing Australians
We characterized variants within the ASPREE population dataset that have not previously been reported to be associated with blood group alleles but have the potential to affect the formation of antigenic structures (Figure 3). We detected 9 variants that had clinical associations (supplemental Table 2). There were 661 rare variants with frequencies of ≤0.05 (gnomAD) among the ASPREE dataset (supplemental Table 3). Notably, we identified 80 novel variants that were computationally predicted to be deleterious (Figure 3; supplemental Table 4). Predictably, no clinically significant, rare, and novel variants were found to be associated with the genetically complex and most studied ABO blood group system, and only 2 novel and 15 rare variants were associated with the RH blood group system, which is also among the most studied blood group systems.
Discussion
In this study, we compared the blood group genotype profile of Australian participants from the ASPREE study with African, American, Asian, and European population data from the 1KGP3 and gnomAD databases. The population stratification analysis revealed the genetic makeup of the ASPREE and European participants is distinct from the other populations, likely because many ASPREE participants are of European descent (Figure 2). We also observed a clear differentiation between the African participants and other populations.
We analyzed the distribution of rare phenotypes among the 6 population datasets (Table 4). The Co(a−b+) phenotype is extremely rare, and we found this predicted phenotype among the ASPREE dataset at a frequency of 0.21% (n = 6), consistent with frequencies reported in Europe. Previously, 7 separate studies on 13 460 donors from Northern Europe and North America showed 91.3% prevalence of Co(a+b−) and 8.5% prevalence of Co(a+b+) and only 0.2% prevalence of Co(a−b+).53 A study on 1706 African Americans showed a 100% prevalence of the Co(a+) phenotype.53
The frequency of rare phenotypes identified in ASPREE data compared with the 1KGP3 dataset
| Blood group system | Phenotype | RBCeq prediction (%) | |||||
|---|---|---|---|---|---|---|---|
| ASPREE (n = 2796) | AFR (n = 661) | AMR (n = 347) | EUR (n = 503) | EAS (n = 504) | SAS (n = 489) | ||
| CO | Co(a−b+) | 0.21 | — | — | — | — | — |
| YT | Yt(a−b+) | 0.14 | — | — | 0.20 | — | 0.20 |
| VEL | Vel− | 0.04 | — | — | — | — | — |
AFR, African; AMR, American; EAS, East Asian; EUR, European; SAS, South Asian.
The ASPREE participants also expressed the rare Vel− phenotype; anti-Vel is known to be associated with acute hemolytic transfusion reactions via complement activation. Vel is a high-frequency antigen inherited as an autosomal recessive trait that shows variable strength, ranging from strong to weak.23,24 Vel− individuals can develop anti-Vel antibodies after transfusion or pregnancy and may develop acute HTRs if transfused with Vel+ blood.23,24 Previous studies have demonstrated a need for antigen-negative blood for transfusion to facilitate safe transfusion outcomes. A glimpse into the rare blood requirement needs of the Australian aging population upon analysis of the ASPREE dataset has verified the need to screen the population for Vel, to identify Vel− blood donors, and to add to the national frozen blood bank and support international rare blood donor registries to fulfill future demands. We also found the low prevalence ABO alleles A3 and B3 only among the African (A3:0.15%, B3:0.15%) and ASPREE (B3:1.65%) participants. The B3 prediction of ASPREE is with B genotype possibilities; further serology work would be required to confirm that genotype reflects phenotype. Earlier studies have indicated that distinct ABO variants are associated with different populations.58
It is important to type patients and blood donors in a pretransfusion setting for clinically significant RBC antigens to ensure blood components are matched appropriately for transfusion, to prevent transfusion related adverse events, and to reduce alloimmunization21 RBCeq identified clinically significant rare and weak blood group variants from sequence data among the 6 populations (Table 1). The RBCeq prediction showed a significantly higher (93.34%) prevalence of the Duffy null Fy(a−b−) phenotype in the African dataset compared with earlier reports (68%-70%).11 The observed Fy(a−b−) phenotype was predicted from genotype FY*02N.01/FY*02N.01 by RBCeq. The observed weak secretor phenotypes (H+W) among the ASPREE (0.07%) and East Asian (19.05%) participants have a greater frequency in the Chinese population than the normal H (Bombay) has been reported.11,59 Our results showed a very low percentage of the extremely rare Js(a+) (KEL:6,−7) antigen only among the African dataset (0.15%), which is consistent with previous studies.11
We also identified the extremely rare LU:-13 phenotype among the ASPREE participants (0.21%), which has only been observed previously among European populations. The Lutheran blood group system comprises 20 antigens defined by largely clinically benign antibodies. However, no specific data are available on adverse events related to the transfusion of LU:13 blood to patients with anti-Lu13, due to the extreme rarity of the antibody. Therefore, it is recommended to transfuse Lu(a−b−) blood and undertake family studies when anti-Lu13 is identified in an individual to identify potential donors who lack LU:13.11
We did not find any evidence of the Jk(a−b−) phenotype among the 6 populations studied, it has been previously reported at an increased prevalence of 0.9% in Polynesian population. Australian Red Cross Lifeblood has appealed for blood donors of Polynesian heritage to donate in an attempt to identify more Jk(a−b−) donors, to meet the growing demand of blood with this phenotype. The weak or partial expression, Jk(a+w) antigen was observed in all 6 populations, with the highest prevalence seen among the East Asian participants. The Jk(a+w) phenotype can be a basis of discordance between serological and molecular methods. A phenotype with weakened Jka expression may constitute a risk for HTRs if antigen-positive units are not identified during pretransfusion/donation serology tests.
Anti-Jra has been reported to cause fatal cases of HDN and delayed HTRs.60,61 We found the highest prevalence of the Jr(a+W) phenotype among the East Asian (7.9%) populations, whereas the African population completely lacked the phenotype. Similar prevalence of prediction of the Jra antigen was observed among the other populations in our study.
Fetal anemia is one of the most serious consequences of paternal blood group incompatibility with the mother. The most clinically significant antibodies involved in HDFN are against the RhD antigen; other minor Rh antigens (C, E, c,e); and Kell antigens Alloantibodies against other blood group systems (eg, Duffy, Kidd, M, and S) rarely cause significant problems. Howeverit is a requirement9 to test and monitor pregnant women throughout their pregnancy for the development of these antibodies as some have been implicated in causing mild to severe HDN.62 For anti-D, anti-K, and anti-c, there is a >50% risk of mild to severe HDFN developing if the fetus inherits the target paternal red cell antigen. We analyzed the percentage of RHD gene haplotypes in all 6 populations (Table 2). Our results indicated the majority (99.8%) of the East Asian participants and most of the African (96.52%), American (93.95%) and South Asian (94.48%) participants were homozygous for the RHD gene. However, the European (83.9%) and ASPREE (83.09%) participants had lower homozygous RHD gene frequencies. Genetic variants that result in weakened or partial antigen expression are problematic in transfusion medicine and are difficult to differentiate with serological testing alone. We also identified rare partial RhD phenotypes DUC2 (0.07%) and DIII type 4 (0.07%), which are rarely observed in Caucasians (∼0.1% European Americans). Partial D proteins lack certain D epitopes, which need to be unequivocally characterized by test methods in order to guide the selection of blood for transfusion and guide antenatal care to prevent D alloimmunization. If the D status is not elucidated, transfusion of these individuals with D+ blood (all D epitopes present) or not administering antenatal anti-D prophylaxis during pregnancy introduces an anti-D alloimmunization risk to the epitopes they lack.27,63 Additionally, it is important to differentiate weak D types 1, 2, and 3 from weak D/partial D types in pregnant women to provide adequate antenatal care.27,64
RBCeq predictions for the RhC-antigen prevalence among the 6 population datasets followed similar patterns to earlier studies for the predominantly American, South Asian, and East Asian (Table 2). However, C-antigen prevalence in our predictions for the African was significantly higher than previously reported values.65 In our study, the ASPREE and European participants had a twofold higher prevalence of C−E+c+e+ and C+E+c+e+ compared with previous reports for Caucasian populations. The points of contrast presented for the blood group profiles of the ASPREE and African cohort are of potential clinical significance. The RHCE prevalence difference could be due to the limitations to differentiate sequence homology using short-read sequencing data. But the prediction by RBCeq was examined using the RHCE gene coverage plot (supplemental Figure 2). We also found 2 examples of the rare Cw, partial C, and MAR null phenotype within the European population never reported before using genomics data. To the best of our knowledge, this is the first study describing the frequency of M+N−S+s− and M+N+S+s− in different ethnic backgrounds using genomic data (Table 3). We found the prevalence of all MNS phenotypes among the ASPREE participants to be similar to those reported earlier for the Caucasian population.
The prevalence of blood group antigen variants based on exon and splice-site variants were compared with global population groups (Figure 3). The results reflected a high level of conservation in the majority of blood group systems. We detected 9 variants that had pathogenic clinical associations (supplemental Table 2). We also detected 661 rare variants (238 with greater than twofold difference from the gnomAD exome) with minimum allele frequencies of ≤.05 in any of the 5 populations (supplemental Table 3). Most importantly, we identified 80 variants that were computationally predicted to be novel and deleterious (supplemental Table 4). Further studies are warranted to confirm the nature and conformation of these proteins predicted by RBCeq. Predictably, no clinically significant, rare, and novel variants were found to be associated with the most studied genetically complex ABO blood group system, and only 1, 2, and 15 rare variants were associated with the RH blood group system. This observation is expected from these 2 most commonly studied systems.
Although this is possibly the first comprehensive multiethnic comparative study where genetic data from 6 different populations were compared, certain limitations need to be acknowledged. The ASPREE dataset, though heterogeneous, predominantly included participants of European descent with Caucasian population values. The dataset also did not include subsequent investigation of the structural changes in RH and MNS hybrids. Serological testing and exon level detections were not performed and are out of the scope of this study. Further investigations are planned to back up the RBCeq phenotype predictions. However, despite the limitations, our results are providing new insights into blood group genetics and antigen frequency.
The frequency of inherited disorders like SCD and thalassemia is increasing in Australia due to increased migration between the populations.66 RH variants are more frequent in the African population. Matching for RH variants is dependent on the ethnicity of blood donors and the application of molecular methods to characterize RH variants within a donor database. These are examples of the significant differences between Australia’s blood donors, who are mostly Caucasian, and African SCD transfusion recipients.66 Additionally, α-Thalassemia has been identified in Australian patients in Aboriginal and Torres Strait Islander communities in the Northern Territory and northern Western Australia.67 Rare blood group identification will improve rare blood unit management. Because language and culture are very diverse in Australian communities, additional research is needed to guide transfusion practice and improve transfusion outcomes in Australia.
Authorship
Contribution: S.J. contributed to conceptualizations, resources, data curation, software, formal analysis, and writing; S.L. contributed to data visualization; C.D. contributed to data curation, validation, writing and review, and editing; E.V.R. contributed to data curation, validation, writing and review, and editing; P.L. contributed to data curation and project administration; M.R. contributed to data curation and project administration; J.J.M. contributed to data curation and project administration; D.M.T. contributed to conceptualization, supervision, and project administration; N.M.P. contributed to supervision, writing and review, and editing; C.A.H. contributed to conceptualization, supervision, and project administration; R.L.F. contributed to conceptualization, supervision, and project administration; and S.H.N. contributed to conceptualizations, resources, supervision, methodology, and writing.
Conflict-of-interest disclosure: The authors declare no competing financial interests.
Correspondence: Shivashankar H. Nagaraj, Queensland University of Technology, 60 Musk Ave, Kelvin Grove, QLD 4059, Australia; e-mail: shiv.nagaraj@qut.edu.au; and Robert L. Flower, e-mail: rflower@redcrossblood.org.au

