

Key Points
CEACAM1 is a novel cell surface marker of ex vivo expanded LT-HSCs.
Sorting umbilical cord blood cells based on CEACAM1 and known HSC marker expression allows purification of LT-HSCs with improved purity.

Introduction
Long-term reconstituting hematopoietic stem cells (LT-HSCs) reside at the apex of the hematopoiesis hierarchy and are responsible for the maintenance of blood cell production throughout the lifespan of animals. LT-HSCs are distinct from other blood cell types, displaying both self-renewal and multipotency properties, making them an attractive model for cell- and gene-based therapies.1 As such, HSC transplantation is part of the therapeutic strategy for multiple hematological disorders. Umbilical cord blood (UCB) as a stem cell source for transplantation presents several advantages over bone marrow or mobilized peripheral blood, including increased tolerance for human leukocyte antigen mismatches and reduced incidence of chronic graft versus host disease.2 The therapeutic potential of UCB HSCs, therefore, prompted the discovery of strategies for the ex vivo expansion of these cells, as stem cell doses in UCB units are notoriously low compared with other types of grafts. Molecules like SR1 and UM171, showing the ability to promote HSC expansion ex vivo,3-5 are currently being exploited in clinical settings to improve the outcome of UCB HSC transplantation. A recent phase 1/2 clinical trial indeed demonstrated the safety and feasibility of UM171-mediated UCB stem cell expansion for transplantation, indicating that the advantages of UCB grafts can be exploited for the treatment of hematological diseases.6 Furthermore, with the emergence of gene editing strategies involving programmable nucleases, UM171-mediated UCB HSC expansion represents a promising avenue for stem cell editing for therapeutic purposes.7 Multiple studies characterized HSCs using combinations of markers,8-11 however, we and others have demonstrated discrepancies between the immuno-phenotype of freshly isolated UCB HSCs and UCB HSCs introduced in culture.12-15 All of the above underline the need for better characterization of ex vivo expanded UCB cells. Our group identified EPCR12 and ITGA316 as two culture-compatible HSC markers, which, when combined with currently known markers, identify LT-HSCs in expanded UCB cell cultures. In this article, we report CEACAM1 as a novel LT-HSC marker that further refines the immuno-phenotype of expanded LT-HSCs. CEACAM1 has been implicated in multiple cellular processes, including cell motility, apoptosis, cell proliferation, and certain immune cell functions.17,18
Methods
Human CD34+ UCB cell isolation and culture
UCB cells were collected from consenting mothers based on an ethically approved protocol at Charles-LeMoyne Hospital (Greenfield Park, Canada). The use of UCB specimens was approved by the Research Ethics Boards of the University of Montreal and Charles LeMoyne Hospital. Human CD34+ UCB cells were isolated and cultured as described.16 When indicated, media was supplemented with 35nM UM171.
Flow cytometry, cell sorting, and functional assays
Results and discussion
CEACAM1 expression identifies a phenotypically primitive HSC subpopulation
Our group reported the ability of the ITGA3 marker to discriminate between short-term HSCs (ITGA3-) and LT-HSCs (ITGA3+) in the HSC-enriched CD34+CD45RA-CD90+CD133+EPCR+ ex vivo expanded UCB-derived population.16 Nevertheless, the ITGA3+ population remains heterogeneous, with an LT-HSC frequency of 1 in 38 cells.16 To define the immuno-phenotype of ex vivo expanded UCB LT-HSCs more precisely, we performed comparative transcriptomic analysis of ITGA3+ and ITGA3- populations sorted from CD34+CD45RA-CD90+CD133+EPCR+ UM171-expanded UCB cells. Transcript levels of the cell adhesion molecule CEACAM1 were found to be higher in CD34+CD45RA-EPCR+ cells compared with CD34+CD45RA-EPCRmed/low counterparts12 (Figure 1A, left). Similarly, CEACAM1 transcript levels were higher in LT–HSC-enriched in ITGA3+ cells compared with the ITGA3- fraction (Figure 1A, right).16 Integrated transcriptome analysis of aforementioned populations by our group also recently identified CEACAM1 as one of the top genes with LT–HSC-associated expression.19
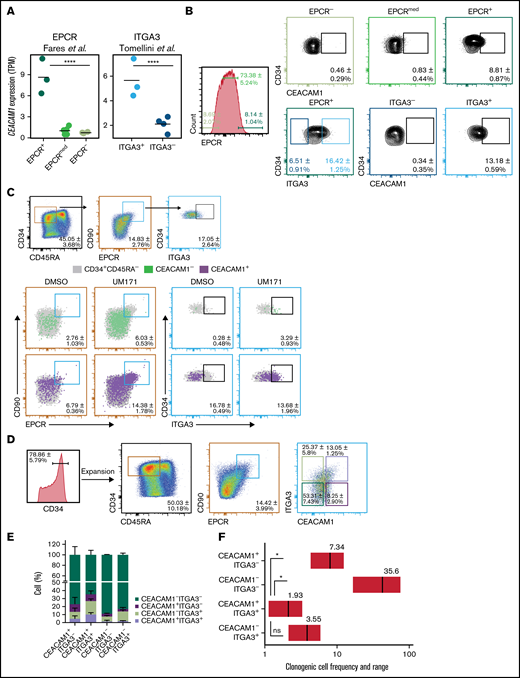
CEACAM1 expression associates with a primitive HSC phenotype. (A) CEACAM1 mRNA expression in UCB cells expanded with UM171 for 7 days and sorted based on EPCR expression from CD34+CD45RA- cells (left) or sorted based on ITGA3 expression from CD34+CD45RA-CD90+CD133+EPCR+ cells (right). RNA sequencing data are from Fares et al,12 and Tomellini et al,16 respectively. Each dot represents a biological replicate, and the median is denoted by the crossbar. TPM, transcripts per kilobase million. ****P = 3.14e-14 for EPCR+ vs EPCRmed/-, ****P = 2.79e-05 for ITGA3+ vs ITGA3- based on Kallisto/Sleuth analysis.23 (B) Proportion of CD34+CEACAM1+ cells in EPCR+, EPCRmed, and EPCR- (top panel) as well as in ITGA3+ and ITGA3- populations from UCB cells expanded with UM171 for 7 days. Percentages represent the relative size of each population in depicted gates. Data presented as mean ± SD for 6 independent biological replicates. (C) Proportion of CEACAM1+ (green) and CEACAM1- (red) cells in the CD34+CD45RA-CD90+EPCR+ subset as well as in ITGA3+ cells gated from this subset (follow reference gating) following expansion with UM171 or DMSO for 7 days. Data presented as mean ± SD for 4 independent biological replicates. (D) Sorting strategy for experiments presented in (E-G). CD34+ UCB cells were expanded for 7 days with UM171 before sorting. Data presented as mean ± SD for 10 independent biological replicates. (E) In vitro analysis of progeny of cells sorted based on CEACAM1 and ITGA3 expression following strategy presented in panel D and reintroduced in culture for 7 additional days. The bar graph represents the proportion of indicated cell populations in culture. Data are presented as mean ± SD for 3 biological replicates. (F) Estimated frequencies (red lines) presented as 1 per number of sorted cells and 95% confidence intervals (CIs) (gray boxes) of clonogenic cells in the indicated populations are shown. Cells were plated at 100, 10, and 1 cell per well. Cells were sorted from expanded cells from 2 separate UCB samples. *P = 0.05, (Mann-Whitney U test, 1-tailed). The objective of these experiments was to determine if the clonogenic cell frequency of the CEACAM1+ITGA3+ population is higher than that of the other subsets. The hypothesis assumed for this test is unidirectional, supporting the use of a 1-tailed test.
CEACAM1 expression associates with a primitive HSC phenotype. (A) CEACAM1 mRNA expression in UCB cells expanded with UM171 for 7 days and sorted based on EPCR expression from CD34+CD45RA- cells (left) or sorted based on ITGA3 expression from CD34+CD45RA-CD90+CD133+EPCR+ cells (right). RNA sequencing data are from Fares et al,12 and Tomellini et al,16 respectively. Each dot represents a biological replicate, and the median is denoted by the crossbar. TPM, transcripts per kilobase million. ****P = 3.14e-14 for EPCR+ vs EPCRmed/-, ****P = 2.79e-05 for ITGA3+ vs ITGA3- based on Kallisto/Sleuth analysis.23 (B) Proportion of CD34+CEACAM1+ cells in EPCR+, EPCRmed, and EPCR- (top panel) as well as in ITGA3+ and ITGA3- populations from UCB cells expanded with UM171 for 7 days. Percentages represent the relative size of each population in depicted gates. Data presented as mean ± SD for 6 independent biological replicates. (C) Proportion of CEACAM1+ (green) and CEACAM1- (red) cells in the CD34+CD45RA-CD90+EPCR+ subset as well as in ITGA3+ cells gated from this subset (follow reference gating) following expansion with UM171 or DMSO for 7 days. Data presented as mean ± SD for 4 independent biological replicates. (D) Sorting strategy for experiments presented in (E-G). CD34+ UCB cells were expanded for 7 days with UM171 before sorting. Data presented as mean ± SD for 10 independent biological replicates. (E) In vitro analysis of progeny of cells sorted based on CEACAM1 and ITGA3 expression following strategy presented in panel D and reintroduced in culture for 7 additional days. The bar graph represents the proportion of indicated cell populations in culture. Data are presented as mean ± SD for 3 biological replicates. (F) Estimated frequencies (red lines) presented as 1 per number of sorted cells and 95% confidence intervals (CIs) (gray boxes) of clonogenic cells in the indicated populations are shown. Cells were plated at 100, 10, and 1 cell per well. Cells were sorted from expanded cells from 2 separate UCB samples. *P = 0.05, (Mann-Whitney U test, 1-tailed). The objective of these experiments was to determine if the clonogenic cell frequency of the CEACAM1+ITGA3+ population is higher than that of the other subsets. The hypothesis assumed for this test is unidirectional, supporting the use of a 1-tailed test.
To validate that CEACAM1 cell surface expression (supplemental Figure 1B,C) associates with the currently known LT-HSC immunophenotype, we analyzed CEACAM1 expression in various expanded UCB-derived cell populations by flow cytometry. These experiments revealed a higher proportion of CEACAM1+ cells in CD34+EPCR+ and CD34+EPCR+ITGA3+ populations compared with CD34+EPCR- and CD34+EPCR+ITGA3- subsets, respectively (Figure 1B). Moreover, CEACAM1+ cells were overrepresented in CD34+CD45RA-CD90+EPCR+ as well as in CD34+CD45RA-CD90+EPCR+ITGA3+ populations compared with CEACAM1- cells, irrespective of expansion conditions (Figure 1C; supplemental Figure 1A). CD34+CEACAM1+ UM171-expanded cells also expressed higher levels of EPCR, ITGA3, and CD90, as well as of other HSC markers such as GPR56,20 CD133,21 and CD318,22 compared with CD34+CEACAM1- cells (supplemental Figure 1D). Likewise, the CD34+CEACAM1+ population was identified in UM171-expanded human mobilized peripheral blood and bone marrow cells, and CD34+CEACAM1+ populations showed a higher proportion of CD90+EPCR+ cells compared with CD34+CEACAM1- subsets (supplemental Figure 1E).
To functionally characterize CEACAM1-expressing cells in vitro, CD34+ UCB cells were expanded with UM171, and CD34+CD45RA-CD90+EPCR+ cells were sorted based on ITGA3 and CEACAM1 expression (Figure 1D). The resulting fractions were then reintroduced in culture for 7 additional days, and immuno-phenotypic analysis of the progeny of sorted populations showed that only CEACAM1+ cells demonstrate the ability to fully recreate the cellular heterogeneity observed before sorting (Figure 1E). In addition, the progeny of CEACAM1+ITGA3+ cells were more enriched in CD34+CD45RA- cells as well as in CD90- and EPCR-expressing cells compared with that of CEACAM1+ITGA3- cells (supplemental Figure 2A,B). In vitro limiting dilution cocultures with mouse stromal cells (MS5), however, revealed similar frequencies of clonogenic cells for the CEACAM1+ITGA3+ and CEACAM1-ITGA3+ subsets (Figure 1F). Altogether, these results point to CEACAM1 as a novel marker of expanded HSCs with the ability to further dissect the CD34+CD45RA-CD90+EPCR+ITGA3+ subset.
CEACAM1 expression identifies functional LT-HSCs within the CD34+CD45RA-CD90+EPCR+ITGA3+ subset
To determine if CEACAM1 expression identifies functional LT-HSCs, CD34+CD45RA-CD90+EPCR+ expanded UCB cells were sorted based on ITGA3 and CEACAM1 expression, and resulting fractions were transplanted in immunocompromised mice (Figure 2A). Assessment of long-term repopulation potential of fractions was performed 24 weeks after transplantation, which resulted in CEACAM1+ITGA3+ cells showing reconstitution levels similar to those of parental and unsorted cells, albeit with a 10-fold enrichment, whereas CEACAM1-ITGA3+ cells showed significantly decreased reconstitution ability (Figure 2B). Sorting CEACAM1-expressing cells from the CD34+CD45RA-CD90+EPCR+ITGA3+ subset provided a long-term engraftment advantage over nonexpressing cells (supplemental Figure 3B), and CEACAM1+ITGA3+ cells displayed robust multilineage differentiation potential (Figure 2C; supplemental Figure 3A). Limiting dilution assays allowed to estimate the LT-HSC frequency in the CEACAM1+ITGA3+ population to 1 in 27, approximately five-fold higher than that of the CEACAM1-ITGA3+ population (Figure 2D; supplemental Figure 3C). Importantly, secondary transplantation experiments (Figure 2A) showed serial reconstitution activity for CEACAM1+ITGA3+ cells, with repopulation levels similar to those observed for parental cells (Figure 2E; supplemental Figure 3D). Characterization of the CEACAM1-expressing HSC population in nonexpanded UCB revealed a tendency for better reconstitution ability for CEACAM1+ cells compared with CEACAM1- cells (supplemental Figure 4). Altogether, these results suggest that CEACAM1 expression identifies functional LT-HSCs within the CD34+CD45RA-CD90+EPCR+ITGA3+ population and further refines the LT-HSC immuno-phenotype.
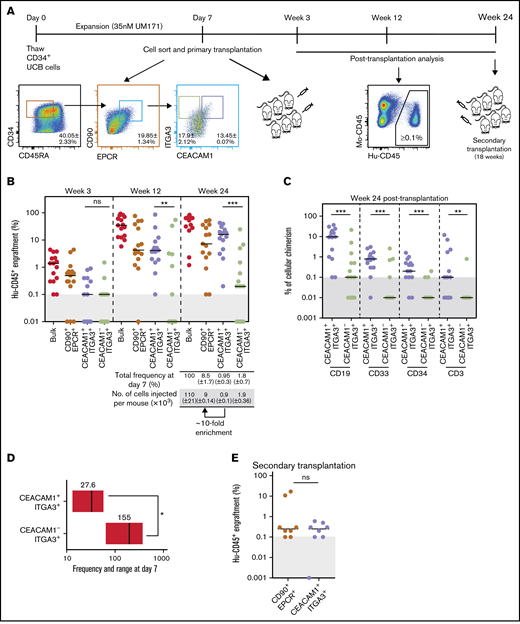
Expression of CEACAM1 associates with LT-HSC activity in expanded UCB cells. (A) Schematic representation of experimental strategy for in vivo studies. Data presented as mean ± SD for 2 independent biological replicates. (B) Long-term engraftment of cells from indicated populations in NSG mice 3, 12, and 24 weeks after transplantation. Each dot represents 1 mouse from 2 independent experiments. Black bars indicate median engraftment values. **P = .0018, ***P = .0003 (Mann-Whitney U test, 2-tailed). Cells were transplanted at cell doses reflecting population frequency at sort to compare the contribution of each subset to engraftment. (C) Lineage potential of indicated populations assessed for each engrafted mouse of the experiment presented in panel B. The percentage of human CD45+ myeloid (CD33+), B lymphoid (CD19+), T lymphoid (CD3+), and primitive (CD34+) cells for each condition is shown. Each dot represents 1 mouse. ***P = .0007 (CD19+), ***P = .0009 (CD33+), ***P = .0001 (CD34+), **P = .0035 (CD3+) (Mann-Whitney U test, 2-tailed). (D) LT-HSC frequency of CEACAM1+ and CEACAM1- populations sorted from CD34+CD45RA-CD90+EPCR+ITGA3+ cells. Estimated frequencies (red lines) presented as 1 per number of sorted cells and 95% CIs (gray boxes) are shown. P = .05 (Mann-Whitney U test, 1-tailed). The objective of these experiments was to determine if the LT-HSC frequency of the CEACAM1+ITGA3+ population is higher than that of the CEACAM1-ITGA3+ subset. The hypothesis assumed for the test is unidirectional, supporting the use of a 1-tailed test. (E) Human engraftment in secondary NSG mice 18 weeks after transplantation. Primary NSG mice transplanted with CEACAM1+ITGA3+ and CD90+EPCR+ parental cells were sacrificed 24 weeks after transplantation, and 80% of BM was collected and transplanted; n = 2 biological replicates.
Expression of CEACAM1 associates with LT-HSC activity in expanded UCB cells. (A) Schematic representation of experimental strategy for in vivo studies. Data presented as mean ± SD for 2 independent biological replicates. (B) Long-term engraftment of cells from indicated populations in NSG mice 3, 12, and 24 weeks after transplantation. Each dot represents 1 mouse from 2 independent experiments. Black bars indicate median engraftment values. **P = .0018, ***P = .0003 (Mann-Whitney U test, 2-tailed). Cells were transplanted at cell doses reflecting population frequency at sort to compare the contribution of each subset to engraftment. (C) Lineage potential of indicated populations assessed for each engrafted mouse of the experiment presented in panel B. The percentage of human CD45+ myeloid (CD33+), B lymphoid (CD19+), T lymphoid (CD3+), and primitive (CD34+) cells for each condition is shown. Each dot represents 1 mouse. ***P = .0007 (CD19+), ***P = .0009 (CD33+), ***P = .0001 (CD34+), **P = .0035 (CD3+) (Mann-Whitney U test, 2-tailed). (D) LT-HSC frequency of CEACAM1+ and CEACAM1- populations sorted from CD34+CD45RA-CD90+EPCR+ITGA3+ cells. Estimated frequencies (red lines) presented as 1 per number of sorted cells and 95% CIs (gray boxes) are shown. P = .05 (Mann-Whitney U test, 1-tailed). The objective of these experiments was to determine if the LT-HSC frequency of the CEACAM1+ITGA3+ population is higher than that of the CEACAM1-ITGA3+ subset. The hypothesis assumed for the test is unidirectional, supporting the use of a 1-tailed test. (E) Human engraftment in secondary NSG mice 18 weeks after transplantation. Primary NSG mice transplanted with CEACAM1+ITGA3+ and CD90+EPCR+ parental cells were sacrificed 24 weeks after transplantation, and 80% of BM was collected and transplanted; n = 2 biological replicates.
In conclusion, we identified CEACAM1 as a robust novel marker of ex vivo expanded UCB LT-HSCs. Sorting CEACAM1+ cells from expanded CD34+CD45RA-CD90+EPCR+ITGA3+ UCB allows for the purification of an HSC-enriched population with the highest LT-HSC frequency reported to date. CEACAM1, therefore, represents an invaluable tool to isolate expanded LT-HSCs with improved purity, opening the door to the improvement of HSC transplantation and editing strategies for clinical applications.
Acknowledgments
The authors thank M. Frechette and V. Blouin-Chagnon for animal care and assistance with in vivo experiments; I. Boivin, A. Durand, and D. Gracias for CD34+ UCB cells purification; S.Corneau for CD34+ BM and mPB cell purification; and A. Gosselin and A. Bellemare-Pelletier at the Institute for Research in Immunology and Cancer for technical support with flow cytometry sorts. The authors also thank Charles-le Moyne Hospital for providing human UCB units.
This work was supported by a CIHR grant (PJT 152995) and a CIHR Foundation Grant (FDN143286). U.A. was supported by scholarships from the Fonds de recherche du Québec and IRIC. E.T. was supported by a fellowship from the Cole Foundation.
Authorship
Contribution: U.A. designed and performed experiments, analyzed results, and wrote the manuscript; E.T. contributed to CEACAM1 identification, experimental design, and project supervision; J.C. helped with experiment design and interpretation of results; B.L. helped with bioinformatic analysis and interpretation of results; N.M. provided assistance with the in vivo studies; M.-E.B. contributed to project supervision and cowrote the manuscript; P.P.R. contributed to project supervision; and G.S. supervised all aspects of the project and edited the manuscript.
Conflict-of-interest disclosure: The authors declare no competing financial interests.
Correspondence: Guy Sauvageau, Institute for Research in Immunology and Cancer (IRIC), P.O. Box 6128, Downtown Station, Montreal, QC, Canada, H3C 3J7; e-mail: guy.sauvageau@umontreal.ca.

