

Key Points
World Health Organization serum ferritin guideline of a <15 µg/L threshold for iron deficiency in healthy women is based on expert opinion.
Physiologically based analysis of female blood donors, 20 to 49 years of age, shows a higher ferritin threshold for iron deficiency of <25 µg/L.
Abstract
Our objective is to develop a physiologically based method to determine serum ferritin thresholds for iron deficiency in healthy individuals. The current World Health Organization threshold of <15 µg/L for iron deficiency in women is based on expert opinion. We examined the relationship between serum ferritin and 2 independently measured indicators of iron-deficient erythropoiesis, soluble transferrin receptor (sTfR) and hemoglobin, in baseline data from 286 women, 20 to 49 years, who were first-time or reactivated donors in the Retrovirus Epidemiology Donor Study-II Donor Iron Status Evaluation (REDS-RISE) study. At lower serum ferritin concentrations, median sTfR increased as hemoglobin decreased. Using restricted cubic spline regression analysis to determine thresholds for iron-deficient erythropoiesis, the thresholds identified by sTfR (serum ferritin < 25.4 µg/L) and hemoglobin (serum ferritin < 25.3 µg/L) did not differ significantly. The thresholds found in the REDS-RISE study do not differ from those identified by sTfR (serum ferritin < 25.5 µg/L) and hemoglobin (serum ferritin < 26.6 µg/L) in a previous study of 5442 women, 20 to 49 years, in the US National Health and Nutrition Examination Survey 2003 to 2018 (P = .98 and 0.83, respectively). Although international comparisons are needed, these results with US data provide additional evidence for the potential usefulness of a physiologically based method to identify serum ferritin thresholds for iron deficiency.
Introduction
Our overall objective is to develop a physiologically based method to identify serum ferritin thresholds for iron deficiency. In health, serum ferritin concentrations are a good indicator of iron stores.1 In 2020, the World Health Organization (WHO) determined that the current guideline of serum ferritin level < 15 µg/L as the threshold for iron deficiency in healthy women was based on expert opinion with low to very low overall certainty of the supporting evidence.1 We proposed a new basis for identifying serum ferritin thresholds that relies on physiologic indicators of iron deficiency.2 Healthy populations are analyzed to minimize influences on serum ferritin of various disorders that are independent of iron stores, such as inflammation and infection. Two physiologic indicators are used to identify the onset of iron deficiency: the soluble transferrin receptor 1 concentration (sTfR) and the circulating hemoglobin concentration. The sTfR provides a sensitive, quantitative measure of erythroid marrow and tissue iron requirements that is independent of the hemoglobin concentration.3 Iron deficient erythropoiesis develops as the iron mobilizable from stores can no longer support hemoglobin synthesis.4 As sTfR concentration starts to rise, the circulating hemoglobin concentration begins to fall. We hypothesize that the onset of iron deficient erythropoiesis is identified by the serum ferritin concentration threshold at which the median sTfR begins to increase and the median hemoglobin concentration begins to decrease.2 Here, we apply the physiologically based method to publicly available data from apparently healthy women, 20 to 49 years of age, who were first-time or reactivated donors in the Retrovirus Epidemiology Donor Study-II Donor Iron Status Evaluation study (REDS-RISE) conducted during 2007 to 2009.5,6 Recognizing the need to corroborate the method by using other healthy populations with high-quality independent data,7 we compare the REDS-RISE analysis to the US National Health and Nutrition Examination Survey 2003 to 2018 (NHANES), which evaluated apparently healthy women aged 20 to 49 years.2 We report the close correspondence between the REDS-RISE and NHANES results using the physiologically based method to identify serum ferritin thresholds for iron deficiency.
Methods
Study populations
We analyzed baseline data from apparently healthy women, 20 to 49 years of age, who participated in the first-time or reactivated donor cohort of the previously described REDS-RISE trial, a multicenter, prospective study of the effects of blood donation on iron homeostasis conducted in 6 US blood donation centers.5,6 All women in the REDS-RISE trial were apparently healthy based on eligibility and clinical screening for volunteer blood donation.5,6 We compared these women to the apparently healthy nonpregnant women, 20 to 49 years of age, in the previously reported NHANES study.2
Laboratory measurements
In the REDS-RISE trial, hemoglobin was measured using the HemoCue Hb 201 analyzer (HemoCue, Lake Forest, CA), serum ferritin by a quantitative chemiluminescent immunoassay (ADVIA Centaur; Siemens Healthcare Diagnostics, Deerfield, IL), and sTfR by quantitative immunoturbidimetry (Tina-quant; Roche Diagnostics, Indianapolis, IN).8
Statistical analysis
The statistical methods used to analyze the REDS-RISE data were identical to those used in the previously reported NHANES study.2 In brief, restricted cubic spline regression models with 5 knots were fit to capture the relationship of continuous serum ferritin with sTfR and with hemoglobin using “rms” package in R.9,10 Serum ferritin thresholds were then derived as the first sTfR minimum and the hemoglobin plateau of ferritin using differential equations. A 2-way test of differences comparing REDS-RISE and NHANES in ferritin threshold effect sizes (within and between) was evaluated using random-effect meta-analyses with 1 degree of freedom.11,12 Statistical significance was set at a 2-tailed P < .05, with 95% confidence intervals (CIs).
Results and discussion
Three principal results emerged from analysis of baseline data from the REDS-RISE study of 286 apparently healthy women who were first-time or reactivated whole blood donors (Table 1; Figure 1) by applying the physiologically based method to determine serum ferritin thresholds for iron deficiency. First, restricted cubic spline regression analysis found a threshold at the sTfR minimum plateau of <25.4 µg that did not significantly differ from that at the hemoglobin plateau of <25.3 µg/L. Second, the serum ferritin thresholds identified by analyzing the REDS-RISE data do not differ significantly from those previously identified by the sTfR minimum (<25.5 µg/L) and hemoglobin plateau (<26.6 µg/L) in the larger sample of apparently healthy 5442 women, 20 to 49 years, in the NHANES survey (Table 1).2 Third, for US data, the close correspondence of the results within and between the independent REDS-RISE and NHANES studies provides evidence for the potential usefulness of the physiologically based method to identify serum ferritin thresholds for iron deficiency. Altogether, these results are consistent with the serum ferritin threshold of <25 µg/L (95% CI, 24.2-26.2) identified in the NHANES study.2
Participant characteristics and serum ferritin concentration thresholds identified by restricted cubic spline regression in a healthy sample of US nonpregnant women aged 20 to 49 years from REDS-RISE and NHANES data
| Participant characteristics | REDS-RISE (N = 286) | NHANES (N = 5442) | P |
|---|---|---|---|
| Age, mean (SD), y | 33.8 (8.9) | 34.6 (8.6) | .55 |
| Hemoglobin (g/dL), mean (SD) | 13.2 (1.0) | 13.2 (1.3) | .45 |
| Serum ferritin (µg/L), median (25th, 75th) | 33.0 (21.0, 52.0) | 34.4 (18.0, 59.0) | .73 |
| Soluble transferrin receptor (mg/L), median (25th, 75th) | 2.7 (2.2, 3.1) | 3.2 (2.6, 4.1) | <.01 |
| Serum ferritin (SF, µg/L) concentration thresholds | |||
| Soluble transferrin receptor (sTfR) | |||
| SF (µg/L) corresponding to sTfR minimum point | 25.4 (23.1, 30.0)* | 25.4 (24.7, 26.3)† | .98 |
| RCS model-adjusted R2, % | 13.0 | 40.3 | |
| Hemoglobin | |||
| SF (µg/L) corresponding to Hb plateau point | 25.3 (13.2, 37.4)‡ | 26.6 (25.6, 27.9)§ | .83 |
| RCS model-adjusted R2, % | 8.0 | 35.4 | |
The following inclusion criteria were used to identify apparently healthy populations. For REDS-RISE,6 all women were considered healthy based on being eligible volunteer blood donors who underwent clinical screening and were accepted for blood donation. For NHANES, as previously described, nonpregnant women were without inflammation, infection (WBC > 109), or possible liver disease (AST/ALT).2 All plateau and minimum estimates and their 95% confidence interval (CI) were obtained from 5000 bootstrap replicates. All CIs have been corrected for bias using the bias corrected acceleration (BCa) approach.25 Column estimates with different superscripts indicate pairwise values that are statistically different from each other at P < .05 (*vs ‡, within REDS-RISE P difference = .99; † vs §, within NHANES P difference = .10). P values calculated from t test for age and Hb and Wilcoxon median tests for SF and sTfR.
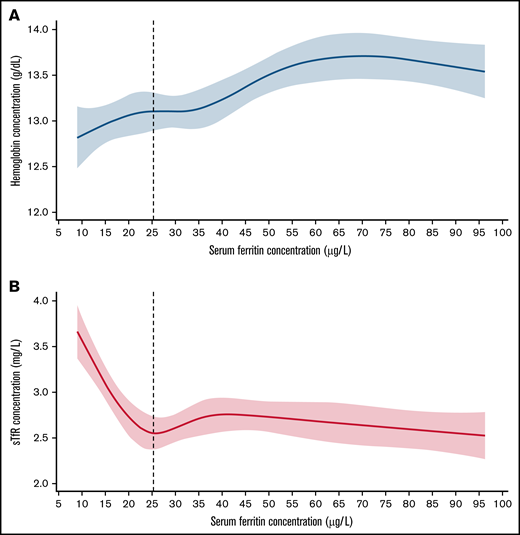
Concentration curve of serum ferritin against hemoglobin, and soluble transferrin receptor in a sample of women who are blood donors. (A) Restricted cubic spline (RCS) regression fit with 5 knots of serum ferritin against Hb; vertical line denotes SF threshold calculated at the first plateau identified by differential equation. (B) RCS fit with 5 knots of serum ferritin against sTfR; vertical line denotes SF threshold calculated at the first minimum identified by differential equations in a healthy sample of US nonpregnant women aged 20 to 49 years from REDS-RISE.6
Concentration curve of serum ferritin against hemoglobin, and soluble transferrin receptor in a sample of women who are blood donors. (A) Restricted cubic spline (RCS) regression fit with 5 knots of serum ferritin against Hb; vertical line denotes SF threshold calculated at the first plateau identified by differential equation. (B) RCS fit with 5 knots of serum ferritin against sTfR; vertical line denotes SF threshold calculated at the first minimum identified by differential equations in a healthy sample of US nonpregnant women aged 20 to 49 years from REDS-RISE.6
The near coincidence of serum ferritin thresholds at the sTfR minimum and hemoglobin plateau in both the REDS-RISE and NHANES studies is likely the consequence of the meticulous homeostatic coordination that conserves tissue iron supply by reducing erythroid consumption as iron deficiency develops.13-15 Exhaustion of available iron stores, indicated by the serum ferritin threshold, seems to simultaneously signal both rising iron need, shown by increased sTfR, and declining erythroid use, marked by decreased circulating hemoglobin concentration. These effects are mediated by a host of mechanisms that maintain tissue iron supply with iron deficiency.13-15 The physiologically based serum ferritin threshold seems to detect the operation of these mechanisms to conserve the tissue iron supply at the onset of iron deficient erythropoiesis, whereas the WHO guideline indicates a more advanced stage of established iron deficiency.
The criteria for selecting apparently healthy populations, the laboratory methods, and the sample sizes and model explained variance differed between the REDS-RISE and NHANES studies. Volunteer blood donors are a healthy, altruistic, specially selected subset of the general population. After applying 38 required donor exclusion criteria, only an estimated 62.6% of the total US population, aged 18 years or older, is eligible to donate blood.16 In the REDS-RISE study, participants were not screened for biochemical evidence of inflammation or liver disease but did undergo an additional clinical screening and donated successfully.5,6 In contrast, NHANES study participants were a subset of a stratified multistage probability sample of the US population that was no longer nationally representative after exclusions for missing values and for common causes of anemia at the population level that are independent of iron deficiency.2 The laboratory methods in the 2 studies were not identical but were of high quality. The number of participants in the 2 study populations differ by an order of magnitude. Despite these differences, the serum ferritin thresholds for iron deficiency in the 2 independent studies do not differ significantly and are nearly identical.
International validation of the physiologically based method is needed.7 Nonetheless, the results of the REDS-RISE study add to evidence that, in women of reproductive age, iron deficient erythropoiesis begins well before the WHO guideline of a serum ferritin of 15 µg/L.13,17-19 A higher serum ferritin threshold would increase the proportion of women recognized as iron deficient.2,7 Recognizing the need for iron in more women could help prevent iron deficiency from remaining untreated and could help prevent progression to a greater iron deficit and to anemia, especially before pregnancy,20-22 and in the third of women worldwide with heavy menstrual bleeding.23 Increasing iron intake can be effective.20,21,24 With a higher serum ferritin threshold, future prospective clinical trials would be needed to determine optimal corrective management through dietary changes, iron supplementation, or both.
Acknowledgments
The findings and conclusions in this report are those of the authors and do not necessarily represent the official position of the Centers for Disease Control and Prevention. Use of trade names and commercial sources are for identification only and does not imply endorsement by the US Department of Health and Human Services.
Authorship
Contribution: O.Y.A., G.M.B., and Z.M. designed the analysis; O.Y.A. and Z.M. analyzed the data; O.Y.A. and G.M.B. wrote the manuscript; O.Y.A., Z.M., E.A.H., M.E.J., A.J.S., R.C.F.-A., S.L.S., and G.M.B. contributed to data interpretation and manuscript revision; and all authors approved of the published article.
Conflict-of-interest disclosure: The authors declare no competing financial interests.
Correspondence: O. Yaw Addo, Centers for Disease Control and Prevention, Mailstop F-77, 4770 Buford Hwy, Atlanta, GA 30341; e-mail: yaw.addo@cdc.gov.

