

Key Points
Alterations to amino acid stress response genes impact sensitivity to l-asparaginase.

Abstract
Understanding the genomic and epigenetic mechanisms of drug resistance in pediatric acute lymphoblastic leukemia (ALL) is critical for further improvements in treatment outcomes. The role of transcriptomic response in conferring resistance to l-asparaginase (LASP) is poorly understood beyond asparagine synthetase (ASNS). We defined reproducible LASP response genes in LASP-resistant and LASP-sensitive ALL cell lines as well as primary leukemia samples from newly diagnosed patients. Defining target genes of the amino acid stress response-related transcription factor activating transcription factor 4 (ATF4) in ALL cell lines using chromatin immunoprecipitation sequencing (ChIP-seq) revealed 45% of genes that changed expression after LASP treatment were direct targets of the ATF4 transcription factor, and 34% of these genes harbored LASP-responsive ATF4 promoter binding events. SLC7A11 was found to be a response gene in cell lines and patient samples as well as a direct target of ATF4. SLC7A11 was also one of only 2.4% of LASP response genes with basal level gene expression that also correlated with LASP ex vivo resistance in primary leukemia cells. Experiments using chemical inhibition of SLC7A11 with sulfasalazine, gene overexpression, and partial gene knockout recapitulated LASP resistance or sensitivity in ALL cell lines. These findings show the importance of assessing changes in gene expression following treatment with an antileukemic agent for its association with drug resistance and highlight that many response genes may not differ in their basal expression in drug-resistant leukemia cells.
Introduction
The marked improvements in long-term disease-free survival in childhood acute lymphoblastic leukemia (ALL) can be attributed to the optimization of treatment protocols guided by clinical and biological prognostic factors.1-4 A fundamental component of contemporary chemotherapy for pediatric ALL is the bacterially-generated enzyme l-asparaginase (LASP). Its increased use has been credited, in part, to the improved outcomes in childhood ALL.1,5-7 Despite this improvement, ALL cells of some children are inherently resistant to asparaginase by mechanisms not fully understood.
LASP hydrolyzes circulating asparagine to generate aspartic acid and ammonia, exploiting inefficient de novo asparagine synthesis in ALL cells due to diminished asparagine synthetase (ASNS), which catalyzes asparagine formation from glutamine and aspartic acid. Preservation of ASNS expression in leukemia cells has long been considered a plausible mechanism of asparaginase resistance.8-10 However, experimental support in primary leukemia cells has been inconsistent.11-15
Recently, the mechanism of ASNS-mediated resistance to LASP in ALL has been further determined by the discovery of ASNS promoter DNA methylation dictating the ability for the gene to be induced by activating transcription factor 4 (ATF4) in amino acid-starved conditions.16,17 The current study was designed to build upon the existing knowledge of ATF4-mediated transcriptional responses to amino acid deprivation and determine if other somatic epigenetic changes like that of ASNS promoter DNA methylation and/or transcriptomic changes impart de novo LASP resistance in primary ALL cells from newly diagnosed patients.
Agnostic genome-wide interrogation of gene expression and DNA methylation in primary ALL cells, as well as defining LASP response genes in ALL cells, revealed basal gene expression, drug-responsive genes, and transcriptional response elements associated with LASP drug sensitivity. We also identified a novel gene associated with LASP sensitivity, SLC7A11, thereby uncovering new mechanisms for poor antileukemic treatment response in childhood ALL.
Methods
Patients
The sensitivity of primary leukemia cells to LASP was determined ex vivo for a total of 212 patients aged ≤18 years with newly diagnosed B lineage ALL enrolled in the St. Jude Total Therapy XVI (TOTXVI, NCT00549848) protocol. The level of minimal residual disease (MRD) in bone marrow on days 15 and 42 of therapy was determined by flow cytometry and/or polymerase chain reaction as previously described.18 An additional 8 primary leukemia samples were used for RNA-seq experiments (6 pediatric, TOTXVII, NCT03117751; 2 adult, University of Chicago). Written informed consent was obtained from all patients or their parents or guardians, and assent from the patients as appropriate. The use of these samples was approved by the institutional review board at St. Jude Children’s Research Hospital.
Cell lines
ALL cell lines used in this study consisted of Nalm6 (ACC 128, Deutsche Sammlung von Mikroorganismen und Zellkulturen [DSMZ], Braunschweig, Germany), CEM (ACC 240, DSMZ), REH (ACC 22, DSMZ), 697 (ACC 42, DSMZ), RS4;11 (ACC 508, DSMZ), SUPB15 (ACC 389, DSMZ), DND41 (ACC 525, DSMZ), which were maintained in standard culture conditions consisting of RPMI 1640 (Gibco, Gaithersburg, MD), supplemented with 2 mM glutamine (Gibco) and 10% fetal bovine serum (Gibco). Cell lines were maintained in a 37°C incubator at 5% CO2 following the suppliers subculturing conditions. Cell line authentication and mycoplasma testing were performed at regular intervals throughout the study.
LASP ex vivo resistance assay
Primary leukemia cells were isolated from the bone marrow or peripheral blood of newly diagnosed ALL patients and tested for LASP sensitivity by a 96-hour 3-(4,5-dimethylthiazol-2-yl)-2,5-diphenyltetrazolium bromide (MTT) assay, as previously described.13,19 Cells were treated with bacterially derived LASP (Biovendor). Additional information is provided in the supplemental Methods.
Genomic profiling of primary ALL cells and cell lines
RNA-seq, DNA methylome analysis, chromatin immunoprecipitation sequencing (ChIP-seq), and assay for transposase-accessible chromatin (ATAC-seq) were all performed at the RNA Sequencing Hartwell Center for Bioinformatics and Biotechnology at St. Jude Children’s Research Hospital. ATAC-seq using Fast-ATAC was performed as previously outlined.20 Detailed methodology related to sample preparation, experimental design, and data analysis can be found in the supplemental Methods.
Immunoblotting
Immunoblotting was performed similarly to as previously reported.19 For each cell line, a total of 12.5 µg of cell lysate was separated on 4% to 12% Bis-Tris polyacrylamide gels (Thermo Fisher Scientific, Waltham, MA) and transferred to polyvinylidene fluoride membranes (0.2 μm). Primary antibodies used were rabbit anti-ATF4 monoclonal (Cell Signaling; 11815S) diluted at 1:1000 and mouse anti-glyceraldehyde-3-phosphate dehydrogenase (GAPDH) (Santa Cruz Biotechnology; sc-47724) diluted at 1:2000. Secondary antibodies consisted of the appropriate horseradish peroxidase (HRP)--conjugated immunoglobulin G antibodies (Jackson Immunoresearch, 1:10 000 dilution). Blots were developed and imaged with SuperSignal West Femto chemiluminescent substrate (Thermo Fisher Scientific) and an Odyssey Fc Imager (LI-COR).
SLC7A11 studies
Detailed information regarding the methodology and experimental design can be found in the supplemental Methods.
Statistical analyses
Detailed information regarding statistical analyses can be found in the supplemental Methods.
Results
Ex vivo LASP LC50 values in primary ALL cells from a patient cohort
To identify LASP response genes involved in drug resistance in vivo, we used ex vivo LASP sensitivity data from B-lineage primary leukemia cells from 212 newly diagnosed children with ALL enrolled in the St. Jude Total Therapy 16 clinical trial (TOTXVI). Primary leukemia cells exhibited marked differences in de novo LASP sensitivity, spanning 4 orders of magnitude (LC50 <0.0016 to >20 IU/mL) (Figure 1A). We classified patient cells as sensitive to LASP when the observed LC50 value was below the lowest tested concentration (0.0016 IU/mL). Leukemia cells with an observed LC50 value >0.0016 and ≤0.669 IU/mL were classified as having intermediate sensitivity to LASP, and those with an observed LC50 value >0.669 IU/mL were classified as resistant. This classification split patient data into thirds, and the second cutoff corresponds to the approximate LC50 values observed in LASP-resistant cell lines (supplemental Figure 1).
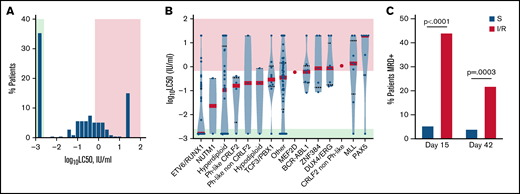
Distribution of de novo LASP LC50 values in primary ALL cells and descriptive genomic features. (A) Frequency distribution of de novo LASP LC50 values in patients (n = 212). (B) Subtype specific differences in LASP LC50 (n = 212). The mean LC50 for each subtype is depicted as a red bar. Green shading represents the concentration range associated with drug sensitivity, while red shading represents the concertation range associated with drug resistance. (C) Frequency of MRD+ patients at day 15 or 42 of therapy. Green (in A) or blue (in B) bars represent patients found to be LASP sensitive, while red shading represents patients found to be intermediate or resistant to LASP. Comparisons between positivity rate and LASP sensitivity class for each time point were performed with Fisher’s Exact test (P < .05).
Distribution of de novo LASP LC50 values in primary ALL cells and descriptive genomic features. (A) Frequency distribution of de novo LASP LC50 values in patients (n = 212). (B) Subtype specific differences in LASP LC50 (n = 212). The mean LC50 for each subtype is depicted as a red bar. Green shading represents the concentration range associated with drug sensitivity, while red shading represents the concertation range associated with drug resistance. (C) Frequency of MRD+ patients at day 15 or 42 of therapy. Green (in A) or blue (in B) bars represent patients found to be LASP sensitive, while red shading represents patients found to be intermediate or resistant to LASP. Comparisons between positivity rate and LASP sensitivity class for each time point were performed with Fisher’s Exact test (P < .05).
Leukemia cells with the ETV6-RUNX1 fusion were most sensitive to LASP, consistent with prior findings,21 while DUX4/ERG, MLL, and PAX5 subtypes were found to be the most resistant (Figure 1B). Importantly, patients with ALL cells classified as intermediate or resistant to LASP were significantly more likely to have high levels (≥1%) of MRD on day 15 of remission induction therapy compared with patients with asparaginase-sensitive leukemia at diagnosis (Fisher’s Exact test; P < .0001) (Figure 1C). Patients with LASP-intermediate or -resistant LC50 were also more likely to be MRD-positive (defined by levels ≥0.01%) at the end of remission induction (day 42) than those with sensitive disease (Fisher’s Exact test; P = .0003) (Figure 1C). Although subtype is a determinant of MRD status, analyses within the B-other subtype identified a significant correlation between MRD status and LASP sensitivity (MRD day 15; P = .02). Overall, these data indicate ALL patient biospecimens harbor a wide degree of sensitivity to LASP, and this information carries prognostic value and is therapeutically relevant in vivo.
Gene expression and DNA methylation features associated with ex vivo LASP sensitivity in primary ALL cells
We next sought to identify genes and CpG DNA methylation sites whose basal level of expression or methylation were associated with ex vivo LASP sensitivity. We used a discovery (n = 136) and validation (n = 76) cohort of patients stratified by gender, age, genetic ancestry, and ALL subtype (see supplemental Methods and supplemental Table 1). Each patient had corresponding somatic RNA-seq, DNA methylation, and ex vivo LASP sensitivity data measured at diagnosis.
Analysis of somatic basal gene expression identified a 535 gene expression signature which significantly discriminated with ex vivo LASP sensitivity (clustering P value = 2.57 × 10⁻⁵ [discovery] and 1.17 × 10⁻² [validation] [Figure 2A]; multivariate linear regression for each gene, false discovery rate [FDR] <0.05 [supplemental Table 2; Figure 2B]). Two example genes with expression associated with LASP sensitivity included anionic amino acid transporter light chain, Xc- system, member 11 (SLC7A11) (Figure 2B), a known starvation response gene,22 and CCAAT enhancer-binding protein α (CEBPA) (Figure 2B), which forms heterodimers with TFs involved in the integrated stress response pathway.23-28 Gene ontology analysis showed that the most enriched pathway represented by these genes was double-strand break repair via break-induced replication (GO:0000727) (supplemental Table 3). We did not find ASNS expression correlated significantly with ex vivo LASP sensitivity, consistent with a recent report.29 Found to be important for producing a resistance phenotype to LASP, the mechanism of ASNS mediate induction has recently been described and is controlled by DNA methylation of the gene promoter region.16 We, therefore, sought to determine if any other genes followed this pattern and displayed differential methylation.
![Correlations between basal gene expression or DNA methylation and LASP sensitivity. (A) Gene expression heatmap of genes (n = 535) discriminate LASP LC50. Patients are denoted at the top of the heatmap as sensitive (green), intermediate (gray), or resistant (red). Expression is denoted as log10(FPKM+1). (B) Basal gene expression [as log10(FPKM+1)] correlation with ex vivo LASP sensitivity by group (S, sensitive; I, intermediate; R, resistant). Box and whisker plots depict the interquartile ranges (IQRs) and tenth to ninetieth percentiles. The linear regression P value for discovery and validations cohorts is shown for each gene (D, FDR <0.05; V, P < .05). (C) DNA methylation heatmap of CpG sites (n = 246) associated with LASP LC50. For each heatmap, the significance of clustering patients by LASP sensitivity was determined by Fisher’s Exact test (P < .05). (D) Basal DNA methylation (β value) correlated with ex vivo LASP sensitivity by group (S, sensitive; I, intermediate; R, resistant). The Kruskal-Wallis test P value for discovery and validation cohorts is shown for each probe (D, FDR <0.1; V, P < .1). Box and whisker plots depict the IQRs and tenth to ninetieth percentiles. (E) Correlation between basal gene expression and DNA methylation. DNA methylation is depicted as hypo-, hemi-, and hyper-methylation (Kruskal-Wallis test; P < .05; n = 136). Box and whisker plots depict the IQRs and tenth to ninetieth percentiles. (F) DNA methylation pattern of the ASNS promoter across 7 probes by drug sensitivity group. Each CpG displayed a significant difference between S, I, and R groups (Kruskal-Wallis test; P < .05).](https://ash.silverchair-cdn.com/ash/content_public/journal/bloodadvances/6/11/10.1182_bloodadvances.2022006965/4/m_advancesadv2022006965f2.png?Expires=1763483424&Signature=YgzKLyXN5JBjuwcpJpmP9HBNEjSzO8K0CYv4WrmVZFDHsqqq4b43FQPZVE5lyZstTNIIiBOAcQD1w0xiEMW7MPxnhbYBUvdXXeqKy8r16thJ7WysgyzE4BFWDHMJMqQcC9YOR4ZBI~f7pRSBR98XQ7w1Zenm~j4lNV~XENXQ63XlOpjpAMMfkvfHxMMBoqFnjt0HBjbryX~82lO4zIUqUuAr1Ivl6ObwSCORIEtHCr7z8HF04Q~X-kljT86W-JRW2zWJZSkAvC7rss4IPQWIpdwbfaUckccosj12toAA02mLc1-07XxrFrvmSN0zK3OlpZwxOUnMAwNlqeWFNJT7GQ__&Key-Pair-Id=APKAIE5G5CRDK6RD3PGA)
Correlations between basal gene expression or DNA methylation and LASP sensitivity. (A) Gene expression heatmap of genes (n = 535) discriminate LASP LC50. Patients are denoted at the top of the heatmap as sensitive (green), intermediate (gray), or resistant (red). Expression is denoted as log10(FPKM+1). (B) Basal gene expression [as log10(FPKM+1)] correlation with ex vivo LASP sensitivity by group (S, sensitive; I, intermediate; R, resistant). Box and whisker plots depict the interquartile ranges (IQRs) and tenth to ninetieth percentiles. The linear regression P value for discovery and validations cohorts is shown for each gene (D, FDR <0.05; V, P < .05). (C) DNA methylation heatmap of CpG sites (n = 246) associated with LASP LC50. For each heatmap, the significance of clustering patients by LASP sensitivity was determined by Fisher’s Exact test (P < .05). (D) Basal DNA methylation (β value) correlated with ex vivo LASP sensitivity by group (S, sensitive; I, intermediate; R, resistant). The Kruskal-Wallis test P value for discovery and validation cohorts is shown for each probe (D, FDR <0.1; V, P < .1). Box and whisker plots depict the IQRs and tenth to ninetieth percentiles. (E) Correlation between basal gene expression and DNA methylation. DNA methylation is depicted as hypo-, hemi-, and hyper-methylation (Kruskal-Wallis test; P < .05; n = 136). Box and whisker plots depict the IQRs and tenth to ninetieth percentiles. (F) DNA methylation pattern of the ASNS promoter across 7 probes by drug sensitivity group. Each CpG displayed a significant difference between S, I, and R groups (Kruskal-Wallis test; P < .05).
Correlations between basal gene expression or DNA methylation and LASP sensitivity. (A) Gene expression heatmap of genes (n = 535) discriminate LASP LC50. Patients are denoted at the top of the heatmap as sensitive (green), intermediate (gray), or resistant (red). Expression is denoted as log10(FPKM+1). (B) Basal gene expression [as log10(FPKM+1)] correlation with ex vivo LASP sensitivity by group (S, sensitive; I, intermediate; R, resistant). Box and whisker plots depict the interquartile ranges (IQRs) and tenth to ninetieth percentiles. The linear regression P value for discovery and validations cohorts is shown for each gene (D, FDR <0.05; V, P < .05). (C) DNA methylation heatmap of CpG sites (n = 246) associated with LASP LC50. For each heatmap, the significance of clustering patients by LASP sensitivity was determined by Fisher’s Exact test (P < .05). (D) Basal DNA methylation (β value) correlated with ex vivo LASP sensitivity by group (S, sensitive; I, intermediate; R, resistant). The Kruskal-Wallis test P value for discovery and validation cohorts is shown for each probe (D, FDR <0.1; V, P < .1). Box and whisker plots depict the IQRs and tenth to ninetieth percentiles. (E) Correlation between basal gene expression and DNA methylation. DNA methylation is depicted as hypo-, hemi-, and hyper-methylation (Kruskal-Wallis test; P < .05; n = 136). Box and whisker plots depict the IQRs and tenth to ninetieth percentiles. (F) DNA methylation pattern of the ASNS promoter across 7 probes by drug sensitivity group. Each CpG displayed a significant difference between S, I, and R groups (Kruskal-Wallis test; P < .05).
We agnostically evaluated the correlation between patient somatic DNA methylation of 401 062 individual CpG sites and ex vivo LASP sensitivity. We found 246 CpG sites that were significantly differentially methylated between LASP sensitive, intermediate, and resistant patients (clustering P value = 4.56 × 10⁻⁵ [discovery] and 8.16 × 10⁻³ [validation] [Figure 2C]; Kruskal Wallis test of probes, FDR <0.1 [supplemental Table 4; examples in Figure 2D]). To assess the potential gene regulatory effect of CpG sites at gene promoters and enhancers, we annotated a CpG to a gene when it was located within −10 kb/+25 bp of the transcription start site (TSS). Of the 246 CpG sites found to be correlated with LASP sensitivity, 50.8% were located within −10 kb/+25 bp of a TSS. These CpG sites mapped to 117 unique genes, with 46 containing multiple unique CpG sites within −10 kb/+25 bp of the TSS. Notably, of the 117 identified genes with annotated significant CpGs, 13 were previously found to have basal gene expression correlated with LASP sensitivity and included BIRC7 (Figure 2B,D), MINA (Figure 2B,D), TMED6 (Figure 2B,D), CEBPA (Figure 2B), ADPRH, GON4L, GSTM4, IGSF3, LIMS2, RAB18, RRS1, SNTB1, and ST6GALNAC3 (see supplemental Figure 2). Eleven of these genes were also found to have a negative correlation with DNA methylation in their promoters (Figure 2E; supplemental Table 5). Importantly, this analysis further identified ASNS promoter methylation (7 unique CpG sites) as significantly correlated with LASP sensitivity ex vivo (Figure 2F).
LASP response genes in ALL cell lines
To identify genes responsive to LASP treatment, we performed RNA-seq in ALL cell lines following LASP treatment (1 IU/mL) for 4 hours. We included commonly studied cell lines of B- and T-lineage ALL, each having been previously found to be either sensitive (RS4;11, SUPB15, DND41) or resistant (Nalm6, 697, REH, CEM) to LASP based on ASNS expression.16,17,30,31
We classified a response gene in each cell line as a gene that displayed a significant increase or decrease in expression (FDR <0.05) while having an absolute log2 fold change >1.5. We also defined a gene as a reproducible response gene when showing differential expression in >1 cell line with the same directionality. In total, we identified 2219 response genes (1135 induced, 1084 repressed), with ∼16.5% being observed in >1 cell line. We further separated reproducible LASP response genes into those which were shared among LASP-resistant cell lines exclusively (n = 214), LASP-sensitive cell lines exclusively (n = 112), or common between both LASP-resistant and LASP-sensitive cell lines (n = 41) (Figure 3A-C; supplemental Table 6). Gene ontology analysis of reproducible resistant cell line response genes and genes shared between LASP-resistant and LASP-sensitive cell lines found intrinsic apoptotic signaling pathways in response to endoplasmic reticulum stress (GO:0070059) to be the most enriched (P < .05) (Figure 3D).
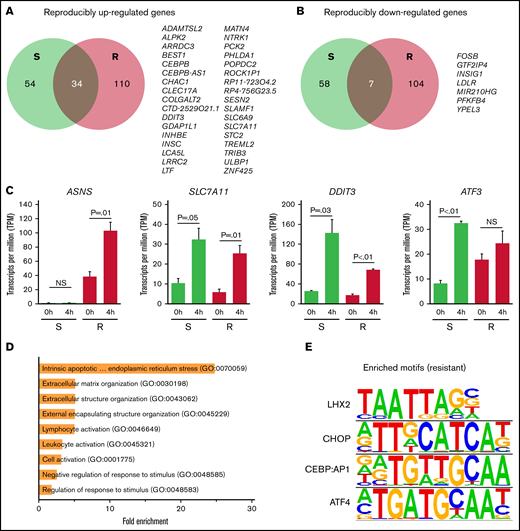
Genes responding to LASP treatment in ALL cell lines. (A-B) Venn diagrams of overlap between LASP response genes between sensitive (S, green) and resistant (R, red) ALL cell lines (n = 3 independent experiments per cell line and timepoint). Reproducibly upregulated LASP response genes are provided in (A), and reproducibly downregulated LASP response genes are provided in (B). Overlapping (common) LASP response genes between sensitive and resistant cells are listed. (C) Average gene expression (in transcripts per million) across sensitive (S, green) and resistant (R, red) ALL cell lines before (0h) and after 4 hours (4h) of LASP treatment (1 IU/mL) for reproducibly-induced response genes. Data for ASNS (resistant only), SLC7A11 (common), DDIT3 (common), and ATF3 (sensitive) (n = 4 resistant cells and n = 3 sensitive cells; mean ± SEM). (D) Fold-enrichment in significantly biological pathways from gene ontology analysis of reproducible inducible response genes from resistant and shared (resistant + sensitive) cell lines (FDR <0.05). (E) Significantly enriched TF motifs observed in LASP response genes reproducibly upregulated in resistant-only and shared (resistant + sensitive) cell lines as identified by HOMER (P < .05).
Genes responding to LASP treatment in ALL cell lines. (A-B) Venn diagrams of overlap between LASP response genes between sensitive (S, green) and resistant (R, red) ALL cell lines (n = 3 independent experiments per cell line and timepoint). Reproducibly upregulated LASP response genes are provided in (A), and reproducibly downregulated LASP response genes are provided in (B). Overlapping (common) LASP response genes between sensitive and resistant cells are listed. (C) Average gene expression (in transcripts per million) across sensitive (S, green) and resistant (R, red) ALL cell lines before (0h) and after 4 hours (4h) of LASP treatment (1 IU/mL) for reproducibly-induced response genes. Data for ASNS (resistant only), SLC7A11 (common), DDIT3 (common), and ATF3 (sensitive) (n = 4 resistant cells and n = 3 sensitive cells; mean ± SEM). (D) Fold-enrichment in significantly biological pathways from gene ontology analysis of reproducible inducible response genes from resistant and shared (resistant + sensitive) cell lines (FDR <0.05). (E) Significantly enriched TF motifs observed in LASP response genes reproducibly upregulated in resistant-only and shared (resistant + sensitive) cell lines as identified by HOMER (P < .05).
To identify potential TFs or gene regulatory networks involved in differential gene expression following LASP treatment, we used Hypergeometric Optimization of Motif EnRichment (HOMER)32 to identify TF motifs significantly enriched in the promoter regions (−1500 bp/+250 bp from TSS) of response genes (supplemental Table 7). We found that the motif for LHX2 and the activating TF ATF4, along with closely related factors CEBP and CHOP, were significantly enriched in the promoters of genes induced in LASP-resistant cell lines or genes shared between LASP-sensitive and LASP-resistant cell lines (Figure 3E). Strikingly, these motifs were not enriched in LASP-sensitive cell line response genes (supplemental Table 7).
We found that only 13 reproducible LASP response genes identified in ALL cell lines (2.4%) also had basal gene expression levels correlated with LASP sensitivity in patients (supplemental Table 8; supplemental Figure 2). We, therefore, hypothesized that the majority of the observed LASP response genes in ALL cell lines (97.6%) do not display meaningful differential expression at a basal level in primary ALL cells from patients.
ATF4-mediated gene induction in response to LASP
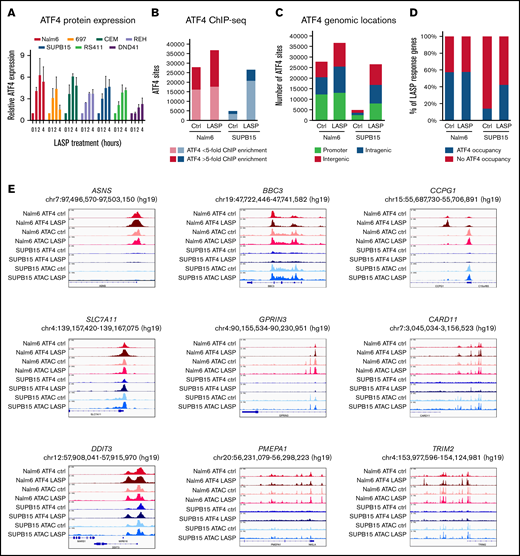
Previous reports have shown that the ATF family of proteins, most notably ATF4, are critical for the induction of ASNS during amino acid-depleted conditions or following LASP treatment.23-27 Extensive work has established that the cellular response to amino acid depletion conditions is mediated in part by the integrated stress response pathway (as reviewed here28 ), crucial to which is the upregulation of ATF4. Having found that the ATF4 motif was enriched in the response genes of LASP-resistant cell lines and not LASP-sensitive cell lines, we sought to determine if LASP-sensitive cell lines have perturbed ATF4 response following LASP treatment by immunoblotting for ATF4. In both LASP-sensitive (SUPB15, RS4;11, and DND41) and LASP-resistant cell lines (Nalm6, 697, CEM, and REH), we observed an increase in ATF4 protein expression immediately following LASP treatment (1 IU/mL) (Figure 4A), and we further confirmed increased ATF4 protein expression after 24 hours of LASP treatment (supplemental Figure 3). In nearly all cell lines, the increase in ATF4 expression peaked near 2 hours following LASP treatment. The conditions used in the ATF4 induction studies did not activate caspase-3/7 in a LASP-sensitive or LASP-resistant cell line (supplemental Figure 4). Furthermore, pretreating cells with a GCN2 inhibitor30 abolished the induction of ATF4 following LASP treatment (supplemental Figure 5).
ATF4 induction and target genes following LASP treatment in ALL cell lines. (A) Relative expression of ATF4 protein in ALL cell lines following LASP treatment (n = 3 independent experiments; mean ± SEM). (B) Number of ChIP-seq ATF4 sites (FDR <0.05; n = 2 independent experiments per cell line and timepoint) in Nalm6 (red) and SUPB15 (blue) cells at basal conditions (Ctrl) or after 2 hours of LASP treatment (1 IU/mL; LASP). Dark red and dark blue denote strong peaks (>fivefold ChIP enrichment), whereas light red and light blue denote weaker peaks (<fivefold ChIP enrichment). (C) Genomic locations of ChIP-seq ATF4 sites are provided at basal conditions (Ctrl) and after LASP treatment (1 IU/mL; LASP) in Nalm6 and SUPB15 cells. (D) Percentage of LASP response genes (absolute log2 fold change >1.5; FDR <0.05) with (green) or without (red) promoter-associated ATF4 occupancy at basal conditions (Ctrl) and after LASP treatment (1 IU/mL; LASP). (E) Integrative genomics viewer (IGV) genome browser tracks showing ATF4 ChIP-seq and ATAC-seq of LASP response genes ASNS, SLC7A11, DDIT3, BBC3, GPRIN3, PMEPA1, CCPG1, CARD11, and TRIM2 before and after LASP treatment in Nalm6 and SUPB15 cells.
ATF4 induction and target genes following LASP treatment in ALL cell lines. (A) Relative expression of ATF4 protein in ALL cell lines following LASP treatment (n = 3 independent experiments; mean ± SEM). (B) Number of ChIP-seq ATF4 sites (FDR <0.05; n = 2 independent experiments per cell line and timepoint) in Nalm6 (red) and SUPB15 (blue) cells at basal conditions (Ctrl) or after 2 hours of LASP treatment (1 IU/mL; LASP). Dark red and dark blue denote strong peaks (>fivefold ChIP enrichment), whereas light red and light blue denote weaker peaks (<fivefold ChIP enrichment). (C) Genomic locations of ChIP-seq ATF4 sites are provided at basal conditions (Ctrl) and after LASP treatment (1 IU/mL; LASP) in Nalm6 and SUPB15 cells. (D) Percentage of LASP response genes (absolute log2 fold change >1.5; FDR <0.05) with (green) or without (red) promoter-associated ATF4 occupancy at basal conditions (Ctrl) and after LASP treatment (1 IU/mL; LASP). (E) Integrative genomics viewer (IGV) genome browser tracks showing ATF4 ChIP-seq and ATAC-seq of LASP response genes ASNS, SLC7A11, DDIT3, BBC3, GPRIN3, PMEPA1, CCPG1, CARD11, and TRIM2 before and after LASP treatment in Nalm6 and SUPB15 cells.
We next performed ATAC-seq and ChIP-seq for ATF4 to map LASP-responsive changes to chromatin accessibility and ATF4 occupancy, respectively. Differences in chromatin accessibility in LASP-resistant Nalm6 cells and LASP-sensitive SUPB15 cells identified 3229 (Nalm6) and 1729 (SUPB15) LASP-responsive chromatin sites (FDR <0.05) after 4 hours of LASP treatment (1 IU/mL) and significant enrichment for ATF4 TF footprints (supplemental Tables 11 and 12; supplemental Figure 6). ATF4 ChIP-seq in Nalm6 cells and SUPB15 cells (Figure 4B) at basal conditions and after 2 hours of LASP treatment (1 IU/mL), which coincided with maximum ATF4 protein induction (Figure 4A), determined that 53% (Nalm6) and 32% (SUPB15) of LASP-responsive accessible chromatin sites harbored ATF4 occupancy, and ATF4 was significantly enriched at LASP-responsive accessible chromatin sites compared with nonresponsive sites (Fisher’s exact test; P < 2.2 × 10⁻¹⁶; odds ratio, 2.4 [Nalm6] or 2.2 [SUPB15]).
Strikingly, we identified substantially less ATF4 occupancy in SUPB15 cells at basal conditions (Figure 4B), which is consistent with lower basal ATF4 protein expression in SUPB15 cells (supplemental Figure 3). Following LASP treatment, increased ATF4 occupancy was observed at promoter and promoter–distal (intragenic and intergenic) sites in SUPB15 cells (Figure 4C). By contrast, in Nalm6 cells, ATF4 occupancy following LASP treatment was largely restricted to promoter–distal locations, with only 11% of newly established ATF4 sites residing at promoters (Figure 4C). Analyses of LASP response genes in each cell line (absolute log2 fold change >1.5) further confirmed that ATF4 promoter occupancy at LASP response genes is largely preestablished before LASP treatment in Nalm6 cells, whereas a threefold increase in ATF4 promoter occupancy is observed in SUPB15 cells following LASP treatment (Figure 4D).
We further investigated if chromatin accessibility could explain differences in promoter-associated ATF4 occupancy at basal conditions between Nalm6 and SUPB15 cells (supplemental Figure 7). We determined that nearly all ATF4 sites near promoters (±2.5 kb from TSS) harbored accessibility at basal conditions (99.1% in Nalm6 and 98.8% in SUPB15). Importantly, while most ATF4 unbound promoters (75.1%) in Nalm6 cells reside in closed chromatin, only 29.6% of ATF4 unbound promoters in SUPB15 cells reside in closed chromatin. Moreover, in promoter-associated regions that exhibit differences in basal ATF4 occupancy between Nalm6 and SUPB15 cells (ie, ATF4 occupied in Nalm6 but unoccupied in SUPB15), only 10.9% are inaccessible in SUPB15 cells. Collectively, these results suggest that chromatin accessibility cannot fully explain lower ATF4 promoter occupancy in SUPB15 cells at basal conditions. Nonetheless, these observations remain concordant with lower basal ATF4 protein expression in SUPB15 cells as at least partially contributing to lower ATF4 promoter occupancy before LASP treatment (supplemental Figure 3).
We further identified 10 261 (Nalm6) and 6551 (SUPB15) ATF4 sites as being LASP-responsive by exhibiting differential occupancy after LASP treatment (FDR <0.01) (supplemental Tables 9 and 10), and the majority of these LASP-responsive ATF4 sites were observed to be activation events (Nalm6 = 63%, SUPB15 = 72%). Integration of gene expression with ATF4 occupancy identified that LASP-responsive activating ATF4 sites were significantly enriched near upregulated (induced) genes in each cell (Kolmogorov-Smirnov test; P < .01) (supplemental Figure 8). In addition, genes with promoter-associated ATF4 occupancy (±2.5 kb from TSS) at basal conditions were also more highly expressed compared with all expressed genes devoid of ATF4 promoter occupancy in both cells (Wilcoxon rank-sum; P < 2.2 × 10⁻¹⁶) (supplemental Figure 9A), and genes with promoter-associated ATF4 occupancy following LASP treatment exhibited significantly greater variance in expression following LASP treatment in both cells (F-test; P < 2.2 × 10⁻¹⁶) (supplemental Figure 9B). Importantly, 47% of the 367 reproducible LASP response genes identified across diverse ALL cell lines were bound by ATF4 (±2.5 kb from TSS), and 36% of these ATF4 sites were LASP-responsive. Several notable LASP response genes were ASNS and DDIT3, which are validated targets of ATF4, as well as a gene with basal expression correlating with ex vivo LASP sensitivity, SLC7A11, and other LASP response genes were identified that harbor absent or reduced ATF4 occupancy in SUPB15 cells (examples in Figure 4E).
LASP response genes in primary ALL cells
To confirm that the LASP response genes identified in ALL cell lines were also response genes in primary ALL cells, we treated freshly isolated primary ALL cells from 8 patients at diagnosis in an identical manner to that of the ALL cell lines and performed RNA-seq (supplemental Table 13). Notably, these 8 primary cells span all 3 LASP LC50 classification groups (sensitive, intermediate, and resistant). In primary samples, we defined a reproducible response gene as a gene with an absolute log2 fold change in expression of >1 while also appearing in ≥2 samples with common directionality. Using these criteria, we identified 2913 reproducible LASP response genes (1784 induced, 1129 repressed) (supplemental Table 14) in patient samples. Gene ontology analysis revealed that the most enriched pathway for induced genes was amino acid import across the plasma membrane (GO:0089718) (FDR <0.05) (supplemental Table 15). Motif enrichment of induced genes in patients revealed CHOP, ATF4, and CEBP TF binding sites significantly enriched within gene promoters (−1500 bp/+250 bp from TSS) (supplemental Table 16).
Overlap between induced LASP response genes in primary ALL cells and promoter-associated ATF4 ChIP-seq sites (±1500 bp from TSS) in ALL cell lines found 239 genes (13%) as direct targets of ATF4, and 63 of these genes (26%) harbored LASP-responsive ATF4-promoter binding. We also observed 19% (n = 38) of reproducibly induced LASP response genes from ALL cell lines were also induced in primary ALL cells from patients. Importantly, 68% (n = 26) of these overlapping genes were associated with ATF4 promoter binding events, and 81% (n = 21) of these genes harbored LASP-responsive ATF4 promoter binding. Further supporting the role of ATF4 in the LASP response, we determined ATF4 protein expression was induced after LASP treatment in primary cells (supplemental Figure 10).
LASP response gene SLC7A11 contributes to drug resistance
Having confirmed the previously reported mechanism of ASNS-mediated resistance33 in patients through promoter DNA methylation (Figure 2I), we elected to follow up on a novel gene candidate, SLC7A11 (supplemental Table 2). We identified SLC7A11 gene expression as being correlated with LASP sensitivity at a basal level (Figure 2B), and increased SLC7A11 expression led to significantly increased sensitivity to LASP ex vivo. This gene was also found to be differentially bound by ATF4 following LASP treatment in Nalm6 cells (Figure 4E), as well as identified as a common response gene between sensitive and resistant ALL cell lines (Figure 3A,C). SLC7A11 has been previously shown to be a cystine/glutamate antiporter and a part of the xCT- transport system (as reviewed here22 ). To test the function of the SLC7A11 protein, we used the chemical inhibitor sulfasalazine34 in LASP-resistant Nalm6 cells and LASP-sensitive SUPB15 cells. Although cotreatment with sulfasalazine and LASP could partially restore cell viability when compared with LASP alone in both cells, significant effects from cotreatment were also observed at lower LASP concentrations in SUPB15 cells (Figure 5A-B) (P ≤ .05). Notably, these findings were consistent with the observed increase in expression of SLC7A11 being associated with LASP sensitivity in patients.
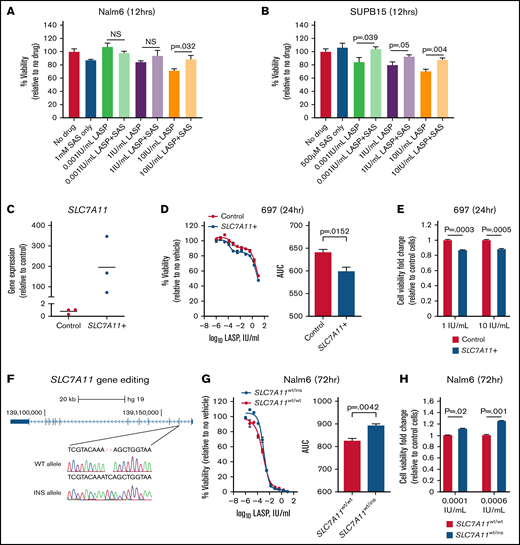
Modulation of SLC7A11 alters ALL cell line sensitivity to LASP. (A-B) Rescue of LASP-mediated cell death by sulfasalazine in Nalm6 (A) and SUPB15 (B) cells. Each cell line was treated with sulfasalazine (SAS; 500 µM or 1 mM), LASP (0.001 IU/mL, 1 IU/mL, and 10 IU/mL), or both drugs for 12 hours before assessment of cell viability (t test; P ≤ .05; n = 4 independent experiments; mean ± SEM). (C) Relative SLC7A11 overexpression in 697 cells (n = 3 independent experiments). (D) Dose–response (left) after 24 hours of LASP treatment following transient overexpression of SLC7A11 in 697 cells and changes in area under the curve (AUC) (right, P < .05; n = 3 independent experiments; mean ± SEM). (E) Change in cell viability between control and SLC7A11 overexpressing 697 cells as fold change relative to control cells is shown after 1 IU/mL (left) and 10 IU/mL (right) of LASP treatment for 24 hours (P < .01; n = 12 independent experiments; mean ± SEM). (F) Depiction of the edited region of SLC7A11 gene sequence in exon 2 in Nalm6 cells. WT = SLC7A11 wildtype, INS = SLC7A11 insertion. (G) Dose–response (left) after 72 hours of LASP treatment and changes in AUC (right) in Nalm6 SLC7A11-disrupted cells (SLC7A11wt/ins) compared with wildtype Nalm6 cells (SLC7A11wt/wt; P < .05; n = 3 independent experiments; mean ± SEM). (H) Change in cell viability between SLC7A11wt/wt and SLC7A11wt/ins Nalm6 cells as fold change relative to wild-type cells is shown after 0.0001 IU/mL (left) and 0.0006 IU/mL (right) of LASP treatment for 72 hours (P < .01; n = 18 independent experiments; mean ± SEM).
Modulation of SLC7A11 alters ALL cell line sensitivity to LASP. (A-B) Rescue of LASP-mediated cell death by sulfasalazine in Nalm6 (A) and SUPB15 (B) cells. Each cell line was treated with sulfasalazine (SAS; 500 µM or 1 mM), LASP (0.001 IU/mL, 1 IU/mL, and 10 IU/mL), or both drugs for 12 hours before assessment of cell viability (t test; P ≤ .05; n = 4 independent experiments; mean ± SEM). (C) Relative SLC7A11 overexpression in 697 cells (n = 3 independent experiments). (D) Dose–response (left) after 24 hours of LASP treatment following transient overexpression of SLC7A11 in 697 cells and changes in area under the curve (AUC) (right, P < .05; n = 3 independent experiments; mean ± SEM). (E) Change in cell viability between control and SLC7A11 overexpressing 697 cells as fold change relative to control cells is shown after 1 IU/mL (left) and 10 IU/mL (right) of LASP treatment for 24 hours (P < .01; n = 12 independent experiments; mean ± SEM). (F) Depiction of the edited region of SLC7A11 gene sequence in exon 2 in Nalm6 cells. WT = SLC7A11 wildtype, INS = SLC7A11 insertion. (G) Dose–response (left) after 72 hours of LASP treatment and changes in AUC (right) in Nalm6 SLC7A11-disrupted cells (SLC7A11wt/ins) compared with wildtype Nalm6 cells (SLC7A11wt/wt; P < .05; n = 3 independent experiments; mean ± SEM). (H) Change in cell viability between SLC7A11wt/wt and SLC7A11wt/ins Nalm6 cells as fold change relative to wild-type cells is shown after 0.0001 IU/mL (left) and 0.0006 IU/mL (right) of LASP treatment for 72 hours (P < .01; n = 18 independent experiments; mean ± SEM).
Next, we transiently overexpressed SLC7A11 in 697 cells (Figure 5C) and performed LASP dose–response studies. We observed that overexpression of SLC7A11 led to enhanced cell death after 24 hours of LASP treatment (Figure 5D) (P = .0152), and this was further validated by measurements of cell viability using cell imaging after LASP treatment (Figure 5E). Supporting these data, SLC7A11 overexpression in RS411 cells also led to enhanced cell death after 24 hours of LASP treatment (supplemental Figure 10).
We also knocked out SLC7A11 and single-cell expanded edited cells in Nalm6 cells (Figure 5F). Dose–response experiments with the partial knockout in Nalm6 cells revealed significant protection from LASP after 72 hours of treatment (Figure 5G) (P = .0042). This result was further validated by measurements of cell viability using cell imaging after LASP treatment at discrete LASP concentrations (Figure 5H). Supporting these data, SLC7A11 disruption in heterogeneous 697 or RS411 cell populations also led to greater viability following LASP treatment (supplemental Figure 11). Collectively, these experiments confirm the effect direction of SLC7A11 previously observed between basal gene expression and ex vivo LASP sensitivity, thereby validating this gene as a LASP resistance gene.
Discussion
LASP is a critical component of curative chemotherapy for children and young adults with ALL.1,6,7,35 -37 We documented a >1000-fold range of leukemia-cell sensitivity to LASP among 212 newly diagnosed patients with ALL. Patients exhibiting de novo resistance to LASP were documented in all molecular subtypes of B-lineage ALL, although certain subtypes were more sensitive (ie, ETV6-RUNX1 fusion) or more resistant (ie, DUX4/ERG, MLL, and PAX5). Previous studies by our group and others have shown that de novo LASP resistance is associated with inferior treatment response,5,13,38 a finding confirmed in the current study based on MRD levels measured during and at the end of remission induction therapy.
Using agnostic genome-wide basal transcriptomic and DNA methylation analyses of primary ALL cells from newly diagnosed patients, we identified differential expression of 535 genes and methylation of 246 CpG loci as significantly associated with de novo LASP sensitivity in primary ALL cells in 2 cohorts. Increased ASNS expression has been associated with LASP resistance in several different cell types, including ALL cells,8,10,39 -42 and the mechanism of gene induction has recently been described.16 Our findings are consistent with prior studies, where ASNS promoter methylation was significantly correlated with LASP sensitivity in patients.33
Additionally, we identified SLC7A11 as an ATF4 target and LASP response gene which also displayed a basal gene expression correlation with ex vivo sensitivity. In ALL cell lines, we showed that chemical inhibition of the transporter with sulfasalazine could rescue cells from LASP-mediated cell death early in treatment. Additional manipulation of the gene in ALL cell lines also showed changes in LASP sensitivity, with changes in LASP sensitivity from SLC7A11 disruption being most pronounced at lower concentration ranges. While SLC7A11 induction in response to amino acid stress allows cells to combat reactive oxygen species, its induction in asparagine-depleted conditions specifically may be detrimental to the cell.43 Cellular stress response has been demonstrated to enhance the importance of nonessential amino acids, including asparagine.44 Notably, a second glutamate transporter, SLC1A3, has been identified as a key supplier of glutamate under these stress conditions. Additionally, properly functioning SLC1A3 has been previously shown to be positively correlated with LASP resistance in solid tumors.45 Based on the known functions of SLC7A11 as a cystine/glutamate antiporter and part of the xCT- transport system,22 our study indicates that blockage of glutamate export is beneficial to ALL cells for surviving LASP exposure. Together these data suggest the importance of maintaining intracellular glutamate for enabling amino acid metabolism in asparagine-depleted conditions, and novel therapeutics that promote glutamate export could be a treatment option to circumvent LASP resistance in ALL patients in the clinic. However, we cannot exclude alternative mechanisms for the functional effects of SLC7A11, and additional functional studies are required to functionally validate the molecular mechanism linking SLC7A11 to LASP sensitivity.
The current study also used array-based DNA methylation data which may have incomplete coverage of relevant CpG loci when compared with whole-genome bisulfite sequencing data. Additionally, both experimentally and computationally, this study identified a large fraction of LASP response genes as ATF4 targets. The large degree of redundancy and crossover in different pathways of the integrated stress response means other transcriptional pathways (ie, PERK and mTOR) and factors (XBP1 and ATF6) certainly contribute to LASP-mediated amino acid stress response and warrant further analysis. Moreover, because much of our work was conducted in ALL cell lines, additional validation in primary ALL cells is warranted.
Our study extends recently identified mechanistic insights into LASP resistance in ALL, showing epigenetic changes in ASNS confer de novo LASP resistance through hypomethylation or hemimethylation of the ASNS promoter. Notably, we also identified the cystine/glutamate antiporter, SLC7A11, as a novel LASP response and resistance gene that, when expressed at high levels, may sensitize ALL cells. Our functional studies extend prior studies and highlight the importance of glutamate in amino acid-depleted conditions. Overall, our analysis identifies alterations of ATF4 amino acid stress response genes as playing an important role in LASP resistance in pediatric ALL.
Acknowledgments
The authors thank the patients and families who participated in these institutional review board-approved studies. They also thank the technical staff in our labs (H. Williams, N. Atkinson, D. Maxwell, J. Hunt, B. Smart, Y. Wang, A. John, and T. Lin), the Hartwell Center for Bioinformatics & Biotechnology, and the Center for Advanced Genome Engineering (CAGE) at St. Jude Children’s Research Hospital.
Research reported in this publication was supported in part by funds from the National Institutes of Health grants R01 CA36401 (W.E.E.), P50 GM115279 (M.V.R., J.J.Y., C.G.M., and W.E.E.), U01 GM92666 (M.V.R. and W.E.E.), the National Cancer Institute R01 CA234490 (D.S.), CA021765 (Cancer Center Core Grant) and by the American Lebanese Syrian Associated Charities. The content is solely the responsibility of the authors and does not necessarily represent the official views of the National Institutes of Health.
Authorship
Contribution: D.C.F., W.E.E., and D.S. conceptualized the study; D.C.F., E.J.B., S.M.P.-M., W.E.E., and D.S. provided the methodology; D.C.F., J.R.M., B.P.B., K.R. Bhattarai, R.J.A., B.S.H., and R.B. organized study investigations; D.C.F., K.R. Barnett, Q.D., and D.S. provided formal analysis; D.C.F., K.R. Barnett, W.Y., C.S., and Q.D. curated the data; K.R.C., W.S., C.G.M., H.I., S.J., C.-H.P., J.J.Y., M.V.R., and W.E.E. provided patient sample collection and sample acquisition; D.C.F., J.R.M., W.E.E., and D.S. wrote the original draft of the manuscript; D.C.F., J.R.M., K.R. Barnett, E.J.B., W.J., C.S., B.P.B., R.J.A., Q.D., Y.G., J.D.D., K.R.C., S.M.P.-M., K.G.R., W.S., C.G.M., H.I., S.J., C.-H.P., J.J.Y., M.V.R., W.E.E., and D.S. reviewed and edited the manuscript; and W.E.E., J.J.Y., M.V.R., and D.S. secured funding for the study.
Conflict-of-interest disclosure: The authors declare no competing financial interests.
Correspondence: Daniel Savic, St. Jude Children’s Research Hospital, 262 Danny Thomas Pl, MS: 313, Memphis, TN 38105; e-mail: daniel.savic@stjude.org.

