

Key Points
MMPs are deregulated in AML.
Inhibiting MMPs reduces AML growth, retains hematopoietic stem cells, and enhances chemotherapy effectiveness.

Abstract
Acute myeloid leukemia (AML) is a blood cancer of the myeloid lineage. Its prognosis remains poor, highlighting the need for new therapeutic and precision medicine approaches. AML symptoms often include cytopenias linked to loss of healthy hematopoietic stem and progenitor cells (HSPCs). The mechanisms behind HSPC decline are complex and still poorly understood. Here, intravital microscopy (IVM) of a well-established experimental model of AML allows direct observation of the interactions between healthy and malignant cells in the bone marrow (BM), suggesting that physical dislodgment of healthy cells by AML through damaged vasculature may play an important role. Multiple matrix metalloproteinases (MMPs), known to remodel extracellular matrix, are expressed by AML cells and the BM microenvironment. We reason MMPs could be involved in cell displacement and vascular leakiness; therefore, we evaluate the therapeutic potential of MMP pharmacological inhibition using the broad-spectrum inhibitor prinomastat. IVM analyses of prinomastat-treated mice reveal reduced vascular permeability and healthy cell clusters in circulation and lower AML infiltration, proliferation, and cell migration. Furthermore, treated mice have increased retention of healthy HSPCs in the BM and increased survival following chemotherapy. Analysis of a human AML transcriptomic database reveals widespread MMP deregulation, and human AML cells show susceptibility to MMP inhibition. Overall, our results suggest that MMP inhibition could be a promising complementary therapy to reduce AML growth and limit HSPC loss and BM vascular damage caused by MLL-AF9 and possibly other AML subtypes.
Introduction
Acute myeloid leukemia (AML) is the most common form of acute leukemia in adults. While progress has been made in treatment development, relapse incidence remains high, resulting in a poor prognosis.1 One challenge with developing effective AML treatments is the extensive diversity in the disease biology, underpinned by the large number of genetic alterations driving disease development.2 Precision medicine is, therefore, a sought-after approach to tackle AML successfully. AML patients develop severe cytopenia due to loss of healthy hematopoietic stem and progenitor cells (HSPCs) driven by remodeling of the bone marrow (BM) microenvironment by malignant cells.3-7 Healthy blood cell count recovery following chemotherapy has emerged as the second most important predictor of disease-free survival after minimal residual disease8,9 and as an important predictor of reduced morbidity after therapeutic stem cell transplantation.10 It critically depends on healthy HSPCs driving hematopoietic recovery from the BM; therefore, therapeutic interventions that strengthen healthy hematopoiesis and protect the microenvironments of HSPCs are necessary.
Well-established murine experimental models of AML allow investigation of the competition between healthy and AML cells within the BM and have shown a clear negative correlation between the number of healthy HSPCs and AML cells.11-13 Understanding the principles of competition between healthy and malignant cells is important to identify novel therapeutic targets. We and others have reported the absence of widespread apoptosis of healthy cells,11-13 increased size and stiffness of leukemia cells,14 and increased vascular permeability in the BM of AML-burdened mice,6 raising the hypothesis that AML cells may orchestrate a physical displacement of healthy cells. Extracellular matrix (ECM) surrounds and supports all cells, including hematopoietic precursors in the BM.15 Dysfunctional ECM remodeling was demonstrated to facilitate solid cancer invasion and metastasis.16 Its role in leukemia is still understudied; however, it has been reported that matrix stiffness can affect leukemia growth and that myeloid malignant cell proliferation is enhanced on softer matrices.17 Intravital microscopy (IVM) uniquely enables direct observation of the interactions between AML and healthy hematopoietic cells within the BM microenvironment.7 Here, we visualize increased vascular permeability sooner than previously reported6 and abnormal egress of healthy cells into circulation. Deregulated expression of matrix metalloproteinases (MMPs) in murine and human AML samples suggests that these enzymes may contribute to the processes observed. Using the broad-spectrum metalloproteinase inhibitor (MMPI) prinomastat (AG3340), we identify MMPs as a promising target to inhibit AML progression, protect BM vasculature, retain BM HSPCs, and improve chemotherapy efficacy.
Methods
All animal work was in accordance with the animal ethics committee at Imperial College London and University of Glasgow and UK Home Office regulations (ASPA, 1986). All mice were bred and housed at Imperial College London or Sir Francis Crick Institute. Some wild-type (WT) mice were housed at the Beatson Cancer Institute. C57BL/6 WT were purchased from Charles River (United Kingdom). mT/mG18 and NOD scid γ (NSG) mice were from the Francis Crick Institute. Flk1-GFP mice19 were a gift from Alexander Medvinsky (University of Edinburgh). PU1-YFP mice20 were a gift from Claus Nerlov (University of Oxford). In all experiments, female mice >6 weeks old were used.
BM chimeras, AML experimental models, drug treatments, flow cytometry analyses, enzyme-linked immunoassays (ELISAs), intravital microscopy, image processing and quantification, cell culture, quantitative polymerase chain reaction (qPCR), murine and human transcriptomics data analysis, mathematical modeling, and statistical analysis were performed as published6,7,13,21 ,, -26 and/or as described in the supplemental Methods section. Time-lapse data registration was achieved using 4-dimensional data protocols implemented in ImageJ.27 Transcriptomics datasets from Duarte et al7 were analyzed using HISAT228 and FeatureCounts from the Rsubread package (version 1.34.7)29,30 ; those from Baccin et al31 were analyzed using DotPlot from the Seurat library32 ; and those from Baryavno et al33 were visualized using the platform linked to the data. Human transcriptomics data were from the “Beat-AML” program (http://www.vizome.org/).34
Results
Healthy hematopoietic cells are dislodged from the BM
To directly observe competition between AML and healthy hematopoietic cells, we generated chimeric mice bearing nonfluorescent stroma and membrane-bound mTomato+ hematopoietic cells, injected them with YFP+ MLL-AF9 AML blasts, and examined the calvarium BM by IVM while disease progressed (Figure 1; supplemental Figure 1). When we compared AML-burdened and healthy chimeras, we were able to detect, exclusively in leukemic mice, multiple nonmalignant mTomato+ cells intravasating as a cluster (supplemental Figure 1A,A’; supplemental Video 1). Consistent with this, while we observed mostly single cells and occasionally doublets in circulation in healthy mice, we detected clusters of up to 8 healthy cells circulating in mice with intermediate leukemia infiltration (10% to 25% blasts in peripheral blood [PB]) during routine 3–hour-long time-lapse imaging sessions (Figure 1A-B; supplemental Video 2). Of note, these circulating clusters were no longer frequent once the BM was fully infiltrated and healthy hematopoiesis outcompeted.
![Healthy hematopoietic cell clusters and increased vascular leakiness in leukemic mice. (A) Representative frames from time-lapse IVM of calvarium BM in healthy (left) and AML-burdened (right) Flk1-GFP mice. Green: ECs. Red: mTomato+ healthy hematopoietic cells. AML cells are not shown. Arrows point at circulating healthy cells (left) or cell clusters (right). (B) Quantification of circulating healthy single cells and clusters in healthy and AML-burdened mice in 3–hour-long timelapse images. Data pooled from 5 healthy and 4 leukemic mice from 3 independent experiments. Eight fields of view were imaged simultaneously per mouse. (C) Percentage of doublets and cell clusters in peripheral blood (PB) of healthy and AML-burdened mice. Data obtained from 15 healthy and 25 leukemic mice from 3 independent experiments. (D) Vascular leakiness was assessed by time-lapse IVM of randomly selected regions within the calvarium of Flk1-GFP mice following administration of TRITC-dextran. Representative frames selected from 3 healthy and 4 leukemic (<10% AML blood infiltration) mice are shown. AML cells are not shown. (E) Quantification of the fold change in TRITC-dextran intensity in the BM parenchyma of healthy and early infiltrated (<10% AML blood infiltration) leukemic mice. n = 3 control and 4 leukemic mice, 3 areas measured/mice (eg, white boxes in [D]). (F) Quantification of average vessel diameter in healthy vs early infiltrated mice, with vessels measured in 3 fields of view/mice. n = 5 mice/condition. (G) Gene expression heatmap for MMP-8, MMP-9, and MMP-19 for AML cells and GMPs. n = 9 control and n = 9 leukemic mice. (H) Stroma and hematopoietic cell types expressing MMPs in healthy murine BM based on published single-cell RNAseq datasets. Circle size and color represent the proportion of expressing cells within the population, and average expression, respectively. All scale bars represent 80 µm. All data are mean ± SEM. **P < .01; ***P < .001; NS, not significant. P values determined by t tests.](https://ash.silverchair-cdn.com/ash/content_public/journal/bloodadvances/6/10/10.1182_bloodadvances.2021004321/7/m_advancesadv2021004321f1.png?Expires=1765910746&Signature=r4bG9zgkPIrqdDeklHNiXv37HRt-jaQQKbt88wPy32WlMcsJm-qlFTTZzez6soM~d-rjSrKPgNy85R9XllJmT2IuNcTQWINxM-54ZKQN0pWZYVVrZ0pAsuFhaoazESd6aPMxIS8ftPu9~tYR~pLEjjuROlYeEh02626qjlHqgR6sAjnp6NlMR8FEaTJircMAErQLs4VZ9cvJZ4VGuFvqEuJo9m8Y-fZeZvjLVyn4gXEro5-uuI1pbsKnLg2KfjRO8Zqvx~DUBQgGJWYnpkM1e1WZiSOLfk~IkoOZF9DPYvlSA1gMC5CuO820v-~wZawwSMge-e57ivk7WXqdPSAfBw__&Key-Pair-Id=APKAIE5G5CRDK6RD3PGA)
Healthy hematopoietic cell clusters and increased vascular leakiness in leukemic mice. (A) Representative frames from time-lapse IVM of calvarium BM in healthy (left) and AML-burdened (right) Flk1-GFP mice. Green: ECs. Red: mTomato+ healthy hematopoietic cells. AML cells are not shown. Arrows point at circulating healthy cells (left) or cell clusters (right). (B) Quantification of circulating healthy single cells and clusters in healthy and AML-burdened mice in 3–hour-long timelapse images. Data pooled from 5 healthy and 4 leukemic mice from 3 independent experiments. Eight fields of view were imaged simultaneously per mouse. (C) Percentage of doublets and cell clusters in peripheral blood (PB) of healthy and AML-burdened mice. Data obtained from 15 healthy and 25 leukemic mice from 3 independent experiments. (D) Vascular leakiness was assessed by time-lapse IVM of randomly selected regions within the calvarium of Flk1-GFP mice following administration of TRITC-dextran. Representative frames selected from 3 healthy and 4 leukemic (<10% AML blood infiltration) mice are shown. AML cells are not shown. (E) Quantification of the fold change in TRITC-dextran intensity in the BM parenchyma of healthy and early infiltrated (<10% AML blood infiltration) leukemic mice. n = 3 control and 4 leukemic mice, 3 areas measured/mice (eg, white boxes in [D]). (F) Quantification of average vessel diameter in healthy vs early infiltrated mice, with vessels measured in 3 fields of view/mice. n = 5 mice/condition. (G) Gene expression heatmap for MMP-8, MMP-9, and MMP-19 for AML cells and GMPs. n = 9 control and n = 9 leukemic mice. (H) Stroma and hematopoietic cell types expressing MMPs in healthy murine BM based on published single-cell RNAseq datasets. Circle size and color represent the proportion of expressing cells within the population, and average expression, respectively. All scale bars represent 80 µm. All data are mean ± SEM. **P < .01; ***P < .001; NS, not significant. P values determined by t tests.
Healthy hematopoietic cell clusters and increased vascular leakiness in leukemic mice. (A) Representative frames from time-lapse IVM of calvarium BM in healthy (left) and AML-burdened (right) Flk1-GFP mice. Green: ECs. Red: mTomato+ healthy hematopoietic cells. AML cells are not shown. Arrows point at circulating healthy cells (left) or cell clusters (right). (B) Quantification of circulating healthy single cells and clusters in healthy and AML-burdened mice in 3–hour-long timelapse images. Data pooled from 5 healthy and 4 leukemic mice from 3 independent experiments. Eight fields of view were imaged simultaneously per mouse. (C) Percentage of doublets and cell clusters in peripheral blood (PB) of healthy and AML-burdened mice. Data obtained from 15 healthy and 25 leukemic mice from 3 independent experiments. (D) Vascular leakiness was assessed by time-lapse IVM of randomly selected regions within the calvarium of Flk1-GFP mice following administration of TRITC-dextran. Representative frames selected from 3 healthy and 4 leukemic (<10% AML blood infiltration) mice are shown. AML cells are not shown. (E) Quantification of the fold change in TRITC-dextran intensity in the BM parenchyma of healthy and early infiltrated (<10% AML blood infiltration) leukemic mice. n = 3 control and 4 leukemic mice, 3 areas measured/mice (eg, white boxes in [D]). (F) Quantification of average vessel diameter in healthy vs early infiltrated mice, with vessels measured in 3 fields of view/mice. n = 5 mice/condition. (G) Gene expression heatmap for MMP-8, MMP-9, and MMP-19 for AML cells and GMPs. n = 9 control and n = 9 leukemic mice. (H) Stroma and hematopoietic cell types expressing MMPs in healthy murine BM based on published single-cell RNAseq datasets. Circle size and color represent the proportion of expressing cells within the population, and average expression, respectively. All scale bars represent 80 µm. All data are mean ± SEM. **P < .01; ***P < .001; NS, not significant. P values determined by t tests.
Flow cytometry analysis of PB performed at the end of IVM sessions confirmed a higher proportion of cell doublets and clusters in circulation in leukemic mice (Figure 1C). Longitudinal flow cytometry analysis of the PB of AML-burdened mice did not highlight increasing numbers of healthy cells in circulation as disease progressed (supplemental Figure 1B-C); however, the mice developed splenomegaly that was driven not only by AML growth proportional to BM infiltration but also by a dramatic increase in healthy cell numbers (supplemental Figure 1D-E). Lineage- cells decreased in BM as AML grew, consistent with previously reported progressive loss of all healthy cells from the BM of leukemic mice,7,13 and we could detect increasing numbers of lineage- cells in PB and spleen of leukemic mice (supplemental Figure 1F-H). These data indicate that healthy cells are displaced from the BM parenchyma into circulation and toward sites of extramedullary hematopoiesis during AML growth, providing a mechanism for the ousting of healthy cells from BM.
Given these observations, and because AML cells are known to grow in foci where BM stroma is locally remodeled,7 we hypothesized that healthy cell displacement might result from a combination of microenvironment disruption and physical displacement toward vessels. We selected MMPs as a likely candidate driver of this mechanism because they are involved in ECM remodeling,16,35 ECM alterations are important in solid cancer progression and invasion,16,36 and MMPs have altered expression and/or function in several cancers,37 including leukemia.38-40 Moreover, MMPs contribute to regulating vascular permeability,41 and increased BM vascular leakiness in mice fully infiltrated by AML has been reported.6 Interestingly, we could measure increased BM vascular leakiness in mice already at early disease stages (<10% PB infiltration) (Figure 1D-E; supplemental Video 3), while vessel diameter remained unchanged (Figure 1F). This suggested that early vascular leakiness may contribute to the observed intravasation of healthy cell clusters. When we analyzed a transcriptomic dataset that we previously generated,7 we identified that murine AML cells express significantly higher levels of multiple MMPs compared with healthy granulocyte/monocyte progenitors (GMPs), which they derive from and resemble phenotypically (Figure 1G; supplemental Figure 2A). Because both innate immune and stroma cells are known to express MMPs, we analyzed published transcriptomic datasets31,32 to pinpoint whether AML cells may become the main producers of MMPs in the BM or if they could take advantage of environment-derived MMPs. Interestingly, we could identify that neutrophils, adipo-CAR and osteo-CAR leptin receptor (LepR)+ stroma, fibroblasts, and NG2+ mesenchymal cells are responsible for the production of the main MMPs in healthy BM and that AML growth induces limited changes in MMP expression in stroma cells (Figure 1H; supplemental Figure 2B). This indicated that AML cells could either remodel the BM microenvironment through the expression of their own MMP set or take advantage of microenvironment-derived MMPs, suggesting that MMP inhibition could be beneficial in the context of AML.
Prinomastat reduces circulating healthy cell clusters and rescues vascular leakiness
To establish a proof of principle that MMPs could be potential therapeutic targets for AML, we decided to test the effect of treating mice with the broad MMP inhibitor prinomastat (AG3340), which targets multiple MMPs, including MMP9 (upregulated in our murine AML cells and neutrophils) and stroma-derived MMP2, 13, and 14. Because the near-complete loss of healthy stroma and hematopoietic cells in mice fully infiltrated with MLL-AF9 AML are well known,7,11-13 we tested whether AML or healthy/stroma cells would be the main source of MMPs in diseased mice by performing qPCR analysis of whole BM samples from healthy and heavily leukemic (BM infiltration >90%) mice. Expression levels of the 4 MMPs targeted by prinomastat were higher in healthy animals and lower in fully infiltrated animals (supplemental Figure 2C), suggesting that both AML- and microenvironment-derived MMPs could be targeted. Mice received prinomastat or phosphate-buffered saline (PBS) daily for 2 weeks starting from day 7 after AML blasts injection (when healthy hematopoietic and stroma cell loss is not prominent yet) and were analyzed during and at the end of treatment (Figure 2A). The treatment did not impact mouse weight or cause any visible signs of toxicity in leukemic or healthy mice (Figure 2B; supplemental Figure 3, respectively).
![Prinomastat reduces circulating healthy cell clusters and rescues vascular leakiness. (A) Schematic of the prinomastat treatment regime adopted and timing of IVM and flow cytometry analyses. (B) Total body weights of vehicle and prinomastat-treated AML-burdened mice throughout the experiment. (C) Selected, representative timeframes of time-lapse IVM showing YFP+ AML blasts (green) and circulating mTomato+ healthy hematopoietic cells (red) in vehicle- and prinomastat-treated leukemic mice. Blood vessels are stained with Alexa647 anti-VE–cadherin antibody, resulting in purple staining of tomato+ endothelial cells. Arrowheads point at clusters of healthy cells in vehicle-treated and single cells in prinomastat-treated leukemic mice, respectively. Scale bar represents 25 µm. (D) Quantification of circulating healthy single cells and clusters in vehicle- and prinomastat-treated leukemic mice. Shown are average numbers of cells/clusters detected per FoW in 3–hour-long (3 min time frame) time-lapse datasets. *P < .05. Data pooled from 11 mice in total from 3 independent experiments. (E) Vascular leakiness was assessed by time-lapse IVM of randomly selected regions within the calvarium of leukemic Flk1-GFP mice following administration of TRITC-dextran IV. Selected representative frames from vehicle- and prinomastat-treated leukemic mice (n = 6 mice/condition) are shown. AML cells are not shown. Scale bar represents 80 µm. (F) Quantification of the fold change in TRITC-dextran intensity in the BM parenchyma of vehicle- and prinomastat-treated mice. n = 6 vehicle- and n = 6 prinomastat-treated, leukemic mice. Three areas measured/mice (eg, white boxes in [E]). (G) VEGF levels (pg/mL) measured by ELISA in the BM supernatant of healthy (n = 5 mice per condition) and (H) leukemic mice treated with vehicle or prinomastat. (I) Quantification of the absolute number of endothelial cells in healthy control and vehicle and prinomastat treated AML-burdened mice. Data pooled from 21 mice from 2 independent experiments. (J) Quantification of CellROX+ endothelial cells in healthy control and vehicle and prinomastat-treated mice. n = 8 per condition. All data are mean ± SEM. *P < .05; **P < .01; ***P < .001; ns, not significant. P values determined by multiple Student t tests with posthoc Holm-Sidak corrections.](https://ash.silverchair-cdn.com/ash/content_public/journal/bloodadvances/6/10/10.1182_bloodadvances.2021004321/7/m_advancesadv2021004321f2.png?Expires=1765910746&Signature=sqQya0~kxVSIcDMAuqv5SJPFZLMmtuVBJP1A~y2If~U~X2YbfVlJ5sD1Met4NeUDT~sG1xnRnQpRlT8RlQbd-4GCXpuuor5fZ9k5~PR2KfTtzGrlikRIZuXVy-nh~c8U3DZXdHY5HmZAPfk83fNiQanoPJNqA40bblhVKpKviCk4dNBTy2glReVLM-DeokqzN5utm6dbRTH7wNrn1BEuaPJ2E9fB2zO0lKZ338eRTbhkkOIf2LRC96dSv-MIXyOVpoL6RARtrstsOwEcNfU1Oei-J-Y8NIxodiFA8zXgPjLxPSNSjAAoBIM2B1pVRPTXL-VEN3u0Z7EDYHiM10N8Jg__&Key-Pair-Id=APKAIE5G5CRDK6RD3PGA)
Prinomastat reduces circulating healthy cell clusters and rescues vascular leakiness. (A) Schematic of the prinomastat treatment regime adopted and timing of IVM and flow cytometry analyses. (B) Total body weights of vehicle and prinomastat-treated AML-burdened mice throughout the experiment. (C) Selected, representative timeframes of time-lapse IVM showing YFP+ AML blasts (green) and circulating mTomato+ healthy hematopoietic cells (red) in vehicle- and prinomastat-treated leukemic mice. Blood vessels are stained with Alexa647 anti-VE–cadherin antibody, resulting in purple staining of tomato+ endothelial cells. Arrowheads point at clusters of healthy cells in vehicle-treated and single cells in prinomastat-treated leukemic mice, respectively. Scale bar represents 25 µm. (D) Quantification of circulating healthy single cells and clusters in vehicle- and prinomastat-treated leukemic mice. Shown are average numbers of cells/clusters detected per FoW in 3–hour-long (3 min time frame) time-lapse datasets. *P < .05. Data pooled from 11 mice in total from 3 independent experiments. (E) Vascular leakiness was assessed by time-lapse IVM of randomly selected regions within the calvarium of leukemic Flk1-GFP mice following administration of TRITC-dextran IV. Selected representative frames from vehicle- and prinomastat-treated leukemic mice (n = 6 mice/condition) are shown. AML cells are not shown. Scale bar represents 80 µm. (F) Quantification of the fold change in TRITC-dextran intensity in the BM parenchyma of vehicle- and prinomastat-treated mice. n = 6 vehicle- and n = 6 prinomastat-treated, leukemic mice. Three areas measured/mice (eg, white boxes in [E]). (G) VEGF levels (pg/mL) measured by ELISA in the BM supernatant of healthy (n = 5 mice per condition) and (H) leukemic mice treated with vehicle or prinomastat. (I) Quantification of the absolute number of endothelial cells in healthy control and vehicle and prinomastat treated AML-burdened mice. Data pooled from 21 mice from 2 independent experiments. (J) Quantification of CellROX+ endothelial cells in healthy control and vehicle and prinomastat-treated mice. n = 8 per condition. All data are mean ± SEM. *P < .05; **P < .01; ***P < .001; ns, not significant. P values determined by multiple Student t tests with posthoc Holm-Sidak corrections.
Prinomastat reduces circulating healthy cell clusters and rescues vascular leakiness. (A) Schematic of the prinomastat treatment regime adopted and timing of IVM and flow cytometry analyses. (B) Total body weights of vehicle and prinomastat-treated AML-burdened mice throughout the experiment. (C) Selected, representative timeframes of time-lapse IVM showing YFP+ AML blasts (green) and circulating mTomato+ healthy hematopoietic cells (red) in vehicle- and prinomastat-treated leukemic mice. Blood vessels are stained with Alexa647 anti-VE–cadherin antibody, resulting in purple staining of tomato+ endothelial cells. Arrowheads point at clusters of healthy cells in vehicle-treated and single cells in prinomastat-treated leukemic mice, respectively. Scale bar represents 25 µm. (D) Quantification of circulating healthy single cells and clusters in vehicle- and prinomastat-treated leukemic mice. Shown are average numbers of cells/clusters detected per FoW in 3–hour-long (3 min time frame) time-lapse datasets. *P < .05. Data pooled from 11 mice in total from 3 independent experiments. (E) Vascular leakiness was assessed by time-lapse IVM of randomly selected regions within the calvarium of leukemic Flk1-GFP mice following administration of TRITC-dextran IV. Selected representative frames from vehicle- and prinomastat-treated leukemic mice (n = 6 mice/condition) are shown. AML cells are not shown. Scale bar represents 80 µm. (F) Quantification of the fold change in TRITC-dextran intensity in the BM parenchyma of vehicle- and prinomastat-treated mice. n = 6 vehicle- and n = 6 prinomastat-treated, leukemic mice. Three areas measured/mice (eg, white boxes in [E]). (G) VEGF levels (pg/mL) measured by ELISA in the BM supernatant of healthy (n = 5 mice per condition) and (H) leukemic mice treated with vehicle or prinomastat. (I) Quantification of the absolute number of endothelial cells in healthy control and vehicle and prinomastat treated AML-burdened mice. Data pooled from 21 mice from 2 independent experiments. (J) Quantification of CellROX+ endothelial cells in healthy control and vehicle and prinomastat-treated mice. n = 8 per condition. All data are mean ± SEM. *P < .05; **P < .01; ***P < .001; ns, not significant. P values determined by multiple Student t tests with posthoc Holm-Sidak corrections.
IVM analyses indicated that prinomastat-treated mice had fewer and smaller healthy cell clusters and more single cells in circulation than PBS-treated mice (Figure 2C-D; supplemental Videos 4 and 5). Longitudinal flow cytometry analysis of PB of treated mice indicated the same trend and a significant difference at some of the time points analyzed (supplemental Figure 4A). Moreover, vascular leakiness was significantly reduced (Figure 2E-F; supplemental Figure 4B; supplemental Video 6), with prinomastat-treated mice showing dextran extravasation rates similar to those of healthy controls (Figure 1E). Specific analysis of BM areas with higher and lower local AML infiltration indicated the former benefited most from treatment (supplemental Figure 4C-D). This suggested that prinomastat treatment rescues vascular leakiness in the context of AML, and this correlates with reduced intravasation of cell clusters. Prinomastat treatment reduces vascular endothelial growth factor (VEGF) levels in solid cancers.42 AML cells produce VEGF, leading to failed angiogenesis7 and increased vascular permeability.6 In our experiments, prinomastat did not affect VEGF levels in BM tissue of either healthy or leukemic mice (Figure 2G-H), nor endothelial cell (EC) numbers (Figure 2I; supplemental Figure 3E-G); however, it reduced reactive oxygen species (ROS) levels (a factor recently linked to increased BM vascular leakiness6,43 ) to healthy levels in ECs (Figure 2J).
Multiple effects of prinomastat on leukemic blasts in the BM
Next, we asked whether prinomastat affects AML cells. IVM tilescans indicated the BM of prinomastat-treated mice contained fewer leukemic cells (Figure 3A-B), and reduced BM infiltration was confirmed by flow cytometry analysis of long bones harvested immediately following IVM (Figure 3C). AML blast infiltration in the PB of prinomastat- and PBS-treated animals was similar (Figure 3D); however, when cohorts of mice were analyzed 2 days and 1 week after the end of prinomastat treatment, the number of AML cells in the BM was still reduced, even though the gap between the number of AML cells in vehicle- and prinomastat-treated mice was diminishing (Figure 3E-G). AML cell proliferation was reduced, and apoptosis increased (Figure 3H-I), and consistent with this, spleen infiltration remained reduced at day 26 (Figure 3J). To understand whether MMP inhibition could have a direct effect on AML cells, we cultured primary MLL-AF9 cells in the absence or presence of increasing concentrations of prinomastat and observed reduced growth at higher concentrations (Figure 3K).

Multiple effects of prinomastat on leukemic blasts in the BM. (A) Representative tilescan maximum projections of calvarium BM of PBS- and prinomastat-treated AML-burdened mice. Red: mTomato+ healthy hematopoietic cells; green: YFP+ AML cells; gray: bone collagen. Scale bar represents 500 µm. (B) Mean gray value quantification of YFP signal (AML) within the calvarium BM of vehicle- and prinomastat-treated leukemic mice. n = 3 per condition. (C) AML cells number in long bones (femur) and calvaria of vehicle/prinomastat-treated AML-burdened mice immediately post IVM (day 16). n = 5 mice per condition. (D) Percentage of AML blasts measured in the PB of vehicle- and prinomastat-treated mice throughout disease progression. n = 16 mice per group. (E) Number of AML cells in the BM at 2 days after prinomastat treatment (day 23). n = 5 mice/group. (F) The number of AML and (G) healthy cells in the long bones of vehicle- and prinomastat-treated leukemic mice measured 5 days after prinomastat treatment (day 26). Each dot represents 1 mouse. n = 20 vehicle-treated and 20 prinomastat-treated mice pooled from 3 independent experiments. (H) The proportion of proliferating (EdU+) and (I) apoptotic/dead (annexin V+) AML blasts in the BM of PBS- and prinomastat-treated mice. n = 4 and 5 mice per group, respectively. (J) AML spleen infiltration of vehicle- and prinomastat-treated AML-burdened mice. n = 12 PBS- and 12 prinomastat-treated mice. (K) Growth curve showing the effect of prinomastat on AML cells proliferation in vitro. Data pooled from 3 independent experiments. All data are mean ± SEM. *P < .05; ***P < .001; ****P < .0001; ns, not significant. P values are determined by Student t tests.
Multiple effects of prinomastat on leukemic blasts in the BM. (A) Representative tilescan maximum projections of calvarium BM of PBS- and prinomastat-treated AML-burdened mice. Red: mTomato+ healthy hematopoietic cells; green: YFP+ AML cells; gray: bone collagen. Scale bar represents 500 µm. (B) Mean gray value quantification of YFP signal (AML) within the calvarium BM of vehicle- and prinomastat-treated leukemic mice. n = 3 per condition. (C) AML cells number in long bones (femur) and calvaria of vehicle/prinomastat-treated AML-burdened mice immediately post IVM (day 16). n = 5 mice per condition. (D) Percentage of AML blasts measured in the PB of vehicle- and prinomastat-treated mice throughout disease progression. n = 16 mice per group. (E) Number of AML cells in the BM at 2 days after prinomastat treatment (day 23). n = 5 mice/group. (F) The number of AML and (G) healthy cells in the long bones of vehicle- and prinomastat-treated leukemic mice measured 5 days after prinomastat treatment (day 26). Each dot represents 1 mouse. n = 20 vehicle-treated and 20 prinomastat-treated mice pooled from 3 independent experiments. (H) The proportion of proliferating (EdU+) and (I) apoptotic/dead (annexin V+) AML blasts in the BM of PBS- and prinomastat-treated mice. n = 4 and 5 mice per group, respectively. (J) AML spleen infiltration of vehicle- and prinomastat-treated AML-burdened mice. n = 12 PBS- and 12 prinomastat-treated mice. (K) Growth curve showing the effect of prinomastat on AML cells proliferation in vitro. Data pooled from 3 independent experiments. All data are mean ± SEM. *P < .05; ***P < .001; ****P < .0001; ns, not significant. P values are determined by Student t tests.
To better understand what mechanisms could contribute to reduced AML growth, we set up a number of detailed IVM analyses, starting with a deeper characterization of untreated AML cells in situ. Here, we noticed that while most AML cells have a round morphology and, consistent with previous observations,44 appear to slowly diffuse across the BM parenchyma, we would consistently observe a significant proportion of AML cells with a complex and highly dynamic morphology, which we refer to as “explorative cells” because we often found them moving between healthy cells (Figure 4A,A’,A”; supplemental Video 7). Rose plots of tracks of nonexplorative and explorative cells highlighted differences between the movement of the 2 cell types (Figure 4B), and quantitative analysis demonstrated that explorative cells typically generate longer tracks, move further, are faster, and exhibit a more directional movement than the remaining bulk, nonexplorative AML cells (Figure 4C). Moreover, explorative cells are larger and have a more complex, less circular, and more dynamic morphology, while nonexplorative cells tend to be round and slower (Figure 4D; supplemental Figure 5). Finally, explorative cells presented on average a higher diffusion coefficient than nonexplorative cells (Figure 4E) and were approximately 10% of all AML cells analyzed per field of view in mice at intermediate levels of BM infiltration (Figure 4F).
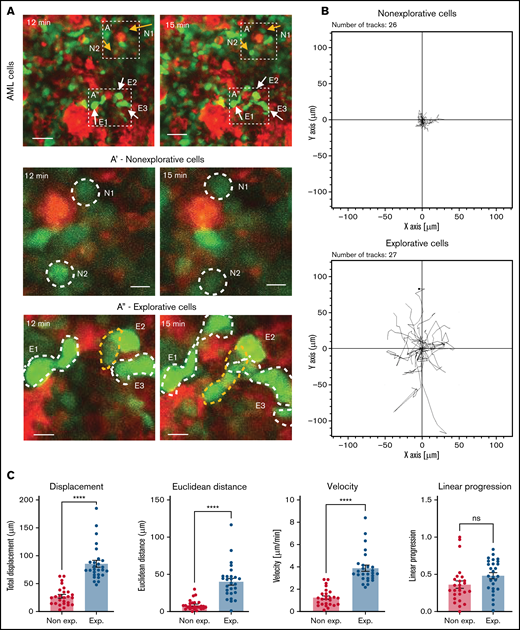
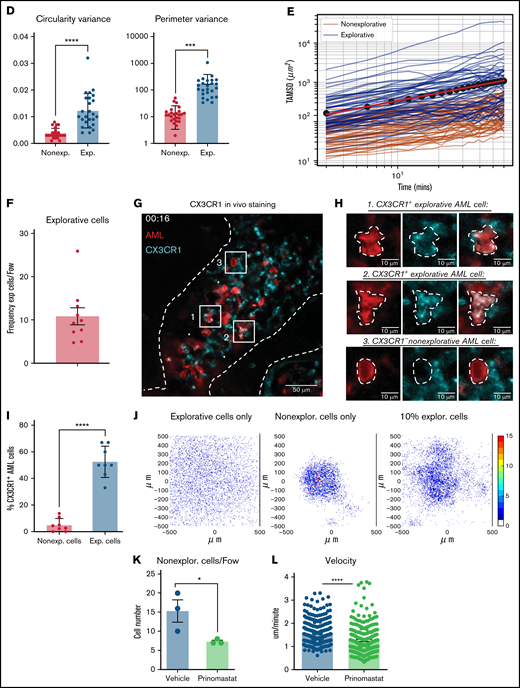
IVM identifies subsets of AML cells affected by MMP inhibition. (A) Selected frames from representative time-lapse IVM of BM calvarium with intermediate infiltration. Red: mTomato+ healthy hematopoietic cells; green: YFP+ AML cells. White and yellow arrows: examples of explorative and nonexplorative cells, respectively. Boxed areas are shown at higher magnification in A’ and A”, where nonexplorative and explorative cells’ morphology is highlighted by dashed lines. Scale bars represent 80 µm in A and 25 µm in A’ and A”. (B) Rose plots showing tracks of nonexplorative and explorative AML cells. n = 26 nonexplorative and n = 27 explorative AML cells. (C) Quantification of displacement (track length), Euclidean distance (distance from track start to end points), velocity, linear progression, and (D) circularity and perimeter variance of nonexplorative and explorative cells. n = 27 explorative cells and n = 26 nonexplorative cells pooled from 8 fields of view from 3 mice in 2 independent experiments. (E) Diffusion coefficient of explorative (blue lines) and nonexplorative (orange lines) cells represented as TAMSD. Red lines are the fit by ordinary least square of the mean of all trajectories (black dots). (F) Frequency of explorative cells observed per field of view. n = 10 FoWs from 4 mice from 3 independent experiments. (G) Selected, representative timeframe of time-lapse IVM showing mTomato+ AML blasts (red) and in vivo immunostaining for CX3CR1 (turquoise). Scale bar represents 50 µm. (H) Boxed areas in (G) shown at higher resolution are examples of CX3CR1+ explorative and CX3CR1- nonexplorative AML cells (scale bar = 10 µm). (I) Percentage of CX3CR1+ explorative and nonexplorative AML cells per field of view analyzed. n = 8 fields of view pooled from 3 mice. (J) Simulation results when each field of view is initially seeded by 2 adjacent cells, and progeny is generated according to available proliferation rates. Left: all cells are explorative. Middle: all cells are nonexplorative. Right: 10% of cells are explorative. (K) Quantification of explorative and nonexplorative AML cells in vehicle- and prinomastat-treated leukemic mice in the calvarium BM. n = 3 mice per condition. (L) Average velocity of AML blasts in calvarium BM of PBS- and prinomastat-treated AML-burdened mice. n = 338 and n = 293 cells per group, pooled from n = 3 mice per group from 2 independent experiments. All data are mean ± SEM. *P < .05; **P < .001; ***P < .0001; ns, not significant. P values determined by Student t tests. TAMSD, time-averaged mean square displacement.
IVM identifies subsets of AML cells affected by MMP inhibition. (A) Selected frames from representative time-lapse IVM of BM calvarium with intermediate infiltration. Red: mTomato+ healthy hematopoietic cells; green: YFP+ AML cells. White and yellow arrows: examples of explorative and nonexplorative cells, respectively. Boxed areas are shown at higher magnification in A’ and A”, where nonexplorative and explorative cells’ morphology is highlighted by dashed lines. Scale bars represent 80 µm in A and 25 µm in A’ and A”. (B) Rose plots showing tracks of nonexplorative and explorative AML cells. n = 26 nonexplorative and n = 27 explorative AML cells. (C) Quantification of displacement (track length), Euclidean distance (distance from track start to end points), velocity, linear progression, and (D) circularity and perimeter variance of nonexplorative and explorative cells. n = 27 explorative cells and n = 26 nonexplorative cells pooled from 8 fields of view from 3 mice in 2 independent experiments. (E) Diffusion coefficient of explorative (blue lines) and nonexplorative (orange lines) cells represented as TAMSD. Red lines are the fit by ordinary least square of the mean of all trajectories (black dots). (F) Frequency of explorative cells observed per field of view. n = 10 FoWs from 4 mice from 3 independent experiments. (G) Selected, representative timeframe of time-lapse IVM showing mTomato+ AML blasts (red) and in vivo immunostaining for CX3CR1 (turquoise). Scale bar represents 50 µm. (H) Boxed areas in (G) shown at higher resolution are examples of CX3CR1+ explorative and CX3CR1- nonexplorative AML cells (scale bar = 10 µm). (I) Percentage of CX3CR1+ explorative and nonexplorative AML cells per field of view analyzed. n = 8 fields of view pooled from 3 mice. (J) Simulation results when each field of view is initially seeded by 2 adjacent cells, and progeny is generated according to available proliferation rates. Left: all cells are explorative. Middle: all cells are nonexplorative. Right: 10% of cells are explorative. (K) Quantification of explorative and nonexplorative AML cells in vehicle- and prinomastat-treated leukemic mice in the calvarium BM. n = 3 mice per condition. (L) Average velocity of AML blasts in calvarium BM of PBS- and prinomastat-treated AML-burdened mice. n = 338 and n = 293 cells per group, pooled from n = 3 mice per group from 2 independent experiments. All data are mean ± SEM. *P < .05; **P < .001; ***P < .0001; ns, not significant. P values determined by Student t tests. TAMSD, time-averaged mean square displacement.
To identify whether there were phenotypic differences between nonexplorative and explorative cells, we performed a series of in vivo immunostainings. CD11c, CXCR4, and F4/80 antibodies labeled only nonexplorative cells, and c-Kit antibody labeled mostly nonexplorative cells and only very rarely, and not consistently, explorative cells. All antibodies labeled clearly identifiable healthy cells (not shown). Instead, the CXC3CR1 antibody consistently labeled ∼50% of explorative cells and only ∼5% of nonexplorative cells (Figure 4G-I; supplemental Video 7). To identify a potential role for explorative cells in AML growth across BM space and test whether the induction of vascular leakiness may be necessary to sustain AML spread, we used a data-driven toy model representing AML growth within an area of BM of approximately equal size as a typical field of view. In the model, dots represented AML cells migrating according to the diffusion coefficients measured here and proliferating at the rate we measured in a previous study.13 Cells could migrate beyond the edges of the area observed but could not disappear or be introduced, exemplifying the absence of intravasation/extravasation through more/less leaky vasculature.
All simulations started with 2 adjacent cells in the middle of the field of view, and independently of the proportion of explorative/nonexplorative cells within the model, it was clear that long-range migration mediated by intra- and extravasation was not necessary to occupy the field of view at a rate compatible with our in situ observations. However, when all cells in the model were explorative, a homogeneous and less dense spread was achieved, very different from the very localized patches we observed in situ (Figure 4J, left). Having uniquely nonexplorative cells generated the densest patches (Figure 4J, middle), and the introduction of 10% of cells with explorative behavior led to the generation of irregular patches most similar to the ones we observed (Figure 4J, right). Examples of entire simulations are shown in supplemental Video 8. Interestingly, prinomastat reduced both the overall speed of AML cells and the number of explorative cells (Figure 4K-L), indicating that both types of cells were affected by the treatment. Altogether, our data demonstrate that prinomastat treatment affects not only BM vascular leakiness but also the leukemia cells.
Prinomastat protects healthy HSPCs
Given the effects of prinomastat on both vasculature and AML cells, we hypothesized that MMP inhibition might have a protective effect on residual HSPC populations too. First, we confirmed that prinomastat treatment on healthy mice did not affect HSPC populations (supplemental Figure 3B-C). Next, we measured the absolute numbers of various HSPC populations in healthy, leukemic, and prinomastat-treated leukemic mice. Because HSPC numbers are affected by AML infiltration itself, we selected PBS- and prinomastat-treated mice that had over 70% BM infiltration. While healthy mice had the largest HSPC populations, prinomastat-treated mice showed higher numbers of residual long-term hematopoietic stem cells (HSCs) (phenotypically defined as lineage-c-Kit+Sca-1+[LKS]CD48-CD150+), multipotent progenitor cells (LKS CD48+CD150- and CD150+), common myeloid progenitors (lineage-c-Kit+Sca-1-CD34+CD16/32-), GMPs (lineage-c-Kit+Sca-1-CD34+CD16/32+), megakaryocyte and erythroid progenitors (lineage-c-Kit+Sca-1-CD34-CD16/32-), and overall lineage- cells (Figure 5A-E). Only short-term HSC (LKS CD48-CD150-) numbers were more variable (Figure 5A-C). Consistent with the unchanged number of total healthy cells previously observed in the BM of leukemic mice treated with prinomastat or PBS (Figure 3G), both groups of mice had similar numbers of PB red blood cells, reticulocytes, platelets, and white blood cells (supplemental Figure 4E). HSPC maintenance within the marrow is mediated by multiple niche-derived molecules, and to test whether HSPC retention was mediated by prinomastat-induced changes in cytokine levels, we performed a number of ELISA assays on BM supernatant samples from healthy, leukemic, and prinomastat-treated mice. Prinomastat treatment did not affect the levels of CXCL12, TGFb1, CXCL4, SCF1, or TPO, and all these cytokines appeared to be similarly reduced in all leukemic mice irrespective of treatment, compared with healthy mice (Figure 5F). Together, our data suggest that the positive effect of prinomastat on the retention of HSPCs in their natural microenvironments is likely mediated by a combination of the effects on ECM remodeling/vasculature permeability and the dynamics of AML cells, rather than by changes to the cytokine milieu.
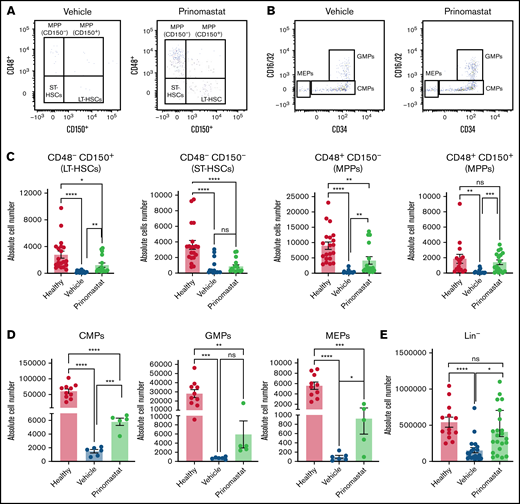
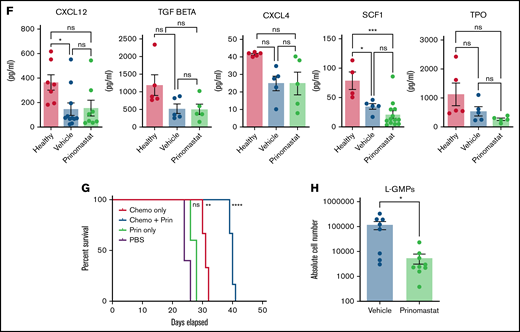
Prinomastat protects healthy HSPCs and, combined with chemotherapy, increases survival. (A-B) Flow cytometry plots showing LKS and Lin- cKit+ Sca-1- cell populations in leukemic mice that received PBS or prinomastat, and with >70% BM infiltration. (C) Absolute number of LT-HSCs, ST-HSCs, and MPP populations per leg in healthy and leukemic, PBS- or prinomastat-treated mice. (D) Absolute number of CMPs, GMPs, MEPs per leg in healthy and leukemic, PBS- or prinomastat-treated mice. (E) Absolute number of lineage- cells per leg in healthy and leukemic, PBS- or prinomastat-treated mice. (C-E) n = 5-22 mice per condition pooled from up to 5 independent experiments. (F) CXCL12, TGF-β, CXCL4, SCF1, TPO levels (pg/mL) measured in BM supernatant from healthy control, vehicle- and prinomastat-treated leukemic mice by ELISA. Each dot represents 1 mouse. n = ≥3 per condition for each of the tested factors. (G) Kaplan-Meyer curve showing survival of mice receiving chemotherapy alone, prinomastat alone, prinomastat in combination with chemotherapy, or vehicle control (PBS). n = 6 for chemotherapy only and chemotherapy + prinomastat groups. n = 5 for prinomastat and PBS only groups. (H) Absolute number of L-GMPs within the BM of vehicle- and prinomastat-treated leukemic mice (day 23). n = 8 vehicle-treated and n = 9 prinomastat-treated AML burdened mice. Data are shown as mean ± SEM. *P < .05; **P < .01; ***P < .001; ****P < .0001; ns, not significant. P values determined using multiple Student t tests with posthoc Holm-Sidak corrections or 1-way ANOVA and the log-rank test in (G).
Prinomastat protects healthy HSPCs and, combined with chemotherapy, increases survival. (A-B) Flow cytometry plots showing LKS and Lin- cKit+ Sca-1- cell populations in leukemic mice that received PBS or prinomastat, and with >70% BM infiltration. (C) Absolute number of LT-HSCs, ST-HSCs, and MPP populations per leg in healthy and leukemic, PBS- or prinomastat-treated mice. (D) Absolute number of CMPs, GMPs, MEPs per leg in healthy and leukemic, PBS- or prinomastat-treated mice. (E) Absolute number of lineage- cells per leg in healthy and leukemic, PBS- or prinomastat-treated mice. (C-E) n = 5-22 mice per condition pooled from up to 5 independent experiments. (F) CXCL12, TGF-β, CXCL4, SCF1, TPO levels (pg/mL) measured in BM supernatant from healthy control, vehicle- and prinomastat-treated leukemic mice by ELISA. Each dot represents 1 mouse. n = ≥3 per condition for each of the tested factors. (G) Kaplan-Meyer curve showing survival of mice receiving chemotherapy alone, prinomastat alone, prinomastat in combination with chemotherapy, or vehicle control (PBS). n = 6 for chemotherapy only and chemotherapy + prinomastat groups. n = 5 for prinomastat and PBS only groups. (H) Absolute number of L-GMPs within the BM of vehicle- and prinomastat-treated leukemic mice (day 23). n = 8 vehicle-treated and n = 9 prinomastat-treated AML burdened mice. Data are shown as mean ± SEM. *P < .05; **P < .01; ***P < .001; ****P < .0001; ns, not significant. P values determined using multiple Student t tests with posthoc Holm-Sidak corrections or 1-way ANOVA and the log-rank test in (G).
Prinomastat increases chemotherapy efficiency by targeting L-GMPs
Next, we questioned whether prinomastat could improve AML outcomes in a clinically relevant experimental setting. We, therefore, evaluated whether prinomastat administered alongside a conventional chemotherapy regimen would improve animal survival in a small cohort of animals. Mice were treated with prinomastat as described above, and chemotherapy was administered when PB infiltration reached 15% to 18% and following a well-established and clinically relevant regimen7 (Figure 5G). PBS, prinomastat-only, and chemotherapy-only AML-burdened control groups were included in the experiment. Despite reducing leukemia growth, prinomastat treatment alone failed to substantially prolong animal survival compared with the PBS- and chemotherapy-only control groups. However, when prinomastat and chemotherapy were administered in combination, we observed a significant increase in animal survival (Figure 5G). To understand whether other mechanisms beyond vascular normalization may contribute to increasing chemotherapy efficacy, we measured the number of L-GMPs, the cell population most enriched for cells with leukemia propagating capacity in this model, 2 days following the end of prinomastat treatment. L-GMP numbers were significantly reduced by the treatment (Figure 5H), suggesting that MMP inhibition affects AML cells not only in terms of proliferation and migration but stemness too.
MMPs are dysregulated in human AML subtypes, and human AML cells are susceptible to prinomastat
To investigate whether MMP inhibition could be considered a precision medicine approach for AML, we analyzed the well-annotated, publicly available transcriptomic dataset of human adult AML samples from the “Beat-AML” program.33 First, we assessed expression levels of MMPs known to be targeted by prinomastat. While reads for MMP 3 and 13 were insufficient to allow reliable results, we found sufficient reads for MMP 2, 9, and 14 (Figure 6A-C). Next, we analyzed the expression of MMP 8 and 19 as they were expressed in our murine model (Figure 6D-E). No shared pattern of expression was evident across all AML subtypes, which reflected the well-known heterogeneity of the disease; however, multiple MMPs were upregulated compared with healthy BM hematopoietic cells in specific AML subtypes, in either all or some of the patients analyzed. For example, MMP2 was upregulated in all subtypes except MLL-AF9 (Figure 6A), MMP14 was upregulated in MLL-AF9, CBFB-MYH11, and PML-RARalpha rearranged leukemias and in some patients with NPM1 and NPM1/Flt3 mutations (Figure 6C). MMP19 was upregulated in most patients across all AML subtypes (Figure 6E). Finally, MMP8 and MMP9 were downregulated in most samples analyzed (Figure 6B,D), which is consistent with our qPCR data on whole BM samples from MLL-AF9 leukemic mice.

MMPs in human AML subtypes. (A-E) A total of 92 adult patients from the Beat-AML program27 were further categorized on the basis of leukemia-associated genetic driver lesions (red box: MLL-KMT2A subgroup, n = 8; blue box: NPM1-mutated subgroup, n = 32; green box: NPM1–FLT3-mutated subgroup, n = 23; purple box: CBFB-MYH11 subgroup, n = 11; orange box: PML-RARα subgroup, n = 12; yellow box: RUNX1-RUNX1T1 subgroup, n = 6). Transcriptomic data from BM-MNC of 20 healthy individuals (brown box) were selected from the same dataset and included in the analysis for comparison. MMPs’ gene expression levels (A-E) were represented by means of Log2 (FPKM) values. (F) Effect of prinomastat treatment on HL60 human AML cells growth in vitro. Data pooled from 3 independent experiments. (G) Frequency and (H) absolute number of HL60 AML cells and (I) number of overall live cells in the BM of vehicle- and prinomastat-treated NSG mice. Data are shown as mean ± SEM. *P < .05; ns, not significant. P values determined using Student t tests. BM-MNC, bone marrow mononuclear cells.
MMPs in human AML subtypes. (A-E) A total of 92 adult patients from the Beat-AML program27 were further categorized on the basis of leukemia-associated genetic driver lesions (red box: MLL-KMT2A subgroup, n = 8; blue box: NPM1-mutated subgroup, n = 32; green box: NPM1–FLT3-mutated subgroup, n = 23; purple box: CBFB-MYH11 subgroup, n = 11; orange box: PML-RARα subgroup, n = 12; yellow box: RUNX1-RUNX1T1 subgroup, n = 6). Transcriptomic data from BM-MNC of 20 healthy individuals (brown box) were selected from the same dataset and included in the analysis for comparison. MMPs’ gene expression levels (A-E) were represented by means of Log2 (FPKM) values. (F) Effect of prinomastat treatment on HL60 human AML cells growth in vitro. Data pooled from 3 independent experiments. (G) Frequency and (H) absolute number of HL60 AML cells and (I) number of overall live cells in the BM of vehicle- and prinomastat-treated NSG mice. Data are shown as mean ± SEM. *P < .05; ns, not significant. P values determined using Student t tests. BM-MNC, bone marrow mononuclear cells.
These data indicate that MMP expression is deregulated in AML, with unique patterns associated with disease subtypes and even individual patients, and overexpression of MMPs is likely to contribute to human AML growth. To achieve a proof-of-principle test that MMP inhibition may be useful for AML, we worked with human AML cell lines. HL60 and OCI-AML3 cells express multiple prinomastat targets at varying levels (supplemental Figure 6A). When cultured in vitro, both cell lines showed sensitivity to prinomastat at higher concentrations (Figure 6F; supplemental Figure 6B-G). While we were unable to achieve BM engraftment of OCI-AML3 cells in NSG mice, we could assess the effect of prinomastat on HL60 cells in vivo. Following the treatment protocol we developed for WT mice injected with MLL-AF9 cells, we observed a reduction in the number of HL60 cells growing in the BM of NSG mice (Figure 6G-I) and not in their PB, as observed in the murine model (supplemental Figure 6H-K).
Discussion
The mechanisms allowing AML to outcompete healthy hematopoiesis are still not well understood, and uncovering them is key to developing improved therapies. Several studies have documented how myeloid malignancies remodel the BM microenvironment to eliminate or hijack several stroma cell types, leading to the loss of HSC niches.3 -5,45 -48 However, it is not clear whether stroma remodeling is the only mechanism driving loss of healthy hematopoiesis. Using intravital microscopy of a murine model of AML, we identified that as the malignant cells grow in the BM, clusters of healthy cells enter circulation through vasculature that becomes leaky at earlier stages than previously thought. MMPs, known to regulate extracellular matrix integrity and, as a consequence, cell anchorage and vasculature permeability, were expressed in our AML cells and the surrounding microenvironment, and treatment with the MMP inhibitor prinomastat returned vascular permeability to healthy levels and reduced the number and size of healthy cell clusters in circulation. We previously showed that protecting endosteal vessels improved chemotherapy efficacy and HSC retention in the BM,7 and here we link MMP inhibition and restored vascular function to increased survival following chemotherapy. Our findings add to the consensus around ECs being promising targets for therapeutic intervention6,7,49 in leukemia and vascular “normalization” as an important strategy when tackling multiple types of cancer.50
Functional HSCs have been linked to less permeable vessels and lower levels of ROS.43 Here, we show that avoiding vascular leakiness is linked to reduced ROS in ECs and increased retention of HSPCs in the BM. Interestingly, both reduced vascular permeability and HSPC retention could not be explained through changes in the abundance of secreted factors and cytokines known to be involved in either phenomenon. Our work indicates a tight correlation between vascular leakiness and EC ROS levels; however, it is not clear yet what molecular mechanisms lead MMP inhibition to reduce both in leukemic mice. Increased HSPC retention may be directly linked to the reduced vascular permeability and/or to differences in ECM remodeling. Integrins are important for HSC localization and function,51-53 and mechanosensing is emerging as a regulator of stem cell function.35,54,55 Both types of signals are likely playing a role in retaining HSPCs in the BM in our model. Interestingly, HSPC populations were rescued by MMP inhibition to varying degrees, consistent with the hypothesis that different HSPCs are likely to interact with and depend on specific microenvironments.
Further effects of prinomastat treatment were a reduction in AML cell migration, a slight reduction in proliferation and BM infiltration, and increased apoptosis in AML cells. It has been reported that leukemia cells grow less on stiffer, supposedly less degraded matrices,17 and our data indicate the promise of better understanding the relationship between AML cells and ECM. Moreover, our work suggests that ECM modulation is a valuable therapeutic intervention with the double effect of inhibiting AML cells while improving healthy HSPC retention, therefore skewing the competition between healthy and malignant hematopoiesis in favor of the former. Of note, not only were AML cells less migratory in prinomastat-treated mice, but the number of L-GMPs, known to be highly enriched for leukemia propagating cells, was dramatically reduced. This raises the interesting hypothesis that the link between the biophysical properties of the BM microenvironment and AML growth might extend to the regulation of hierarchical heterogeneity and stemness. Consistent with this, it has recently been shown that MMP 9 deficiency in the BM microenvironment reduces leukemia-initiating cells in BCR-ABL acute lymphoblastic leukemia.56
The use of MMPIs in cancer therapy has been investigated in solid tumors, where prinomastat reduced tumor burden and metastasis in pancreatic ductal adenocarcinoma and lung cancer, including in synergy with chemotherapy57,58 ; however, other studies generated controversial results.59 The disappointing initial trials in solid cancers indicate the importance of better understanding the combined effects of MMP inhibition on all components of the competition between healthy and malignant cells. We identified MMPs to be produced not only by AML cells but also by stroma and healthy hematopoietic cells known to be affected by AML progression. The obvious consequence of this is that MMP types and expression levels are bound to be dynamic as the disease progresses. However, we showed MMP inhibition could complement conventional AML treatment regimens to improve efficacy and overall survival. Analysis of published human AML gene expression data identified complex patterns of MMP deregulation across AML types.33 We propose that MMP inhibition should be further explored as a promising complementary therapeutic approach for AML patients with high MMP expression levels in combination with conventional induction/consolidation therapy and other more recently developed regimens.
A limitation of the present study is that we assessed proof in principle efficacy of MMP inhibition using prinomastat, a hydroxamate, broad-spectrum MMPI.60 Inhibitory antibodies have shown superior selectivity and efficacy against MMPs compared with small molecules.61 MMP-2 and MMP-14, 2 of the MMPs that we found to be consistently upregulated in AML subtypes, have already been implicated in a number of malignancies,62,63 and for this reason, have been selected as antigens to generate a number of inhibitory antibodies.61 Future studies should assess if selective inhibition of a certain MMP can be indicated for specific AML subtypes.
Acknowledgments
The authors thank the staff of the core facilities at Imperial College London (Flow Cytometry, CBS facility, Healthcare NHS Trust), the Sir Francis Crick Institute (BRF facility), and the Beatson Institute (Flow Cytometry and BRU, especially Barbara Ann Hughes and Karen Dunn) for their valuable help. The authors are grateful to Meaad Saeed J Almowaled (Paul O’Gorman Leukaemia Research Centre, Institute of Cancer Sciences, University of Glasgow) and Ozgen Deniz (Imperial College Centre for Haematology) for sharing reagents.
Supported by Blood Cancer UK (Gordon Piller studentship to C. Pirillo), Cancer Research UK (Programme Foundation award C36195/A26770 to C.L.C. and studentship C36195/A27830 to S.G.A.), the Wellcome Trust (Ph.D. studentship 105398/Z/14/Z to M.H., Investigator award 212304/Z/18/Z to C.L.C.), BBSRC (Ph.D. studentship BB/M011178/1 to B.P.), Associazione Italiana per la Ricerca sul Cancro (AIRC IG 23604) to B.F.
Authorship
Contribution: C. Pirillo and C.L.C. conceived the project and contributed to the experimental design; C. Pirillo conducted the core experiments and data analysis; F.T., S.G.A., F.B., M.H., S.S., and C. Pospori contributed to experimental work and data analysis; A.M., V.T., and B.F. carried out the analysis of MMP expression profile in human datasets, and C. Piot in murine datasets; D.D., I.K., and E.H. identified MMP expression in murine cells; B.P. and C.F.L. determined diffusion coefficients and built the mathematical model; K.K. and E.R. contributed to in vivo experiments; and C. Pirillo and C.L.C. led the writing of the manuscript with input from all authors.
Conflict-of-interest disclosure: The authors declare no competing financial interests.
The current affiliation for M.H. is Wellcome - Medical Research Council Cambridge Stem Cell Institute, University of Cambridge, Jeffrey Cheah Biomedical Centre, Cambridge Biomedical Campus, Cambridge, United Kingdom.
Correspondence: Cristina Lo Celso, Department of Life Sciences, Sir Alexander Fleming Building, Imperial College London, London SW7 2AZ, United Kingdom; e-mail: c.lo-celso@imperial.ac.uk.

