

Key Points
Relapse-associated genetic alterations are functionally linked to drug-specific resistance.
Genetic inactivation of DNA damage repair pathway regulators enhances sensitivity to cytotoxic chemotherapy.

Abstract
The introduction of new drugs in the past years has substantially improved outcome in multiple myeloma (MM). However, the majority of patients eventually relapse and become resistant to one or multiple drugs. While the genetic landscape of relapsed/ resistant multiple myeloma has been elucidated, the causal relationship between relapse-specific gene mutations and the sensitivity to a given drug in MM has not systematically been evaluated. To determine the functional impact of gene mutations, we performed combined whole-exome sequencing (WES) of longitudinal patient samples with CRISPR-Cas9 drug resistance screens for lenalidomide, bortezomib, dexamethasone, and melphalan. WES of longitudinal samples from 16 MM patients identified a large number of mutations in each patient that were newly acquired or evolved from a small subclone (median 9, range 1-55), including recurrent mutations in TP53, DNAH5, and WSCD2. Focused CRISPR-Cas9 resistance screens against 170 relapse-specific mutations functionally linked 15 of them to drug resistance. These included cereblon E3 ligase complex members for lenalidomide, structural genes PCDHA5 and ANKMY2 for dexamethasone, RB1 and CDK2NC for bortezomib, and TP53 for melphalan. In contrast, inactivation of genes involved in the DNA damage repair pathway, including ATM, FANCA, RAD54B, and BRCC3, enhanced susceptibility to cytotoxic chemotherapy. Resistance patterns were highly drug specific with low overlap and highly correlated with the treatment-dependent clonal evolution in patients. The functional association of specific genetic alterations with drug sensitivity will help to personalize treatment of MM in the future.
Introduction
Multiple myeloma (MM) is a genetically heterogeneous malignant plasma cell disease characterized by a high number of somatic chromosomal alterations and gene mutations.1-4 Furthermore, MM displays a high degree of intraclonal genetic heterogeneity that evolves under therapeutic pressure with selection of therapy resistant subclones.5-8
Current treatment regimens for newly diagnosed MM consist of a combination of an immunomodulatory drug (IMiD) like lenalidomide, proteasome inhibitors like bortezomib and carfilzomib, glucocorticoids such as dexamethasone, and chemotherapy.9 These combinations result in high response rates and remission for several years in most patients. However, even with intensive therapy regimens that comprise high-dose melphalan/autologous stem cell transplantation (auto-PBSCT) and lenalidomide maintenance, long-term remissions or cures are rare, and most patients relapse within several years due to acquired drug resistance of MM cells.10 Several studies have found gene mutations and chromosomal aberrations that are enriched in resistant/relapsed MM.3,8,11-15 Chromosomal aberrations like deletion 17p (del17p) comprising TP53 and amplification of 1q21 are consistently associated with a poor outcome and are enriched at relapse,14,15 implying that these aberrations impair drug sensitivity. Likewise, homozygous loss of tumor suppressor genes due to chromosomal deletions and/or mutations, including CDKN2C, RB1, TRAF3, BIRC3, and TP53, are more frequently observed in relapsed/refractory disease and are predictors of a poor prognosis.14 Inactivation of TP53 reduces activity of cytotoxic chemotherapy in MM and other types of cancer, providing a functional link between a genetic alteration and response to a drug.16-18 The cereblon (CRBN)-CRL4 E3 ligase, the target of all IMiDs, that also comprises DDB1 and CUL4 is genetically or transcriptionally impaired in 10% to 20% of MM patients refractory to lenalidomide or pomalidomide.11,19 Consistently, genome-wide CRISPR-Cas9–based resistance screens found inactivation of CRBN and other members of the CRBN-CRL4 E3 ubiquitin ligase complex to cause resistance to IMiDs in the MM1S MM cell line.20,21 A genome-wide screen identified inactivation of proteasome subunit proteasome 26S subunit, PSMC6 to cause bortezomib resistance.22 However, besides CRBN, genes that were found to be functionally associated with lenalidomide and bortezomib drug resistance in these screens are rarely mutated in MM patients.8,11 Vice versa, for most genetic alterations found in MM, the functional impact on drug sensitivity is not clear. Multidrug combinations used in MM treatment make it challenging to infer the impact of a distinct gene mutation on activity to a specific drug. In this study, we performed pairwise comparison of whole-exome sequencing (WES) from pretreatment and relapsed MM samples followed by functional CRISPR-Cas9 resistance screens in order to systematically determine the impact of inactivation of individual genes on the activity of the 4 most frequently used drugs in the treatment of MM: bortezomib, lenalidomide, dexamethasone, and melphalan.
Materials and methods
Study cohort
We included 16 patients with newly diagnosed MM (n = 15) and plasma cell leukemia (n = 1) in our study (Table 1). All patients provided informed consent to molecular studies according to the Declaration of Helsinki, and the study was approved by the local ethics committee of the University of Ulm, Germany.
Clinical characteristics of the study cohort
| Variable at diagnosis | Value |
|---|---|
| Age, y | |
| Median (range) | 64 (45-79) |
| Sex, n (%) | |
| Male | 14 (88) |
| Female | 2 (12) |
| Type of MM, n (%) | |
| IgA | 8 (50) |
| IgG | 8 (50) |
| κ | 8 (50) |
| Λ | 8 (50) |
| Cytogenetics at diagnosis, n (%) | |
| t(4;14) | 5 (31) |
| t(11;14) | 4 (25) |
| t(14;16) | 2 (13) |
| del13q14 | 6 (38) |
| del17p | 1 (6) |
| +9q34 | 6 (38) |
| +1q21 | 11 (69) |
| Treatment, n (%) | |
| Low-dose melphalan | 4 (25) |
| High-dose melphalan/autologous SCT | 10 (63) |
| Lenalidomide | 16 (100) |
| Bortezomib | 9 (56) |
| Dexamethasone/prednisolone | 16 (100) |
Ig, immunoglobulin; SCT, stem cell transplantation.
Exome sequencing
Exome sequencing was performed in a total of 38 samples obtained at diagnosis and ≥1 time point during disease progression in all patients (n = 16). For 4 patients, 2 serial samples and in 1 patient, 3 serial samples were available at disease progression. Pretreatment/progress samples were derived from bone marrow (BM; n = 37) or peripheral blood (n = 1). Genomic DNA (gDNA) was extracted using the AllPrep DNA/RNA kit (Qiagen). Blood without evidence of circulating plasma cells was used as nontumor control. Library preparation for WES was performed with the Nextera Rapid Capture Exome kit (Illumina) with 50 ng gDNA input followed by sequencing on an Illumina HiSeq 2000 platform using the 200-cycle TruSeq SBS v3 kit (Illumina) according to the manufacturer’s instructions. The median coverage of all sequenced samples was 130× (supplemental Table 1). The read counts were adjusted for plasma cell content. One follow-up sample (#3, second relapse) was excluded for analysis of number and stability of mutations due to low sequencing quality at various positions but could be analyzed for the presence of recurrent gene mutations and clonal evolution of these mutations. WES data analysis and visualization of the clonal evolution with fishplots were performed using an in-house analysis pipeline.23 A variant allele frequency (VAF) >5% was defined for variant calling. The presence of subclonal variants at the time of diagnosis was determined for selected genes using an ultra-deep sequencing approach as described previously24 and detailed in supplemental Methods.
CRISPR-Cas9 screens
Cas9-expressing MM1S, KMS-27, NCI-H929, OPM2, and RPMI8226 cells were infected with the custom-made lentiviral single guide RNA (sgRNA) library (supplemental Table 2). To maintain an sgRNA coverage of 1000×, 10 million cells were infected at ∼0.3 multiplicity of infection (transduction rate 30%) to limit the number of sgRNAs per cell to 1. Cells were split at day 4 and distributed to treatment with lenalidomide, bortezomib, dexamethasone, melphalan, or dimethyl sulfoxide (DMSO) (all compounds from Selleck Chemicals, Houston, TX) as control (supplemental Table 3). Every 3 days, the media was replaced with fresh media containing the drug or DMSO. At the end of the screen (28-35 days depending on cell doubling time), or if cell viability was <10%, cells were harvested and gDNA was isolated using the Qiagen DNA isolation kit. PCR amplification of the sgRNA sequences (supplemental Table 2) was performed using barcoded primers (supplemental Table 4). Next-generation sequencing of the amplicons was performed on an Illumina MiSeq.25 The abundance of each sgRNA in a sample was assessed by an in-house python script. The MaGeCK software algorithm26 was used to calculate the P value and false discovery rate (FDR) values for each gene and sgRNA. The calculated z-score for each gene is based on the median sgRNA log2 fold change per gene.
Results
Clonal evolution in relapsed MM
Sixteen patients with MM with available pretreatment and ≥1 progression sample were included in the study. The median age of the patients was 64 years (range 45-79 years). Treatment comprised melphalan in 14 patients (88%), lenalidomide in 16 patients (100%), bortezomib in 9 patients (56%), and dexamethasone in 16 patients (100%) (Table 1). The median time between pretreatment and progression samples was 26 months (range 2-86 months) (supplemental Table 5).
Fluorescence in situ hybridization analyses revealed the presence of a chromosomal translocation in 11 patients (69%; 31% t(4;14), 33% t(11;14), and 13% t(14;16)) that persisted in all cases analyzed. Copy-number alterations at diagnosis were gain at 9q indicating a hyperdiploid karyotype in 6 patients (38%), gain at 1q21 in 11 patients (69%), del13q14 in 6 patients (38%), and del17p13 in 1 patient (6%). At relapse, 3 out of 14 patients (21%) acquired del13q14, 2 out of 14 patients (14%) acquired a new +1q21, 1 patient displayed a del13q14, and 1 patient lost a +9q34 (supplemental Figure 1).
The median number of mutations detected by WES was similar at diagnosis (median 30, range 10-207) and relapse (median 40, range 9-227, P = .33). The majority of mutations was stable between diagnosis and relapse indicated by the number of mutations shared in both samples (730/1162; 63%). Eighty-one (7%) mutations were found only at diagnosis and 351 (30%) only at relapse (Figure 1A). Between individual patients, the percentage of stable mutations between diagnosis and the first progression sample varied (Figure 1A-B; supplemental Figure 2). In all patients ≥1 new mutation was gained at relapse (median 9, range 1-55), and in addition, a median of 2 (range 0-20) gene mutations showed an increase of the VAF >10% between diagnosis and relapse samples for a total number of acquired/increased mutations of 10 (range 1-56) per patient. In contrast, a median of 4 (range 0-8) mutations detected at diagnosis were not present at disease progression, and the VAF decreased >10% in a median of 11 (range 0-141) mutations for a total median number of lost/decreased mutations of 13 (range 1-141). In 4 patients (patients 6-8 and 11) with serial progression samples, a median of 3 (range 0-15) mutations were newly acquired or increased with a VAF >10% and only few mutations were lost or decreased in the second relapse sample (median 3, range 0-11).
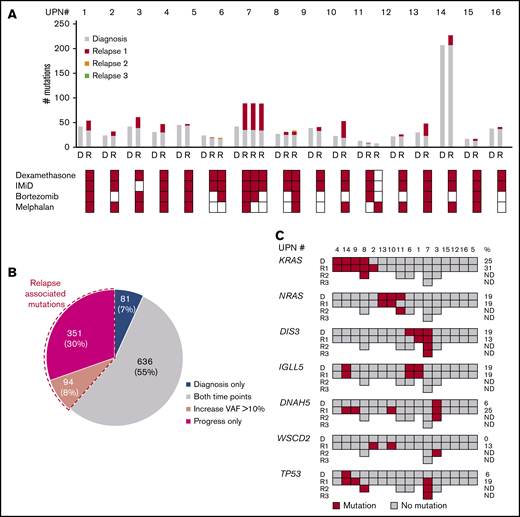
Gene mutations in pretreatment and relapse MM samples detected by WES. (A) Number of mutations at diagnosis (gray) and acquired mutations in serial relapse time points (red, relapse 1; yellow, relapse 2; green, relapse 3). Each bar shows the total number of mutations at the respective time point (D, diagnosis; R, relapse) in individual patients. Treatments with dexamethasone, immunomodulatory drugs (IMiD), bortezomib and melphalan before the acquisition of the sample are indicated below. (B) Distribution of mutations (number (%)) detected at diagnosis and in relapse samples. Mutations present only at diagnosis are color-coded in blue, mutations present at both time points in gray, and mutations present only at relapse in red. Dashed lines indicate the proportion of mutations with a VAF increase >10% at relapse. (C) Recurrent gene mutations at diagnosis and relapse. Each column represents 1 patient. For each gene, the presence of a mutation (color-coded in red; dark gray indicates no mutations was detected) at different time points is indicated in subsequent rows. On the right-hand side, the frequency of mutated patients at diagnosis and at relapse is given. UPN, unique patient number.
Gene mutations in pretreatment and relapse MM samples detected by WES. (A) Number of mutations at diagnosis (gray) and acquired mutations in serial relapse time points (red, relapse 1; yellow, relapse 2; green, relapse 3). Each bar shows the total number of mutations at the respective time point (D, diagnosis; R, relapse) in individual patients. Treatments with dexamethasone, immunomodulatory drugs (IMiD), bortezomib and melphalan before the acquisition of the sample are indicated below. (B) Distribution of mutations (number (%)) detected at diagnosis and in relapse samples. Mutations present only at diagnosis are color-coded in blue, mutations present at both time points in gray, and mutations present only at relapse in red. Dashed lines indicate the proportion of mutations with a VAF increase >10% at relapse. (C) Recurrent gene mutations at diagnosis and relapse. Each column represents 1 patient. For each gene, the presence of a mutation (color-coded in red; dark gray indicates no mutations was detected) at different time points is indicated in subsequent rows. On the right-hand side, the frequency of mutated patients at diagnosis and at relapse is given. UPN, unique patient number.
In general, we observed a high degree of interindividual genetic heterogeneity with only few recurrently mutated genes in pretreatment and progression samples. At diagnosis, we found recurrent mutations in ≥2 patients in 17 genes including KRAS (n = 4), NRAS (n = 3), BRAF (n = 2), DIS3 (n = 3) and IGLL5 (n = 3) (Figure 1C). At the time of progression most of these mutations were stable with one patient acquiring a KRAS mutation. In contrast, 4 patients acquired mutations in DNAH5 and 3 in WSCD2. TP53 mutations were detected by WES in 4 patients at relapse and persisted in subsequent follow-up samples (Figure 1C, supplemental Table 6A). In order to determine whether relapse-specific mutations were newly acquired or present at diagnosis, we performed ultra-deep targeted resequencing for selected relapse-specific genes in diagnostic specimen. For 3 of 4 cases with TP53 mutation identified by WES at relapse, we found the exact same mutation in a small subclone (VAF 0.1%-6.7%) in the pretreatment sample, implying that they expanded under therapy. (supplemental Table 6B).
Although all patients received lenalidomide, only 1 clonal outgrowth of a DDB1-mutation–harboring clone was detected, and 1 newly acquired subclonal IKZF3 mutation was found at relapse. No mutations in other genes involved in IMiD activity, including CRBN, CUL4B, IKZF1, CSNK1A1, MCT1, or CD147, were found.27-31
CRISPR-Cas9 knockout screens in MM reveal drug-specific resistance and sensitivity
In order to investigate the functional impact of the identified relapse-specific gene mutations on sensitivity to 4 commonly used drugs in MM, we performed pooled CRISPR-Cas9–based knockout resistance screens for melphalan, dexamethasone, bortezomib, and lenalidomide. To exclude cell-line–specific effects, the screens were performed in 5 MM cell lines of different genetic background (supplemental Table 7): MM1S, OPM2, NCI-H929, RPMI, and KMS-27. The screening included 156 genes that were found mutated at progression and fulfilled following criteria: (1) VAF of >20% at the time of progression, (2) found exclusively in progression samples with a >10% VAF or more than twofold increase of VAF at progression, (3) CRBN binders, and (4) predicted to be loss of function (supplemental Tables 8 and 9). In addition, we included genes that were found to be recurrently mutated and enriched in relapsed/refractory MM in previously published studies (supplemental Table 10).3,7,11,21,32 Each gene was targeted by 4 different sgRNAs. In addition, 30 control nontargeting sgRNAs and 30 sgRNAs against pan-essential genes were included as positive controls for a total of 745 sgRNAs. Two independent screens performed in MM1S cells demonstrated a high reliability (Pearson correlation r = 0.60, P < .0001) (supplemental Figure 3). The nontargeting control sgRNAs displayed a stable read count, while sgRNAs targeting essential genes were depleted at the end of the screen in the DMSO control in all 5 cell lines (supplemental Figure 3 and supplemental Table 11). sgRNAs targeting 2 frequently mutated genes in MM, TRAF3 and FAM46c, were enriched in the absence of a drug in the respective wild-type cell lines, but not in those that carry inactivating mutations (supplemental Figure 4). Each drug in our CRISPR screen revealed genes whose inactivation caused resistance. These genes were highly drug-specific, with little overlap between the tested drugs (Figure 2).33
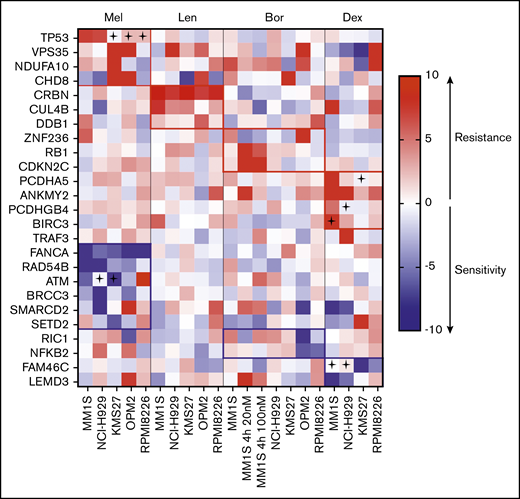
Heatmap of genes scoring significantly in CRISPR-Cas9 screens. SgRNAs targeting the listed genes conferred resistance (red) or sensitivity (blue) to ≥1 of the tested drugs (Bor, bortezomib; Dex, dexamethasone; Len, lenalidomide; Mel, melphalan) in ≥1 cell line. A cross indicates that the cell line carries a mutation in the respective gene (according to the Cancer Cell Line Encyclopedia database33 ).
Heatmap of genes scoring significantly in CRISPR-Cas9 screens. SgRNAs targeting the listed genes conferred resistance (red) or sensitivity (blue) to ≥1 of the tested drugs (Bor, bortezomib; Dex, dexamethasone; Len, lenalidomide; Mel, melphalan) in ≥1 cell line. A cross indicates that the cell line carries a mutation in the respective gene (according to the Cancer Cell Line Encyclopedia database33 ).
Alterations in DNA damage repair genes affect sensitivity to melphalan
Melphalan is an alkylating cytotoxic agent that induces apoptosis in cells by induction of DNA damage. CRISPR-Cas9 screens in the presence of melphalan revealed sgRNAs targeting 4 of the 177 included genes (2%) to be significantly enriched indicating resistance in ≥1 of the 5 cell lines (Figure 3). TP53 was the only gene that scored in the 2 TP53 wild-type cell line (MM1S and NCI-H929) screen (z-score 2.5, FDR < 0.1, P < .05), and experiments with individual sgRNAs validated these findings (Figure 3D). In contrast, in the 3 other cell lines carrying inactivating TP53 mutations (KMS27, OPM2, and RPMI8226), all sgRNAs targeting TP53 had no additional effect.34-37 Further genes were only enriched in individual cell lines and included VPS35 (z-score 3.2), NDUFA10 (z-score 2.8), SMARCD2 (z-score 3.7), and CHD8 (z-score 3.1) (Figure 3A-B).
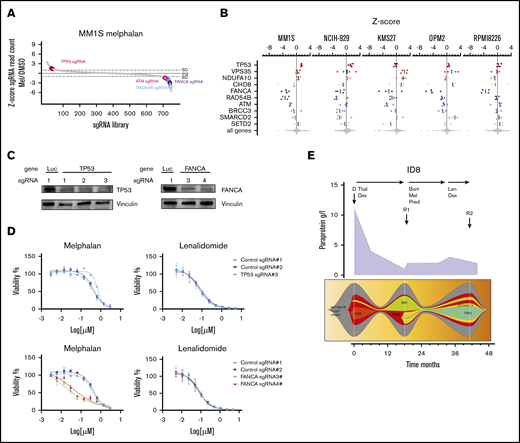
CRISPR-Cas9 screens in melphalan-treated MM cell lines. (A) sgRNA library ranked by z-score for MM1S cells treated with 2 µM melphalan. (B) z-score for the 4 different sgRNAs for genes that were significantly enriched (red) or depleted (blue) in the CRISPR-Cas9 screen in ≥1 cell line. (C) MM1S-Cas9 cells lentivirally expressing sgRNAs against luciferase (Luc), FANCA-, or TP53 were analyzed for knockout efficiency by western blot. Data are representative of 2 biological replicates. (D) MM1S-Cas9 cells were infected with Luc control- or FANCA-specific sgRNAs and treated with DMSO, melphalan, or lenalidomide for 7 days. Dose-response curves show viability normalized to DMSO treatment assessed by CellTiter-Glo. Error bars represent standard error of the mean for each drug concentration. (E) Treatment, paraprotein course (purple graph), and fishplots showing the clonal evolution from diagnosis to relapse in patient 8. Arrows indicate collection of BM samples (Thal, thalidomide).
CRISPR-Cas9 screens in melphalan-treated MM cell lines. (A) sgRNA library ranked by z-score for MM1S cells treated with 2 µM melphalan. (B) z-score for the 4 different sgRNAs for genes that were significantly enriched (red) or depleted (blue) in the CRISPR-Cas9 screen in ≥1 cell line. (C) MM1S-Cas9 cells lentivirally expressing sgRNAs against luciferase (Luc), FANCA-, or TP53 were analyzed for knockout efficiency by western blot. Data are representative of 2 biological replicates. (D) MM1S-Cas9 cells were infected with Luc control- or FANCA-specific sgRNAs and treated with DMSO, melphalan, or lenalidomide for 7 days. Dose-response curves show viability normalized to DMSO treatment assessed by CellTiter-Glo. Error bars represent standard error of the mean for each drug concentration. (E) Treatment, paraprotein course (purple graph), and fishplots showing the clonal evolution from diagnosis to relapse in patient 8. Arrows indicate collection of BM samples (Thal, thalidomide).
In addition to sgRNAs causing resistance, we also found sgRNAs that were depleted in melphalan-treated cells, indicating that inactivation of the targeted genes increases sensitivity to melphalan (Figure 3C-D; supplemental Figure 6A,C). The top sensitizing hits were members of the DNA damage repair pathway: FANCA (5/5 cell lines, z-score −5.8), RAD54B (3/5 cell lines, z-score −5.5), ATM (3/5 cell lines, z-score −3.6), and BRCC3 (2/5 cell lines, z-score −3.19). In independent experiments using single sgRNAs, inactivation of FANCA increased DNA damage and apoptosis and diminished cell viability after melphalan treatment (supplemental Figure 6B-C).
Other genes whose inactivation increased sensitivity in a single cell line were SMARCD2 (z-score −3.2), SETD2 (z-score −2.5), and RIC1 (z-score −2.4).
The functional association of gene inactivation and drug sensitivity found in our screens highly correlated with the clinical course in patients; in 3 patients (patients 7, 8, and 14), a TP53-mutated clone strongly evolved under melphalan therapy (Figure 3E; supplemental Figure 7). In patient 13, we detected a new VPS35 mutation after 2 courses of high-dose melphalan and tandem auto-PBSCT.
Inactivation of CRBN-CRL4 E3 ligase members confer resistance to lenalidomide
In the lenalidomide resistance screens, we found 3 genes whose inactivation by CRISPR-Cas9 conferred resistance in ≥1 cell line (Figure 2). The 4 most-enriched sgRNAs in all 5 cell lines targeted CRBN (z-score 9.2), the target of all IMiDs and substrate receptor of the CRL4 E3 ubiquitin ligase (Figure 4A-B; supplemental Figure 5A). sgRNAs targeting 2 other members of the E3 ligase, CUL4B (z-score 3.3) and DDB1 (z-score 3.7), were significantly enriched after lenalidomide treatment in 2 and 1 cell lines, respectively. In MM1S cells, DDB1 was slightly above the FDR threshold of 0.1, with a P value < .05. None of the other genes were associated with reduced or increased lenalidomide sensitivity. Consistent with the essential role of the CRBN-CRL4 E3 ligase for IMiD activity, we observed expansion of a DDB1-mutated subclone in patient 3 during a lenalidomide-comprising second-line treatment (Figure 4C).

CRISPR-Cas9 screens in lenalidomide-treated MM cell lines. (A) sgRNA waterfallplot of MM1S cells treated with 1µM lenalidomide. (B) Significant his per cell line ranked by sgRNA z-score. (C) Clinical course (treatment schedule and paraprotein) of patient 3 and clonal evolution of mutations during sequential treatments. Arrows indicate collection of BM biopsy (auto, autologous stem cell transplantation; Bort, bortezomib; Cy, cyclophosphamide).
CRISPR-Cas9 screens in lenalidomide-treated MM cell lines. (A) sgRNA waterfallplot of MM1S cells treated with 1µM lenalidomide. (B) Significant his per cell line ranked by sgRNA z-score. (C) Clinical course (treatment schedule and paraprotein) of patient 3 and clonal evolution of mutations during sequential treatments. Arrows indicate collection of BM biopsy (auto, autologous stem cell transplantation; Bort, bortezomib; Cy, cyclophosphamide).
Loss of cell-cycle regulators impair bortezomib activity
The clinical activity of proteasome inhibitors in MM is reflected by a high sensitivity of MM cell lines in vitro. In CRISPR-Cas9 screens performed with continuous low-dose bortezomib (1-3 nM), we found significantly enriched or depleted sgRNAs in OPM2, but not in the other cell lines (Figure 2). sgRNAs targeting VPS35 (z-score 3.1) and ZNF236 (z-score 2.67), a zinc-finger protein of unknown function, caused resistance, while sgRNAs targeting NFKB2 (z-score −2.6) and RIC1 (z-score −2.9) enhanced sensitivity to bortezomib (Figure 5A-C).
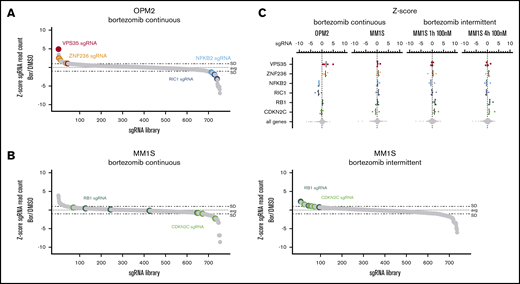
CRISPR-Cas9 screens in bortezomib-treated MM cell lines. (A) sgRNA waterfallplot for OPM2 cells treated continuously with 3 nM bortezomib. (B) sgRNA waterfallplot for MM1S cells treated continuously with 1 nM bortezomib or intermittent treatment with 100 nM for 4 hours. (C) Significant his per cell line ranked by sgRNA z-score
CRISPR-Cas9 screens in bortezomib-treated MM cell lines. (A) sgRNA waterfallplot for OPM2 cells treated continuously with 3 nM bortezomib. (B) sgRNA waterfallplot for MM1S cells treated continuously with 1 nM bortezomib or intermittent treatment with 100 nM for 4 hours. (C) Significant his per cell line ranked by sgRNA z-score
Because of these low numbers of resistance genes identified in 5 cell lines for continuous exposure to bortezomib, we explored an alternative treatment approach. Bortezomib and other proteasome inhibitors in MM treatment are applied once or twice weekly resulting in a high peak plasma concentration of ∼100 nM within 1 hour followed by a steep decline over 4 hours and a slower decline in the terminal phase.37,38 We therefore performed a bortezomib CRISPR-Cas9 resistance screen in MM1S cells mimicking these drug kinetics. The cells were exposed to high bortezomib concentrations (20 nM and 100 nM) for only 1 and 4 hours, and the treatment was repeated after 7 days. Here, sgRNAs targeting the cell-cycle regulators RB1 (z-score 1.9) and CDKN2C (z-score 2.3), both found homozygously deleted in relapsed MM,15 were enriched in all treatment conditions (Figures 5A-C and 2).
Dexamethasone efficacy is affected by mutations in structural genes and the NF-κB pathway
Dexamethasone is a glucocorticoid with high clinical activity in MM and other lymphoid malignancies. In the dexamethasone resistance CRISPR-Cas9 screens, we found a total of 6 genes whose sgRNAs were significantly enriched in ≥1 cell line (Figure 2). sgRNAs targeting ANKMY2, a downstream activator of the sonic hedgehog signaling pathway,39,40 were highly enriched in MM1S (z-score 2.28) and NCI-H929 cells (z-score 2.0). In MM1S cells, we found additional sgRNAs enriched targeting the cadherin superfamily gene members PCDHA5 (z-score 4.68) and PCDHGB4 (z-score 1.3) (Figure 6A-B). Individual evaluation of sgRNAs targeting PCDHA5 and PCDHGB4 showed a reduction of dexamethasone sensitivity over a broad range of concentrations (Figure 6C). The protocadherin gene locus is located on chromosome 5 around 2 megabases upstream of the glucocorticoid receptor gene locus NR3C1, which prompted us to evaluate whether sgRNAs targeting PCDHA5 and PCDHGB4 cause dexamethasone resistance through downregulation of NR3C1 by targeting regulatory regions or through introduction of large genetic deletions. We found that NR3C1 protein levels remained unchanged after PCDHA5 and PCDHGB4 inactivation, implying a different mode of action for dexamethasone resistance (supplemental Figure 8). Consistent with the dexamethasone-specific resistance identified by CRISPR-Cas9 screens, we found a clone with an ANKMY2 and PCDHGB4 mutation in a relapse sample (patient 1) after 3 years of dexamethasone-comprising therapy (Figure 6D).
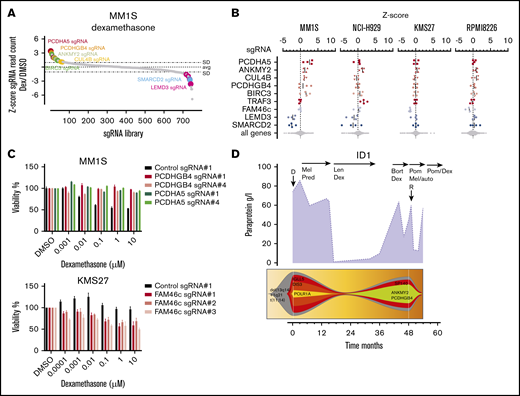
CRISPR-Cas9 screen in dexamethasone-treated myeloma cell lines. (A) sgRNA waterfallplot of MM1S cells treated with 60 nM dexamethasone. (B) Significant hits from CRISPR-Cas9 screens for all cell lines. (C) Cell viability of KMS27- and MM1S-Cas9 cells expressing gene targeting (PCDHGB4, PCDHA5, and FAM46c) or control sgRNAs after treatment with DMSO or dexamethasone for 4 days. (D) Paraprotein course and clonal evolution of patient 1 (Pred, prednisolone; Pom, pomalidomide).
CRISPR-Cas9 screen in dexamethasone-treated myeloma cell lines. (A) sgRNA waterfallplot of MM1S cells treated with 60 nM dexamethasone. (B) Significant hits from CRISPR-Cas9 screens for all cell lines. (C) Cell viability of KMS27- and MM1S-Cas9 cells expressing gene targeting (PCDHGB4, PCDHA5, and FAM46c) or control sgRNAs after treatment with DMSO or dexamethasone for 4 days. (D) Paraprotein course and clonal evolution of patient 1 (Pred, prednisolone; Pom, pomalidomide).
In dexamethasone-treated MM1S cells, we found additional sgRNAs enriched targeting the CRL4 E3 ligase member CUL4B (z-score 0.8) and BIRC3 (z-score 1.6). In NCI-H929 cells, sgRNAs targeting the NF-κB and interleukin-6 signaling protein TRAF340 (z-score 2.7) were enriched after dexamethasone treatment. Of note, MM1S cells carry a TRAF3 mutation, and thus, sgRNAs targeting TRAF3 likely had no additional effect.
Our CRISPR screens for dexamethasone also revealed genes whose inactivation was associated with increased sensitivity (Figure 2). In MM1S, the 2 top hits were LEMD3 (z-score −3.8) and SMARCD2 (z-score −4.4). We detected LEMD3 and SMARCD2 mutations in 3 relapse samples of patient 7, who responded to a dexamethasone-containing treatment of >1 year. Knockout of the noncanonical poly(A) polymerase FAM46c (z-score −3.5) enhanced dexamethasone sensitivity in KMS27 cells (Figure 6B) but did not score in MM1S and NCI-H929, which already harbor a FAM46c missense mutation (supplemental Table 7).41,42 Consistently, a FAM46c-mutated clone detected at diagnosis of patient 14 decreased under a dexamethasone-comprising treatment.
Discussion
This is the first study coupling comprehensive genetic profiling with functional genomics to systematically study the mutational dynamics in putative tumor suppressor genes and drug activity in MM. In our longitudinal study, WES of pretreatment and progression samples revealed a high number of gene mutations newly acquired in progression samples or expanding from a small subclone present at diagnosis, which is consistent with previous studies.5,7,8 While many of recurrent MM mutations, like in RAS and DIS3, persisted during therapy, other mutations, like those in DNAH5, WSCD2, and TP53, were enriched in relapse samples. Our CRISPR resistance screens revealed that on average, 1 or 2 of the median 9 mutations acquired in an individual relapse sample could be functionally linked to drug sensitivity. Among the most recurrent mutations at relapse were those in TP53, which occurred predominantly after cytotoxic chemotherapy treatment. Targeted deep sequencing of the pretreatment samples revealed that in all patients analyzed a very small TP53-mutated subclone preexisted and expanded under therapy. Previous reports similarly found a higher incidence of inactivating TP53 mutations and deletions in relapsed/ refractory disease8,11,43 and an association with adverse outcome in MM patients treated with chemotherapy.15,17,43,44 Our functional genetic analyses revealed that these observations are explained by reduced melphalan sensitivity of TP53-mutated cells. TP53 inactivation did not functionally affect sensitivity to dexamethasone, lenalidomide, or bortezomib. In accordance, in patients receiving bortezomib before and after chemotherapy, the chromosomal aberration del17p comprising TP53 had no effect on outcome.45,46
On the contrary, we found that inactivation of genes involved in chromosome stability and DNA damage repair enhanced sensitivity to melphalan, even in cells with coexisting TP53 mutations. For FANCA, we have shown that inactivation enhances DNA damage upon chemotherapy, which is in line with previous findings in MM17,47 and other malignancies.48-50 In relapsed MM, mutations in the DNA damage repair pathway are found in up to 20% of patients (supplemental Table 10).8,11 Our findings imply that these patients might benefit from cytotoxic therapy and possibly other therapies targeting the DNA repair mechanism, like PARP or ATR inhibition.51,52 This is especially important given that chemotherapy-based regimens are nowadays less frequently applied in relapsed MM in favor of chemotherapy-free regimens with new drugs like antibodies, next-generation IMiDs, and proteasome inhibitors.
In our CRISPR-Cas9 screens, inactivation of CRBN or other CRL4 E3 ligase complex members (DDB1 and CUL4B) caused resistance to lenalidomide, consistent with previous studies.11,20,21 The discrepancy of the essential functional role of the CRBN-CRL4 ligase and the low frequency of mutations in these genes is currently not explained. Remarkably, we could not link any other gene inactivation, including high-risk deletions/mutations in TP53, BIRC3, or RB1,15,32 to lenalidomide sensitivity, suggesting that other, not genetically defined resistance mechanisms exist.
Continuous low-dose bortezomib treatment yielded only a small number of resistance genes despite analyzing 5 different cell lines, which is consistent with previous findings.22,53 By using an alternative treatment approach with short-term high-dose bortezomib equivalent to the peak levels in patients,37 we found in addition inactivation of 2 cell-cycle regulators, CDK2NC and RB1, to cause resistance. Homozygous deletions of chromosome 1p32.3, including CDK2NC and loss of del13q/RB1, are recurrent genetic events enriched in relapsed MM and associated with poor outcome.3,15,54,55 In our cohort, 3 patients had heterozygous loss of RB1 by chromosome 13q deletion at relapse. The exact mechanism by which loss of function of CDK2NC and RB1 contributes selectively to resistance to bortezomib, but none of the other drugs in MM, remains to be determined. These findings further highlight the need to functionally test different treatment schedules to identify the full spectrum of resistance-causing gene alterations.
Almost all MM patients initially respond to glucocorticoids that are included in most treatment combinations, yet the understanding of the exact mechanism in MM is incomplete. Glucocorticoids induce apoptosis in MM and inhibit NF-κB signaling.56 Consistently, in our dexamethasone screen, we found several genes, like TRAF3 and BIRC3, whose inactivation enhance NF-κB signaling.40,57 Furthermore, protocadherin members PCDHGB4 and PCDHA5 caused resistance in MM1S cells. PCDH10, another member of the protocadherin family, was shown to be a negative regulator of NF-κB and WNT signaling, providing a possible functional connection.58,59
Mutations in the large protocadherin gene family, including PCDHGB4 and PCDHA5, are found in ∼50% of patients with MM.4 Despite this high frequency, an association of mutations in protocadherin members with outcome in MM hast not been reported yet. Reasons for this may be that not all protocadherin members affect glucocorticoid response and dexamethasone is virtually always combined with other drugs whose activity was not altered by protocadherin-targeting sgRNAs.
In aggregate, our systematic functional evaluation of relapse-associated mutations found in a cohort of MM patients revealed drivers of resistance and new vulnerabilities for distinct drugs that highly correlate with drug activity in patients (Figure 2). By our integrated approach, we were able to trace gene mutations that functionally alter drug sensitivity. While some of these mutations are known high-risk markers frequently mutated in MM, others, including rare mutations, have not been associated with therapy resistance. Remarkably, we did not observe relevant cross-resistance among the 4 drugs investigated (Figure 2), allowing for tailoring the most active drug combinations according to the genetic profile of a patient. For a slow-growing malignancy such as MM, it may even be feasible to perform a targeted functional genetic screen based on the individual genetic alterations of a patient to guide treatment. Our integrated approach revealed genetic determinants of sensitivity to 4 main MM drugs currently approved for first-line treatment. Surprisingly, sgRNAs targeting DNAH53,11,13 and WSCD2 had no impact on any of the drugs despite being among the most recurrently mutated genes acquired at relapse. However, our study was performed in vitro and therefore limited to assess direct drug effects and, due to the unavailability of better models, was performed in cell lines that already harbor many genetic alterations. Future studies need to evaluate the direct and indirect impact of genetic and nongenetic alterations on MM treatments, including antibodies and chimeric antigen receptor T cells as well as combination treatments in more sophisticated model systems like primary patient cells and xenograft models once they become available. Uncovering the genetic determinants of drug sensitivity will help to further facilitate personalized treatment in MM.
Presented in abstract form at the 61st annual meeting of the American Society of Hematology, Orlando, FL, 7 December 2019.
Raw data files are available from the corresponding author upon reasonable request: jan.kroenke@charite.de.
Acknowledgments
The authors thank K. H. Holzmann of the sequencing core facility Ulm and T. Hamel for their technical support with WES, as well as Arunima Murgai and Shruti Bhatt for critical reading and discussion. The visual abstract was designed via BioRender through the account of S.R.B.
This study was funded by the Emmy Noether Program of the Deutsche Forschungsgemeinschaft (grants Kr3886/2-1 and 2-2) (J.K.). S.R.B. is a Deutsche Forschungsgemeinschaft research scholar (St5303/1-1). L.K.S. is participant in the BIH-Charité Clinician Scientist Program funded by the Charité-Universitätsmedizin Berlin and the Berlin Institute of Health. S.K. received an “Experimental Medicine” fellowship from Ulm University. D.H. is supported by the German Cancer Aid (111743).
Authorship
Contribution: S.R.B., L.K.S., and J.K. designed the study; S.R.B., L.K.S., I.B., T.M., S.K., M.S., and L.R. performed experiments; L.K.S., A.D., T.J.B., M.S., F.D., and L.B. performed, analyzed and interpreted the sequencing analyses; D.M. performed primary sample preparation and fluorescence in situ hybridization analyses; S.R.B., L.K.S., M.K., C.L., H.D., A.L., D.H., F.D., L.B., and J.K. interpretated data; S.R.B., L.K.S., and J.K. took the lead in writing the manuscript; and all authors read and agreed to the final version of the manuscript.
Conflict-of-interest disclosure: J.K. is a member of the advisory committees at Celgene, Takeda, and Janssen. L.B. is a member of the advisory committees at AbbVie, Amgen, Astellas, Bristol Myers Squibb, Celgene, Daiichi Sankyo, Gilead, Hexal, Janssen, Jazz Pharmaceuticals, Menarini, Novartis, Pfizer, Sanofi, and Seattle Genetics. H.D. is a member of the consulting committees at AbbVie, Agios, Amgen, Astellas, Astex Pharmaceuticals, Celgene, Helsinn, Janssen, Jazz Pharmaceuticals, Novartis, Oxford Biomedicals, and Roche and receives research funding from Amgen, AROG Pharmaceuticals, Bristol Myers Squibb, Celgene, Jazz Pharmaceuticals, Novartis, Pfizer. and Suneisi. A.L. is on the advisory committees at Dialectic Therapeutics; is an equity holder and cofounder of Flash Therapeutics and Vivid Bioscience; and receives research funding from AbbVie, Novartis, and AstraZeneca. F.D. received honoraria from Roche and research funding from Novartis and reports travel accommodations from AbbVie and AstraZeneca. The remaining authors declare no competing financial interests.
Correspondence: Jan Krönke, Department of Hematology, Oncology and Tumor Immunology, Charité–Universitätsmedizin Berlin, Campus Benjamin Franklin, Hindenburgdamm 30, 12203 Berlin, Germany; e-mail: jan.kroenke@charite.de.

