

Key Points
Good response at I-PET2 and poor response at I-PET4 may qualify for randomized trials evaluating treatment de-escalation or new therapies.
The best response criterion at I-PET was ΔSUVmax, with higher discriminative power and predictive values than currently used DS4-5 criteria.

Abstract
Interim 18F-fluorodeoxyglucose positron emission tomography (Interim-18F-FDG-PET, hereafter I-PET) has the potential to guide treatment of patients with diffuse large B-cell lymphoma (DLBCL) if the prognostic value is known. The aim of this study was to determine the optimal timing and response criteria for evaluating prognosis with I-PET in DLBCL. Individual patient data from 1692 patients with de novo DLBCL were combined and scans were harmonized. I-PET was performed at various time points during treatment with rituximab plus cyclophosphamide, doxorubicin, vincristine, and prednisone (R-CHOP) therapy. Scans were interpreted using the Deauville score (DS) and change in maximum standardized uptake value (ΔSUVmax). Multilevel Cox proportional hazards models corrected for International Prognostic Index (IPI) score were used to study the effects of timing and response criteria on 2-year progression-free survival (PFS). I-PET after 2 cycles (I-PET2) and I-PET4 significantly discriminated good responders from poor responders, with the highest hazard ratios (HRs) for I-PET4. Multivariable HRs for a PET-positive result at I-PET2 and I-PET4 were 1.71 and 2.95 using DS4-5, 4.91 and 6.20 using DS5, and 2.93 and 4.65 using ΔSUVmax, respectively. ΔSUVmax identified a larger proportion of poor responders than DS5 did. For all criteria, the negative predictive value was >80%, and positive predictive values ranged from 30% to 70% at I-PET2 and I-PET4. Unlike I-PET1, I-PET3 discriminated good responders from poor responders using DS4-5 and DS5 thresholds (HRs, 2.94 and 4.67, respectively). I-PET2 and I-PET4 predict good response equally during R-CHOP therapy in DLBCL. Optimal timing and response criteria depend on the clinical context. Good response at I-PET2 is suggested for de-escalation trials, and poor response using ΔSUVmax at I-PET4 is suggested for randomized trials that are evaluating new therapies.
Introduction
Diffuse large B-cell lymphoma (DLBCL) is characterized by an aggressive clinical course. Standard first-line therapy consists of rituximab plus cyclophosphamide, doxorubicin, vincristine, and prednisone (R-CHOP). Up to one-third of patients relapse or fail to achieve complete remission. These patients have a poor prognosis and low response rates to salvage treatment.1,2 Early identification of patients with poor prognosis is an important step toward testing alternative treatment options. Interim 18F-fluorodeoxyglucose positron emission tomography/computed tomography (18F-FDG-PET/CT) can be used to differentiate good and poor responders during treatment to modify therapy and improve outcome for poor responders and de-escalate treatment for good responders.3
Current tools for predicting outcome in DLBCL, such as the International Prognostic Index (IPI),4 which captures pretreatment clinicopathologic features, have limited precision. Many studies have investigated the potential of metabolic imaging with 18F-FDG-PET in the context of treatment evaluation using end-of-treatment PET/CT scans5,6 or of prediction of therapy success using on-treatment (interim 18F-FDG PET [I-PET]) evaluation. End-of-treatment PET is the current clinical standard, but the impact of I-PET is less clear. A recent systematic review and meta-analysis concluded that I-PET has predictive value in DLBCL patients, but small sample sizes, use of different response criteria, different timings, and other methodologic variations among studies hamper the ability to draw firm conclusions.3
Analyzing the individual patient data (IPD) from various studies made it possible to re-analyze clinical data and 18F-FDG PET scans, which reduced variability and thus allows for a statistically more robust analysis of prediction or prognosis, subgroup analyses, and identification of potential effect modifiers. To this end, we established the PETRA database (www.petralymphoma.org), for collecting individual patient data and PET/CT scans from high-quality international clinical studies. The aim of this IPD meta-analysis was to determine the optimal timing and PET response criteria for I-PET in DLBCL.
Materials and methods
Database
This IPD meta-analysis included 1692 patients with de novo DLBCL from the PETRA database with I-PET scans after 1 to 4 cycles of chemotherapy for those who were treated with R-CHOP. This database was established by the PETRA consortium and contains patient-level data for 2539 patients with non-Hodgkin lymphoma who were enrolled in the Bologna,7 HOVON-84,8 IAEA,9 GSTT15,10 NCRI,11 Nordic-US Intergroup,12 PETAL,13 and SAKK 38/0714 studies.
The following are eligibility criteria for the PETRA database: adult patients age 18 years or older who had first-line treatment for non-Hodgkin lymphoma and had received an18F-FDG I-PET scan. The trial had to have a prospective design or retrospective design with consecutive patients, at least 40 patients with progression-free survival (PFS) and overall survival (OS) data, and a full-ring PET system. Individual study protocols were approved by local institutional review boards, and written informed consent was provided by all participants in each study. After signing a data sharing agreement, data were made available to PETRA. Data remained the property of contributing investigators. The use of all data within the PETRA imaging database has been approved by the institutional review board of the Vrije Universiteit Medical Center (JR/20140414).
Data collection, harmonization, and re-analysis
Each study was checked for missing data and for data that were consistent with those in published reports. Trial investigators were contacted about discrepancies or missing information. Patient numbers were recoded to PETRA identification numbers that consisted of study-specific and patient-specific parts. Patient data from original studies were merged into an online database and harmonized using the PETRA coding for all studies. All PET images were given a new pseudonym and were uploaded to an online database.15
Survival rates were recalculated by using the date of baseline PET at the start of follow-up. If the date of baseline PET was not available, we used the baseline CT date or date of diagnosis (supplemental Data). Missing variables were completed, whenever possible, by reviewing scans. Scans were reviewed to provide Deauville scores (DS) for the IAEA study, to assess extranodal involvement to determine the IPI score for the HOVON-84 study, and to measure the change in maximum standardized uptake value (ΔSUVmax) for the Bologna, IAEA, HOVON-84, and SAKK studies.7-9,14 Follow-up was updated for the GSTT15 and Bologna studies.7,10 Patients were divided into 4 prognostic IPI score subgroups (low, low-intermediate, high-intermediate, and high).4
PET/CT review
All I-PET scans were reviewed according to the 5-point DS5,6 by individual PETRA study groups. To harmonize DS5 scores between studies, we re-analyzed all DS5 patients, assigning DS5 if the lesional SUVmax exceeded 3 times the liver SUVmax and/or in the case of new lymphomatous lesions. We applied 2 different cutoffs for PET response assigning DS4-5, as recommended in international guidelines, and DS5 as PET-positive, respectively. Patients with a negative PET were considered to have a complete metabolic response. We also validated alternative criteria: ΔSUVmax between baseline and I-PET assessing response as ≥66% SUVmax reduction for I-PET scans after 1, 2, or 3 cycles,16 and ≥70% SUVmax reduction after 4 cycles of therapy,17 respectively.
Quality assessment
Two independent researchers (J.J.E., C.N.B., or H.C.W.d.V.) rated the quality of included studies by scoring all relevant items with the Quality In Prognosis Studies (QUIPS) tool (ie, a risk of bias tool for prognosis studies).18 Quality was rated as high, low, or unclear risk of bias on the following aspects: study participation, study attrition, prognostic factor measurement, and outcome measurement. Differences in quality assessments were resolved by consensus.
Statistical analysis
A statistical plan was created before data were pooled and statistically analyzed. The primary end point of this study was 2-year PFS, defined as time from baseline PET to progression, relapse, or death as a result of any cause. Secondary end points were 2-year time to progression (TTP), defined as time from baseline PET to progression at which time patients dying within 2 years were censored, and 2-year OS, defined as time from baseline PET to death. Patients still alive were censored at date of last contact or the end of study period.
Survival curves of individual studies were obtained with Kaplan-Meier analyses for PFS. We used multivariable Cox proportional hazards models and multilevel Cox regression models to study the effects of timing and PET response criteria on PFS, TTP, and OS. Multilevel analyses were used to account for clustering of data within studies. To adjust for different inclusion criteria applied in the original studies, survival curves were corrected for IPI score. Corresponding hazard ratios (HRs) and their 95% confidence intervals (CIs) were obtained by Cox regression. For each variable included in the Cox regression model (timing I-PET, PET response criteria, and IPI score), the assumption of proportional hazards was assessed on the basis of Schoenfeld residuals,19 which was not violated. Univariable HRs were calculated for the DS4-5 response criterion and IPI score. To compare the discriminative ability of IPI score (low and low-intermediate vs high-intermediate and high) and age-adjusted IPI score (aaIPI; low and low-intermediate vs high-intermediate and high), univariable HRs of both prognostic scores in patients age 60 years or younger were calculated.
Diagnostic measures (positive predictive value [PPV] and negative predictive value [NPV]) were estimated from the Cox regression model probabilities of the event outcome (PPV) or survival probabilities (NPV) stratified for I-PET timing for DS4-5, DS5, and ΔSUVmax response criteria on 2-year PFS, TTP, and OS. Statistical analysis was performed using IBM SPSS version 24 and R version 3.6.3. A P value of < .05 was considered statistically significant.
Results
Patients’ characteristics
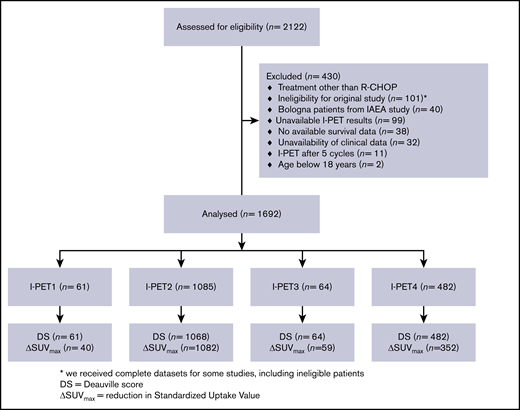
There were 2122 treatment-naïve DLBCL patients in the PETRA database, and 1692 of them were included in this IPD analysis (Figure 1). Patients who were treated with regimens other than R-CHOP (n = 107), who were ineligible for the original study (n = 101), or who had an I-PET after 5 cycles (n = 11) were ineligible for this study. To avoid duplication, we excluded the Bologna patients from the IAEA study (n = 40). Other reasons for exclusion were missing I-PET results (n = 99), survival data (n = 38), or clinical data (n = 32) and were younger than age 18 years (n = 2). Descriptive statistics for the main patient and I-PET outcome variables are presented in supplemental Table 1. There was low risk of bias for individual studies (supplemental Table 2). After correcting the survival curves for IPI scores, studies had similar 2-year PFS, 2-year TTP, and 2-year OS survival rates (using the largest study [PETAL] as the reference; Figure 2; supplemental Table 3).
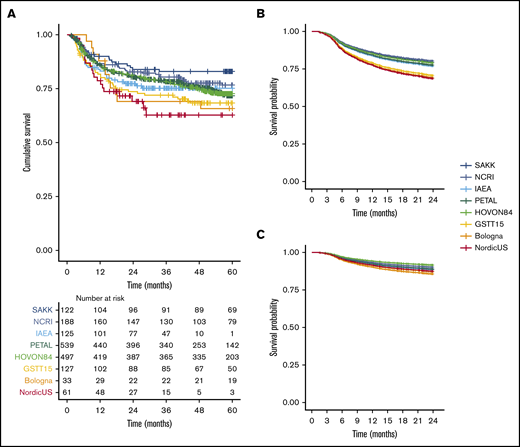
PPS from day of baseline scan for individual studies included in our analysis. (A) Kaplan-Meier survival curve for 5-year PFS for all studies. (B) Uncorrected Cox regression 2-year PFS for all studies. (C) Cox regression corrected for IPI score for 2-year PFS for all individual studies.
PPS from day of baseline scan for individual studies included in our analysis. (A) Kaplan-Meier survival curve for 5-year PFS for all studies. (B) Uncorrected Cox regression 2-year PFS for all studies. (C) Cox regression corrected for IPI score for 2-year PFS for all individual studies.
I-PET response criteria
In total, 1085 patients had scans after 2 cycles of I-PET (I-PET2) scans and 482 had I-PET4 scans. There were relatively few patients with I-PET1 and I-PET3 scans (Figure 1). The prevalence of positive I-PET scans was lower when I-PET scans were performed later during treatment, independent of PET response criteria (Table 1). A total of 1675 patients were assessed according to DS, and 1533 patients also had a baseline scan available to calculate the ΔSUVmax. There were no differences in baseline characteristics between these groups (supplemental Table 4). ΔSUVmax identified a larger proportion of poor responders at I-PET scanning than did DS5 (supplemental Table 5).
Percentage of PET-positive scans and HRs of I-PET using DS4-5 or DS5 or ΔSUVmax to assign a PET-positive result with 2-year PFS as outcome
| Timing | DS1-3 vs DS4-5 | DS1-4 vs DS5 | ΔSUVmax | |||
|---|---|---|---|---|---|---|
| I-PET positive | HR (95% CI) | I-PET positive | HR (95% CI) | I-PET positive | HR (95% CI) | |
| I-PET1 | 38 (62.3) | 1.22 (0.46-3.20) | 12 (19.7) | 2.33 (0.88-6.13) | 15 (37.5) | 1.46 (0.45-4.80) |
| I-PET2 | 442 (41.4) | 1.71 (1.32-2.22) | 60 (5.6) | 4.91 (3.46-6.97) | 137 (12.7) | 2.93 (2.18-3.93) |
| I-PET3 | 14 (21.9) | 2.94 (1.08-7.96) | 4 (6.3) | 4.67 (1.52-14.37) | 9 (15.3) | 2.27 (0.73-7.04) |
| I-PET4 | 102 (21.2) | 2.95 (1.98-4.40) | 24 (5) | 6.20 (3.62-10.61) | 36 (10.2) | 4.65 (2.76-7.83) |
Data are presented as n (%), unless otherwise labeled.
In a multivariable Cox regression analysis, IPI score and I-PET scans (all PET response criteria) were independent predictors of outcome. The univariable HR of I-PET scans using DS4-5 response criteria was 2.20 (95% CI, 1.79-2.69). The univariable HR of IPI scores for the entire study population was 2.91 (95% CI, 2.34-3.61). When selecting patients age 60 years or younger, the univariable HR of IPI score was 2.46 (95% CI, 1.76-3.44) vs 2.58 (95% CI, 1.83-3.66) for the aaIPI prognostic score.
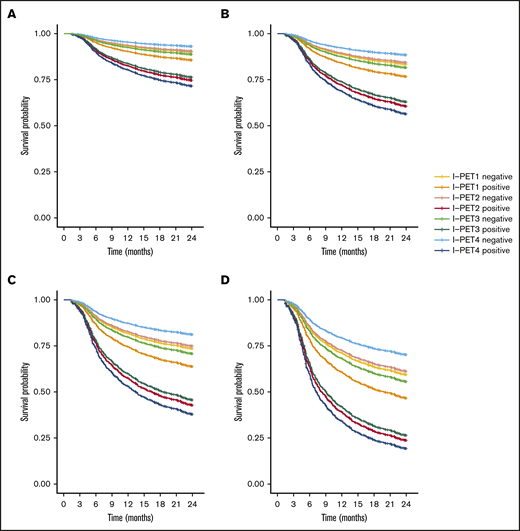
I-PET2 and I-PET4 significantly discriminated good responders and poor responders (Table 1), with higher HRs for I-PET4 for a PET-positive result using DS4-5–positive (HR, 1.71 and 2.95; Figure 3), DS5-positive (HR, 4.91 and 6.20; Figure 4), and ΔSUVmax (HR, 2.93 and 4.65; Figure 5) criteria. Unlike I-PET1, I-PET3 discriminated good responders and poor responders using DS4-5 and DS5 PET response criteria (HR, 2.94 and 4.67) but not ΔSUVmax.
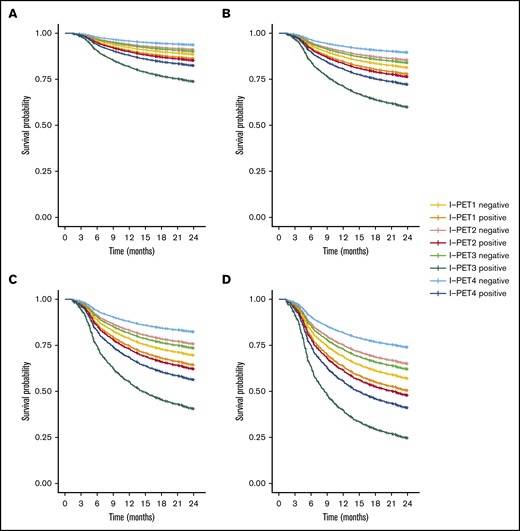
Two-year PFS Cox regression stratified for DS4-5 I-PET–positive patients and timing. Corrected for low-risk (A), low-intermediate risk (B), high-intermediate risk (C), and high-risk (D) IPI groups.
Two-year PFS Cox regression stratified for DS4-5 I-PET–positive patients and timing. Corrected for low-risk (A), low-intermediate risk (B), high-intermediate risk (C), and high-risk (D) IPI groups.
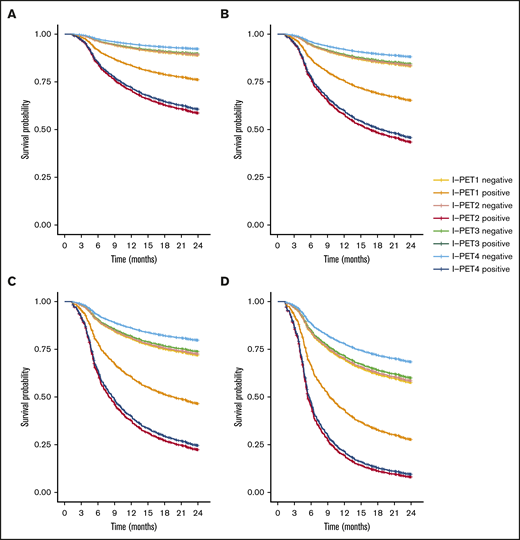
Two-year PFS Cox regression stratified for DS5 I-PET–positive patients and timing. Corrected for low-risk (A), low-intermediate risk (B), high-intermediate risk (C), and high-risk (D) IPI groups. For all risk groups, I-PET2–positive and I-PET3–positive regression curves are superimposed.
Two-year PFS Cox regression stratified for DS5 I-PET–positive patients and timing. Corrected for low-risk (A), low-intermediate risk (B), high-intermediate risk (C), and high-risk (D) IPI groups. For all risk groups, I-PET2–positive and I-PET3–positive regression curves are superimposed.
Two-year PFS Cox regression stratified for ΔSUVmax I-PET–positive patients and timing. Corrected for low-risk (A), low-intermediate risk (B), high-intermediate risk (C), and high-risk (D) IPI groups.
Two-year PFS Cox regression stratified for ΔSUVmax I-PET–positive patients and timing. Corrected for low-risk (A), low-intermediate risk (B), high-intermediate risk (C), and high-risk (D) IPI groups.
Optimal timing for I-PET scans
HRs were lowest for I-PET1 and increased for later PET scans with highest HRs at I-PET4 for all criteria. HRs at I-PET3 were lower than HRs for I-PET2 using ΔSUVmax and DS5 to define PET response. NPV was high for all criteria at both I-PET 2 and I-PET4 (range, 80.0% to 84.7%; Table 2). The PPV was higher at I-PET4 than at I-PET2 for DS4-5 (42.6% and 30.5%), DS5 (70.0% and 68.5%), and ΔSUVmax (57.4% and 45.7%) criteria.
PPV and NPV using DS4-5, DS5, or ΔSUVmax to assign a PET-positive result at I-PET2 and I-PET4
| I-PET criteria | PPV (95% CI) | NPV (95% CI) | |
|---|---|---|---|
| I-PET2 | DS1-3 vs DS4-5 | 30.5 (26.2-33.8) | 82.9 (80.0-85.7) |
| DS1-4 vs DS5 | 68.5 (56.6-80.3) | 80.0 (77.5-82.5) | |
| ΔSUVmax | 45.7 (37.3-54.1) | 80.6 (78.1-83.2) | |
| I-PET4 | DS1-3 vs DS4-5 | 42.6 (33.0-52.3) | 84.7 (81.1-88.3) |
| DS1-4 vs DS5 | 70.0 (51.7-88.3) | 81.5 (77.9-85.0) | |
| ΔSUVmax | 57.4 (41.2-73.5) | 82.2 (78.0-86.4) |
Good responders at I-PET4 had a significantly higher survival compared with good responders at I-PET2 for all PET positivity criteria (DS4-5 negative: HR, 0.70; DS5 negative: HR, 0.74; and ΔSUVmax negative: HR, 0.72; supplemental Table 6). There were no significant differences in PFS between good responders at other time points compared with I-PET2. There were no significant differences between poor responders at all time points compared with I-PET2 (supplemental Table 6). The tables for TTP and OS as outcome parameters are similar (supplemental Tables 7-12).
Discussion
I-PET was predictive in all IPI risk groups in this meta-analysis of individual patient data. PET criteria that applied ΔSUVmax and DS5 positivity discriminate good responders from poor responders better than DS4-5 positivity criteria. But the DS5 criterion identified only a very small number of patients. Performing I-PET scans at later time points during therapy improved patient stratification. Limited data for I-PET1 and I-PET3 timings precluded firm conclusions from being drawn about these time points.
We found a univariable HR of 2.20 (95% CI, 1.79-2.69) for I-PET using DS4-5 positivity criteria, confirming the predictive value of I-PET scans in patients with DLBCL. In this study, the univariable HR was lower than the pooled univariable HR of 3.13 (95% CI, 2.52-3.89) reported in a recent meta-analysis.3 This difference in HRs can be explained partly because different definitions of outcome parameters and different response criteria were used in various studies. Moreover, we included recent, larger trials (PETAL, HOVON84) that reported lower HRs than the ones included in this meta-analysis. The higher HR using ΔSUVmax positivity criteria is in line with other recent studies, which reported that ΔSUVmax positivity criteria better discriminated poor responders and good responders at I-PET scans compared with currently used DS4-5–positivity criteria.11,20,21
Our results showed that I-PET scans of patients with DLBCL have an NPV >80% for 2-year PFS, which is in line with previously published results.3,22,23 In the literature, PPVs at I-PET2 ranged between 37% and 74% using DS4-5 criteria,3 which were higher than the PPV of 30.5% for DS4-5–positive patients at I-PET2 in this study. This difference can be explained by the fact that 40.3% of the patients with an I-PET scan after 2 cycles were from the PETAL trial, and the PPV of DS4-5 in the PETAL trial was 26.4% (data not shown). Nyilas et al23 retrospectively included mainly patients with an I-PET after 4 cycles and reported a PPV of 48%, which is slightly higher than our PPV of 42.6% at I-PET4. The PPV of ΔSUVmax–positivity criteria was higher in our study, which confirms the higher PPV using ΔSUVmax–positivity criteria in the PETAL trial.24 For all PET-positivity criteria, PPVs are rather low, but both PPV and NPV are dependent on the prevalence of the outcome. Because the prior probability (ie, prevalence) of progression is 21.9% in our data, it is hard to reach a high PPV. After I-PET scans, the posterior probability increases for poor responders (ie, increase in PPV) and decreases for good responders (ie, high NPV), further stratifying risk groups.
These results show that I-PET scans have the potential to guide risk-adapted therapy. By detecting suboptimal response, therapy can be adapted earlier, potentially leading to higher cure rates and lower toxicity. DS5 patients have the worst response and can be identified as early as I-PET2 because PPV at I-PET2 is similar to that at I-PET4. For ΔSUVmax-positive and DS4 patients, I-PET4 would be the optimal timing, because the discriminative power is higher at I-PET4. However, I-PET4 is quite late for an I-PET–based strategy, so the importance of a high predictive value should be balanced with the reduced potential for early treatment escalation in the case of ineffective chemotherapy. In clinical trials, I-PET can be used to power new trials that investigate the potential of new drugs for treating patients who have DLBCL and a DS5 at I-PET2 or with a poor response using ΔSUVmax criteria at I-PET4. So far, I-PET2–based treatment escalation has not been effective in DLBCL.13 When detecting good response from I-PET scans, de-escalation of therapy might be considered. For treatment de-escalation, I-PET2 seems to be the optimal timing. A recent trial showed that treatment de-escalation seems feasible for patients with DLBCL between ages 18 and 60 years who have a favorable prognosis, because treatment with 4 cycles of R-CHOP plus 2 cycles of rituximab was noninferior to 6 cycles of R-CHOP.25 Moreover, interim-PET–guided treatment in limited-stage nonbulky de novo DLBCL resulted in high survival rates for poor responders and good responders at I-PET.26 Similar approaches could be considered for all DLBCL patients with a good response at I-PET2.
This study had several strengths. By collecting individual patient data from high-quality studies that performed an I-PET at multiple time points and by collecting both DS and ΔSUVmax data, our analysis enabled us to determine the optimal timing and make firmer conclusions on optimal criteria for I-PET in DLBCL. Furthermore, survival data were harmonized by re-calculating the follow-up between original studies. All available I-PETs without DS or ΔSUVmax data were re-reviewed. The lack of standardization between I-PET response criteria was overcome by re-classifying DS5 patients on a semi-quantitative basis. This recalculation of variables in the PETRA database allowed for a statistically more robust analysis of effect modifiers. We were also able to correct for differences in baseline patient characteristics between individual patients. Moreover, there was low risk of bias in our included studies according to QUIPS screening criteria. We decided to truncate survival at 2 years, because most clinically relevant events occur during this period. A recent IPD analysis showed that patients who are alive without progression at 2 years have survival rates similar to those of the age-, sex-, and country-matched population 7 years after this time.27
A limitation of this study was that for some patients, the baseline PET scan was not performed, which precluded calculation of ΔSUVmax. However, this should not bias our results because the DS was not different between the patients with and without a baseline PET/CT scan. We decided to use PFS as the primary outcome parameter because it is widely accepted. However, PFS is affected by age.28 Outcome of older patients is determined not only by lymphoma but also by age-related comorbidities, adverse treatment effects, and limited life expectancy in general. Note that all findings were consistent when considering TTP and OS instead of PFS.
Future studies should focus on improving the PPV by further stratifying patients into risk groups based on baseline PET characteristics such as metabolic tumor volume29 and dissemination30 and by improving the criteria for assigning a PET-positive result at I-PET. In addition, the effect of therapy on I-PET criteria requires further study, because all patients in our analysis were treated with R-CHOP.
In conclusion, the best response criterion at I-PET was ΔSUVmax, which had higher discriminative power and predictive values than DS4-5 criteria. Although the DS5 criterion had a higher discriminative power than ΔSUVmax, it identified a smaller group of poor responders. The optimal timing for identifying good responders is after 2 cycles. Good response at I-PET2 may qualify as a starting point for de-escalation trials. Poor response at I-PET4 using ΔSUVmax response criteria may work best for randomized trials evaluating new therapy regimens. However, optimal timing and response criteria may vary, depending on the clinical context of the study.
Presented at the 61st annual meeting of the American Society of Hematology, Orlando, FL, 7-10 December 2019.
De-identified individual participant data can be requested through the PETRA consortium (https://petralymphoma.org), and more information can be obtained either via the contact form on the Web site or by sending an e-mail to the consortium at petra@amsterdamumc.nl. Requests will be evaluated and approved by the PETRA steering committee.
Acknowledgments
The authors thank all the patients who took part in the trials, the collaborating investigators who kindly supplied their data, all data managers, and the central and local review groups who scored the I-PET scans.
This work was supported by a grant from the Alpe d’HuZes (#VU 2012-5848) provided by the Dutch Cancer Society. The sponsor had no role in gathering, analyzing, or interpreting the data. S.F.B. acknowledges support from the National Institute for Health Research and Social Care (NIHR) (RP-2-16-07-001). King's College London and University College London Comprehensive Cancer Imaging Center is funded by Cancer Research United Kingdom and Engineering and Physical Sciences Research Council (EPSRC) in association with the Medical Research Council and Department of Health and Social Care. S.F.B. was also supported by the Wellcome/EPSRC Centre for Medical Engineering at King’s College London (WT 203148/Z/16/Z).
The views expressed are those of the author(s) and not necessarily those of the National Health Service, the NIHR, or the Department of Health and Social Care.
Authorship
Contribution: J.J.E., C.N.B., H.C.W.d.V., O.S.H., R.B., and J.M.Z. contributed to the concept and design of the study; U.D., A.H., C.S., S.M., P.J.L., S.F.B., N.G.M., R.C., S.C., T.G., L.C., E.Z., M.H., L.K., A.L., and S.F. acquired the data; J.J.E., C.N.B., S.P., and S.E.W. collected and harmonized the data; J.J.E. and M.W.H performed the statistical analysis; J.J.E. wrote the draft of the manuscript; and all authors helped interpret the data and critically reviewed and approved the manuscript.
Conflict-of-interest disclosure: U.D. received research funding from Amgen and Roche and honoraria for participating in advisory boards from Amgen and Roche. P.J.L. received research funding from Takeda, Servier, and Roche and honoraria for participating in advisory boards from Takeda, Servier, Roche, Genmab, Celgene, Regeneron, and Incyte. S.F.B. is on the speakers bureau for Takeda and Hoffman la Roche and received departmental funding from Bristol Myers Squibb, Pfizer, and Amgen. J.M.Z. received research funding from Roche and received honoraria for participating in advisory boards from Takeda, Gilead, and Roche. The remaining authors declare no competing financial interests.
Correspondence: J. J. Eertink, Department of Hematology, Amsterdam UMC, Vrije Universiteit Amsterdam, De Boelelaan 1117, 1081 HV Amsterdam, The Netherlands; e-mail: j.eertink@amsterdamumc.nl; and H. C. W. de Vet, Department of Epidemiology and Data Science, Amsterdam UMC, Vrije Universiteit Amsterdam, De Boelelaan 1117, 1081 HV Amsterdam, The Netherlands; e-mail: hcw.devet@amsterdamumc.nl.

