

Abstract
Standardization of the detection and quantification of leukocyte differentiation markers by the EuroFlow Consortium has led to a major step forward in the integration of flow cytometry into classification of leukemia and lymphoma. In our opinion, this now enables introduction of markers for more dynamic parameters, such as proliferative and (anti)apoptotic markers, which have proven their value in the field of histopathology in the diagnostic process of solid tumors and lymphoma. Although use of proliferative and (anti)apoptotic markers as objective parameters in the diagnostic process of myeloid malignancies was studied in the past decades, this did not result in the incorporation of these biomarkers into clinical diagnosis. This review addresses the potential of these markers for implementation in the current, state-of-the-art multiparameter analysis of myeloid malignancies. The reviewed studies clearly recognize the importance of proliferation and apoptotic mechanisms in the pathogenesis of bone marrow (BM) malignancies. The literature is, however, contradictory on the role of these processes in myelodysplastic syndrome (MDS), MDS/myeloproliferative neoplasms, and acute myeloid leukemia. Furthermore, several studies underline the need for the analysis of the proliferative and apoptotic rates in subsets of hematopoietic BM cell lineages and argue that these results can have diagnostic and prognostic value in patients with myeloid malignancies. Recent developments in multiparameter flow cytometry now allow quantification of proliferative and (anti)apoptotic indicators in myeloid cells during their different maturation stages of separate hematopoietic cell lineages. This will lead to a better understanding of the biology and pathogenesis of these malignancies.
Introduction
Bone marrow (BM) malignancies comprise a spectrum of disorders in which 1 or more blood cell types accumulate in the BM.1 One group of BM malignancies originates in myeloid cell lineages, called myeloid malignancies.1,2 These comprise myelodysplastic syndromes (MDSs), myeloproliferative neoplasms (MPNs), MDS/MPN overlapping syndromes, and acute myeloid leukemia (AML). Table 1 presents the different characteristics of these myeloid malignancies, illustrating their overlapping and distinguishing parameters. For example, MPNs are characterized by the accumulation of a malignant cell clone as a result of somatic mutations that lead to its aberrantly upregulated proliferative capacity.2 This hyperproliferation results from specific driver mutations, such as JAK2-V617F and BCR-ABL mutations, that encode cell signaling proteins, which deregulate pathways of cell proliferation.3-8 This ultimately leads to hypercellularity of mature blood cells in the BM and peripheral blood.
Morphological characteristics of different types of myeloid malignancies
| AML | MDS | MDS/MPN | MPN | |
|---|---|---|---|---|
| BM blasts, % | >20 | <20 | <20 | <20 |
| PB cytopenia | ± | + | ± | — |
| BM cellularity | ± | + | + | ++ |
| PB cytosis | ± | + | + | ++ |
| AML | MDS | MDS/MPN | MPN | |
|---|---|---|---|---|
| BM blasts, % | >20 | <20 | <20 | <20 |
| PB cytopenia | ± | + | ± | — |
| BM cellularity | ± | + | + | ++ |
| PB cytosis | ± | + | + | ++ |
PB, peripheral blood.
In contrast, MDS is caused by dysplasia that results from ineffective hematopoiesis caused by the defective production of a specific type of blood cell (precursor) because of a wide variety of mutations. No specific driver mutations causing dysplasia are recognized in MDS. MDS/MPN is a clonal myeloid disorder that possesses both dysplastic and proliferative features and is therefore not properly classified as either MDS or MPN.1
Furthermore, all these malignancies can eventually transform into the more aggressive AML as a result of additional mutations, in which myeloid blast cells become malignant and rapidly overtake the BM.1,9 This causes severe cytopenias and spreading of the malignant clone to the blood and other organs. This leads to a wide range of possible comorbidities and complications, increasing in frequency in older individuals and resulting in a high rate of mortality.
A key issue in the diagnostic process of myeloid malignancies is that it comprises various techniques (morphological, flow cytometric, molecular, and cytogenetic analyses).10-12 These techniques are rather time consuming, and morphological and flow cytometric analyses are prone to subjective interpretation.10,11
The increased importance of flow cytometry in the diagnosis of hematological neoplasms is underlined by its expanding applications in the diagnosis of these neoplasms, as indicated in the World Health Organization recommendations.13,14 The main problem in this field is, however, the lack of objectivity of flow cytometric analyses. In the last decade, much effort was taken to make flow cytometric analyses of myeloid malignancies objective, resulting in the Ogata score, for example.15 However, the rather objective Ogata score and the flow cytometric scoring system, which are part of the diagnostic workup of MDS, could not be used to identify other types of myeloid malignancies.12,16
As part of the 2006 Bethesda Consensus Conference, a committee of experts in the field of hematology defined recommendations for the flow cytometric analysis of hematological neoplasms in an effort to standardize the diagnostic process.15 Also, in light of the flow cytometric analysis of hematological neoplasms being made more objective, the EuroFlow Consortium standardized the detection of leukocyte differentiation markers,17-19 which led to the release of Infinicyt software.
Infinicyt software allows the simultaneous analysis of multiple standardized marker panels and expands the number of parameters that can be analyzed by multiparameter flow cytometry from 10 to 12 parameters to a multiplication of 10 to 12, based on the number of standardized marker combinations.
Standardization of the detection of leukocyte differentiation markers allows the introduction of more dynamic markers, such as proliferative and apoptotic markers. Aberrations in the balance between proliferation and apoptosis are a cornerstone of the malignant transformation of blood precursor cells in BM tissue. Through this and many other cell-intrinsic and -extrinsic factors, such as conditions in the BM niche and the immune system, dominance of the malignant clone is maintained. Although myeloid malignancies originate in a variety of different cell types and exhibit a broad spectrum of phenotypes, all malignancies possess the common feature that the balance between proliferation and apoptosis is disturbed.16,20
In histopathology, the proliferative and apoptotic indices have proven their value for diagnostic and prognostic applications in a broad spectrum of malignancies, including solid tumors and lymphoma21-28 (Figure 1 shows examples of Ki-67–immunostained tissue sections of non-Hodgkin lymphoma). Also, their potential use in the diagnostic process of myeloid malignancies was studied in the past decades, but this did not eventually result in the incorporation of these dynamic markers into flow cytometric panels for clinical applications.29 This omission is partly due to the limited number of (additional differentiation) parameters that could be simultaneously analyzed by flow cytometry at the time that these proliferative and apoptotic indices were initially studied in myeloid malignancies. These limited panels did not allow the distinction between the differentiation stages of individual hematopoietic cell populations at that time.
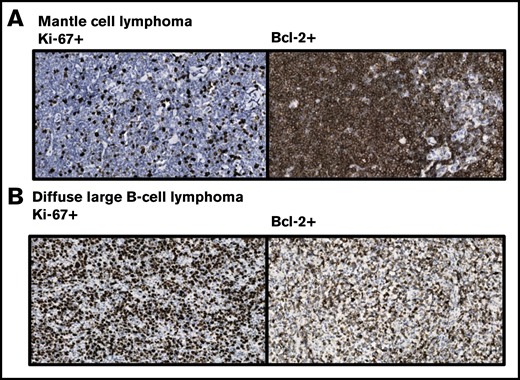
Immunohistochemical staining pattern of lymphoma with the horseradish peroxidase–labelled Ki-67 antibody MIB-1 and Bcl-2 antibody Bcl2/100, showing their reactivity in mantle cell lymphoma and diffuse large B-cell lymphoma. Cells were stained with 3,3'-diaminobenzidine for detection of Ki-67 and Bcl-2 expression (brown staining) and with hematoxylin for visualization of nuclei (blue staining). (A) In this mantle cell lymphoma, Ki-67 is weakly expressed, whereas strong expression of Bcl-2 is observed. However, these markers are known to be differentially expressed in mantle cell lymphoma. (B) Strong Ki- 67 and Bcl-2 expression is observed in the presented diffuse large B-cell lymphoma. These markers are primarily used for subtyping this group of malignancies. Provided by Ruud Clarijs, Department of Pathology, Zuyderland Medical Centre (magnification ×400).
Immunohistochemical staining pattern of lymphoma with the horseradish peroxidase–labelled Ki-67 antibody MIB-1 and Bcl-2 antibody Bcl2/100, showing their reactivity in mantle cell lymphoma and diffuse large B-cell lymphoma. Cells were stained with 3,3'-diaminobenzidine for detection of Ki-67 and Bcl-2 expression (brown staining) and with hematoxylin for visualization of nuclei (blue staining). (A) In this mantle cell lymphoma, Ki-67 is weakly expressed, whereas strong expression of Bcl-2 is observed. However, these markers are known to be differentially expressed in mantle cell lymphoma. (B) Strong Ki- 67 and Bcl-2 expression is observed in the presented diffuse large B-cell lymphoma. These markers are primarily used for subtyping this group of malignancies. Provided by Ruud Clarijs, Department of Pathology, Zuyderland Medical Centre (magnification ×400).
Recent developments in multiparameter flow cytometry allow the analysis of proliferative and apoptotic indices in specific phases of maturation of hematopoietic cell populations.30-32 This review addresses the potential of proliferative and apoptotic marker implementation into the current, state-of-the-art multiparameter analysis of myeloid malignancies.
Markers to determine proliferative activity
There is a large volume of published studies describing different approaches to determine the proliferative activity of cells in tissues and cell suspensions (Figure 2A). One group of markers comprises fluorescent DNA intercalating dyes,33,34 which allow the quantification of dividing cells in S phase at a particular time point and under specific growth conditions.
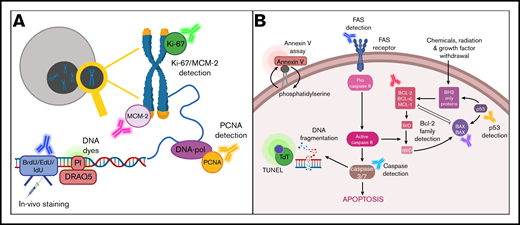
Schematic overview of markers for detection of proliferation and apoptosis. (A) Markers for detection of proliferation include Ki-67, MCM-2, and proliferating cell nuclear antigen (PCNA); quantification of DNA content using intercalating DNA dyes such as propidium iodide (PI) and DRAQ5; and immunostaining for incorporated 5-bromo-2′-deoxyuridine (BrdU), 5-iodo-2′-deoxyuridine (IdU), and 5-ethynyl-2′-deoxyuridine (EdU). (B) Markers for detection of apoptosis include annexin V, DNA fragmentation as determined by the terminal deoxynucleotidyltransferase (TdT)–mediated dUTP nick end labeling (TUNEL) assay, FAS detection, and detection of members of the Bcl-2 protein family or caspase activation.
Schematic overview of markers for detection of proliferation and apoptosis. (A) Markers for detection of proliferation include Ki-67, MCM-2, and proliferating cell nuclear antigen (PCNA); quantification of DNA content using intercalating DNA dyes such as propidium iodide (PI) and DRAQ5; and immunostaining for incorporated 5-bromo-2′-deoxyuridine (BrdU), 5-iodo-2′-deoxyuridine (IdU), and 5-ethynyl-2′-deoxyuridine (EdU). (B) Markers for detection of apoptosis include annexin V, DNA fragmentation as determined by the terminal deoxynucleotidyltransferase (TdT)–mediated dUTP nick end labeling (TUNEL) assay, FAS detection, and detection of members of the Bcl-2 protein family or caspase activation.
Another approach to determine proliferative activity applies in vitro or in vivo labeling of cells using synthetic thymidine analogs, such as BrdU, EdU, or 3H-thymidine (TdR).35,36 These compounds are incorporated into newly synthesized DNA during S phase and therefore allow tracking of the proliferative cell fraction.
To detect BrdU (Figure 3) and EdU after injection in vivo or incubation of cells in vitro, DNA is denaturated and the thymidine analog visualized by using fluorescently or enzyme-labeled antibodies. TdR is detected and quantified by liquid scintillation counting methods through the radioactive signal emitted by the 3H component. A caveat in the use of these techniques in in vivo clinical studies is that these analogs could cause mutations in the genome of patients who are to be injected with these compounds beforehand.
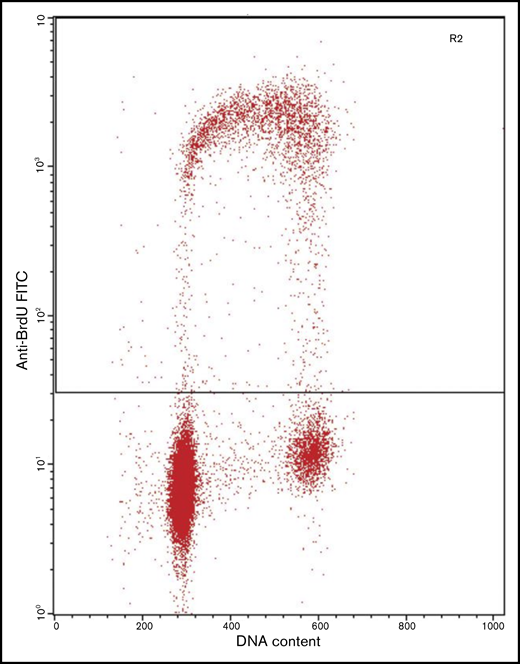
Flow cytometric analysis of a cell culture immunolabeled after incorporation of BrdU, showing strong positivity in the cells in S phase. BrdU staining intensity is plotted against DNA content as determined by PI staining intensity. The cell population in the lower left corner represents cells with 2n DNA (G0 and G1 phases of the cell cycle). Cells with 4n DNA (G2 and M phases of the cell cycle) are observed in the lower right corner. Cells with 2n and 4n DNA are negative for BrdU staining, whereas cells in the S phase of the cell cycle (in between cell populations with 2n and 4n DNA) are positive for BrdU staining. FITC, fluorescein isothiocyanate. Provided by Bert Schutte, Department of Molecular Cell Biology, Maastricht University Medical Centre.
Flow cytometric analysis of a cell culture immunolabeled after incorporation of BrdU, showing strong positivity in the cells in S phase. BrdU staining intensity is plotted against DNA content as determined by PI staining intensity. The cell population in the lower left corner represents cells with 2n DNA (G0 and G1 phases of the cell cycle). Cells with 4n DNA (G2 and M phases of the cell cycle) are observed in the lower right corner. Cells with 2n and 4n DNA are negative for BrdU staining, whereas cells in the S phase of the cell cycle (in between cell populations with 2n and 4n DNA) are positive for BrdU staining. FITC, fluorescein isothiocyanate. Provided by Bert Schutte, Department of Molecular Cell Biology, Maastricht University Medical Centre.
After several decades, carboxyfluorescein diacetate succinimidyl ester (CFSE) was introduced as an alternative to synthetic thymidine analogs.37,38 CFSE is introduced into cell populations as membrane permeable CFSE (CFDA-SE). After CFDA-SE diffuses across the cell membrane, enzyme reactions with cellular esterases cleave the acetate groups, resulting in highly fluorescent and membrane-impermeable CFSE. During cell division, the CFSE fluorescence intensity is split roughly evenly between the 2 daughter cells. Thus, determination of the fluorescence intensity provides an indirect measure of the number of divisions a cell has undergone. Typically, the fluorescence emitted by CFSE is detectable for ∼8 successive cell divisions. Although CFSE is more stably and evenly incorporated into cells than synthetic thymidine analogs, such DNA dyes generate large amounts of spectral overlap in a majority of flow cytometric detection channels.
Another commonly used approach to determine the proliferative activity of normal and diseased cells is the immunohistochemical detection of proteins involved in the regulation of proliferation. Representatives of these proteins include Ki-67, PCNA, and MCM-2.39-41 An advantage of this approach is that these proteins can be detected and quantified ex vivo after tissue sampling. These proliferation markers are (over)expressed during the G1, S, and G2-M phases of the cell cycle, whereas no or low expression levels are observed during the G0 phase. However, the expression of these proteins involved in the cell cycle is not bimodal; rather, a sliding scale of expression levels is seen depending on the stage of the cell cycle at which the cell is immunostained.
Markers to determine the apoptotic fraction
Several approaches have been described to investigate and quantify the apoptotic fraction of healthy and diseased cells (Figure 2B). The signaling pathway comprises various events after induction of apoptosis, which include the expression of proapoptotic proteins and activation of caspases. Caspases cleave cellular protein constituents and at the same time activate other caspases for degradation processes further downstream. Also, nucleases are activated, resulting in the fragmentation of nuclear DNA. In a final stage of this cascade, when the cell starts to fragment, the translocation of phosphatidylserine (PS) to the extracellular surface of the membrane marks the apoptotic cell remnants for degradation by phagocytosis.
DNA fragmentation during apoptosis can be detected by the TUNEL assay,42 which relies on terminal deoxynucleotidyltransferase to catalyze the incorporation of deoxynucleotides, which are tagged with a detection marker, at double-strand breaks induced by the apoptotic process.
A method to detect PS exposure during apoptosis is the annexin V/PI assay.43,44 The combination of using annexin V (labeled with a fluorochrome) and PI allows the distinction between viable, apoptotic, and necrotic cells. Whereas annexin V (or annexin 5a) specifically binds PS that is translocated to the extracellular membrane in the execution phase of apoptosis, PI exclusively stains nuclear DNA in cells with a compromised cell membrane. This means that viable cells show neither PI nor annexin V staining, whereas apoptotic cells are exclusively stained by annexin V, because such apoptotic cells and cell remnants retain an intact cell membrane. Necrotic cells and cells damaged during the isolation procedure become positive for both annexin V and PI, because both components can enter the cell as a result of its compromised membrane (Figure 4).
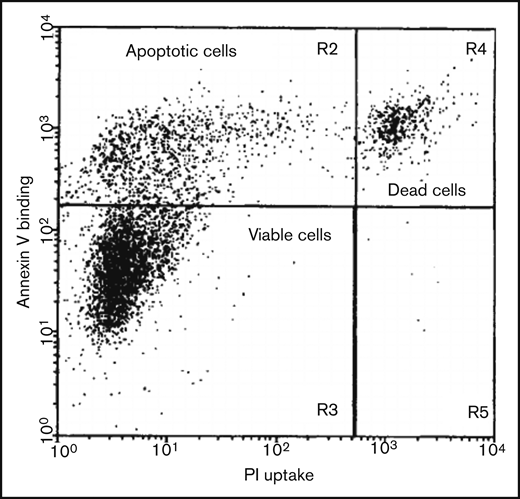
Two-dimensional flow cytometric analysis of a cell culture induced to undergo apoptosis, using annexin V affinity labeling of PS and PI uptake for DNA staining, allowing the distinction of viable, apoptotic, and dead cells. Viable cells show neither PI nor annexin V staining, whereas apoptotic cells are exclusively stained by annexin V. Necrotic (dead) cells and cells damaged during the isolation procedure become positive for both annexin V and PI. Reproduced from van Engeland et al43 with permission.
Two-dimensional flow cytometric analysis of a cell culture induced to undergo apoptosis, using annexin V affinity labeling of PS and PI uptake for DNA staining, allowing the distinction of viable, apoptotic, and dead cells. Viable cells show neither PI nor annexin V staining, whereas apoptotic cells are exclusively stained by annexin V. Necrotic (dead) cells and cells damaged during the isolation procedure become positive for both annexin V and PI. Reproduced from van Engeland et al43 with permission.
Apoptosis can also be detected by immunohistochemical staining of pro- and antiapoptotic proteins. These include, among others, the Bcl-2 family members Bcl-2, Bax, Bcl-xL, and Bcl-w as well as survivin, activated caspases, and p53.45-51 Whereas the annexin V/PI test is exclusively applicable in flow cytometric assays, the TUNEL assay and detection protocols for pro- and antiapoptotic proteins (which make use of antibodies) can also be applied to fixed cells in cytospins and tissue sections.
Finally, the Fas receptor protein interacts with Fas ligand (FasL), predominantly expressed on cytotoxic T cells, to induce apoptosis.52 Expression of the Fas receptor indicates susceptibility to apoptosis induction and can therefore be used as an apoptotic marker when detected with enzyme- or fluorescently labeled Fas receptor antibodies. Because the Fas receptor and FasL are both extracellular proteins, this allows simple detection within flow cytometric assays. Furthermore, these markers can also be deployed for immunohistochemical analyses and cytospins.53
Proliferation and apoptosis in myeloid malignancies
There is a relatively small body of literature that describes the role of proliferation and apoptosis in the origin and progression of myeloid malignancies. In MPNs, the roles of proliferation and apoptosis are clearly understood because of the well-described genetic backgrounds of these neoplasms. Somatic mutations that influence the proliferative and apoptotic pathways include JAK2-V617, CALR, and BCR-ABL mutations.54-56 Malherbe et al57 found in 81 MPN patients that proliferation was increased and apoptosis was reduced in the malignant cell clone. Proliferative activity was assessed by means of the proliferation marker Ki-67, and the fraction of apoptotic cells was assessed by the balance between the antiapoptotic protein Bcl-xL and the proapoptotic protein BNIP-3.
Opposing results for MDS, MDS/MPN, and AML make it difficult to draw definitive conclusions.29,30,58-61 However, more detailed analysis of the proliferative activity of the BM cell compartments within the distinct diagnostic and prognostic subtypes of MDS and AML has highlighted the existence of significantly different proliferation profiles in low- vs high-risk MDS and AML cases.30 Low-grade MDS patients showed an increased proliferation in BM cells at the expense of the proliferative activity of CD34+ blast cells.29 In high-grade MDS and AML, patients showed a significantly decreased proliferative activity in various BM cell compartments as well as in CD34+ blast cells when compared with normal BM.
Furthermore, several studies have also shown differences in apoptotic rates in low-grade MDS vs high-grade MDS and AML patients.29,62,63 Low-grade MDS patients were found to experience predominant apoptosis, which explains the cytopenias.
In contrast, high-risk MDS and AML are characterized by decreased levels of apoptosis as compared with normal BM. During progression of MDS, CXCL12, which is expressed on reticular cells in the BM, was shown to induce expression of Bcl-2 in surrounding blast cells.61 This antiapoptotic protein, which is frequently overexpressed in blast cells, protects these cells from apoptosis and enhances their survival. Antiapoptotic signaling plays a crucial role in the progression of MDS and AML.29 This antiapoptotic phenotype of blast cells in the BM in turn allows the accumulation of blast cells, thereby mediating the transformation to AML. In a study by Abe-Suzuki et al,61 a lower apoptotic fraction of BM cells was indeed observed in CXCL12-high MDS patients compared with CXCL12-low patients, as measured by a TUNEL assay. Furthermore, this study demonstrated that CXCL12-high MDS patients had a higher tendency to experience disease transformation to the more severe EB-1 and EB-2 phenotypes and eventually to AML.
The process of pyroptosis has been identified as a relevant biological mechanism of cell death in myeloid malignancies, a process that is mediated by inflammatory mediators activating the innate immune system.64,65 This activation occurs through interactions of damage-associated molecular patterns and alarmins that interact with toll-like receptor 4 or CD33. These interactions, together with the formation of reactive oxygen species, contribute to the formation of the NLRP3 inflammasome. The formation of these inflammasomes then catalyzes the activation of caspase-1, ultimately leading to cell death. Pyroptosis is known to play a role in MDS and AML and should be considered when assessing the balance between proliferation and cell death in these malignancies. Pyroptotic cells can be quantified by flow cytometric detection of caspase-1, because this caspase is activated exclusively by the pyroptotic pathway.66 However, because this review focuses on the balance between proliferation and apoptosis in particular, we did not further consider markers for pyroptotic cell death.
Taken together, these studies indicate that determining proliferative and apoptotic activity in a multiparameter setting could be of diagnostic value for MDS and AML, but these parameters should be determined in a disease-specific and stage-dependent manner. Because combined features of MPNs and MDS are encountered in the MDS/MPN overlapping syndrome, more detailed analyses of proliferative and apoptotic parameters in these malignancies is required to estimate whether these parameters can be of diagnostic potential in this overlapping phenotype.
Prognostic value in myeloid malignancies
Derailment of proliferation and apoptosis is involved in the origin of (pre)malignancies; however, it also plays a role in their progression to more advanced stages.20 A high proliferative and low apoptotic phenotype generally results in a high tumor growth rate, which correlates with the aggressiveness of the tumor and can therefore be a predictive parameter for the prognosis of the patient.
Most myeloid malignancies are treated with radio-, chemo-, and/or immunotherapy. A central element in the working mechanism of radio- and/or chemotherapy is that these therapies target dividing cells and activate apoptotic mechanisms. Furthermore, immunotherapy targets the growth and spread of the malignancy, which are processes that are also associated with proliferation and apoptosis. Therefore, decreased proliferation activity and increased apoptotic potential are tightly linked to therapy response in those receiving radio-, chemo-, and/or immunotherapy. Data from several studies suggest that analysis of proliferation and apoptosis could be used for prognostic purposes in these malignancies. These studies were selected based on eligibility and number of patients analyzed (total number of patients analyzed >10; Table 2).
Summary of reviewed studies (including results) involving role of proliferation and apoptosis in MDS, MDS/MPN, and AML
| Study | BM malignancy (n) | Proliferation marker (↑/↓) | Apoptosis marker (↑/↓) | Prognostic value |
|---|---|---|---|---|
| Parker et al,29 2000 | MDS (67), AML (35) | — | Bax/Bad:Bcl-2/Bcl-x (↓) | Higher risk stratification |
| Matarraz et al,30 2012 | MDS (106) | DRAQ5 (↓) | — | Shorter survival, transformation to AML |
| Riccardi et al,67 1986 | AML (46) | PI staining (↑) | — | Shorter survival |
| Riccardi et al,68 1991 | AML (54) | BrdU staining (↑) | — | Complete remission, duration of remission |
| Brons et al,69 1993 | AML (33) | IdU staining (↑) | — | Longer 3-y survival, longer recurrence free survival |
| Alexandrakis et al,70 2004 | MDS (54) | Ki-67 (↑) | — | Higher risk of transformation |
| Alexandrakis et al,71 2005 | MDS (51) | PCNA (↑) | — | Higher risk of transformation |
| Allampallam et al,72 2002 | MDS (145) | IdU and BrdU (↓) | — | Higher risk of transformation |
| Davis et al,73 1998 | MDS (33) | — | Progression of MDS to AML | |
| Del Poeta et al,74 2003 | AML (255) | Bax:Bcl-2 (↓) | Shorter survival, disease-free survival, lower complete remission | |
| Mehta et al,75 2013 | AML (76) | — | Bcl-2 (↑) | Lower response to chemotherapy |
| Invernizzi et al,76 2004 | AML (98) | — | Survivin (↑) | Lower therapy response |
| Invernizzi et al,77 2006 | CMML (34) | — | Survivin (↑) | Shorter survival |
| Wagner et al,78 2006 | AML (74) | — | Survivin (↑) | Shorter survival |
| Gupta et al,79 1999 | MDS (50) | — | FasL (↑) | Shorter survival, transfusion dependency |
| Shimazaki et al,80 2000 | Control (10), MDS (51), AML (6) | — | DNA fragmentation (↑) | Shorter survival |
| Ohshima et al,81 2003 | Control (10), MDS (51), AML (6) | — | Caspase-3 (↑) | Shorter survival |
| Dereń-Wagemann and Kuliczkowski,82 2019 | AML (38) | — | Annexin V (↑) | Higher therapy response |
Direction of arrows (up or down) indicates whether patient group with higher or lower staining intensity, respectively, showed significantly different outcome (listed under final column).
CMML, chronic myelomonocytic leukemia.
Proliferation and prognosis
Flow cytometric analysis of the proliferative fraction of BM cells is of prognostic significance for AML patients (Table 2). Riccardi et al67 studied the proliferative fraction in 46 AML patients by S phase staining using PI and found that the proliferative fraction could be correlated with overall survival. These authors also presented a strategy to predict prognostic parameters of AML patients based on the flow cytometric analysis of the proliferative fraction of marrow cells.68 BM blast proliferation kinetics of 54 patients were studied with in vivo BrdU staining followed by flow cytometric analysis of the BM blast cells. A high proliferative rate in this progenitor cell compartment correlated with complete remission and duration of the remission in AML patients.
A similar study conducted by Brons et al69 demonstrated that proliferative activity could be used to predict survival. In this study, BM samples of 33 AML patients underwent IdU staining followed by flow cytometry to determine proliferative activity. High proliferative activity was associated with a significantly lower 3-year survival rate and a shorter recurrence-free survival period after treatment.
Subsequent studies presented evidence that immunohistochemical analysis of BM cells by means of the proliferation markers Ki-67 and PCNA predicts disease progression in MDS patients.70,71 BM samples of MDS patients were subjected to analysis of the proliferative fraction of myeloid cells (54 samples by Ki-67 and 51 by PCNA staining), which was found to be significantly higher in the high-risk MDS group as compared with the low-risk group.
Strikingly, and in contrast, Allampallam et al72 found a lower proliferative fraction in myeloid cells to be predictive for progression of MDS to AML. To assess the proliferative fraction of myeloid cells in the BM, 145 MDS patients underwent S phase staining with IdU and BrdU. The authors observed that the high-risk MDS group presented a significantly lower proliferative fraction of myeloid cells compared with the low-risk MDS group.
Apoptosis and prognosis
Several studies have correlated expression of the Bcl-2 protein family, members of which are involved in the regulation of apoptosis, with the clinical outcome of myeloid malignancies. In the study by Davis et al,73 high Bcl-2 expression in myeloid cells of the BM was correlated with progression of MDS and transformation to AML. This study included 33 BM samples, mainly derived from high-grade MDS patients (n = 25). Furthermore, the Bax/Bcl-2 ratio was associated with survival of AML patients. In another study, 255 de novo AML patients underwent flow cytometric analysis of Bax and Bcl-2 expression in blast cells.74 This study demonstrated that a low Bax/Bcl-2 ratio was associated with significantly shorter survival, shorter disease-free survival, and lower complete remission rates in AML patients.
In addition, detection of Bcl-2 expression could predict chemoresistance in AML patients, as reported by Mehta et al.75 In this study, 76 AML patients received treatment, and BM samples of these patients were subjected to flow cytometric analysis of Bcl-2 expression in blast cells, indicating that higher Bcl-2 expression was associated with a significantly lower response to chemotherapy.
Moreover, survivin expression can be used as a measure of resistance to apoptosis and was used to predict therapy response in AML patients.76 During this study, BM cells of 98 AML patients were analyzed for survivin expression. In a follow- up study,77 immunohistochemical staining of survivin in 34 CMML patients illustrated that higher survivin expression rates correlated with significantly shorter survival of CMML patients. Similar results were observed by Wagner et al,78 who analyzed survivin expression in 74 adult de novo AML patients.
Other studies have shown a correlation between apoptosis and the prognosis of patients with myeloid malignancies by using other methods to study apoptosis. For example, FasL expression on blast cells of the BM in 50 MDS patients, 30 of whom had high-grade MDS, predicted the survival and transfusion dependency of these patients.79 Furthermore, the apoptotic rate of CD34+ cells in MDS patients, as measured by the TUNEL assay, could be used to predict survival.80 In addition, expression of activated caspase-3 in MDS patients was associated with poor prognosis.81 Apoptosis was also correlated with a favorable outcome after chemotherapy by Deren-Wagemann and Kuliczkowski82 ; in their study, 38 AML patients underwent flow cytometric analysis of annexin V/PI.
Furthermore, the novel and recently US Food and Drug Administration–approved Bcl-2 inhibitor venetoclax is a promising therapeutic agent for treatment of high-risk MDS and AML and is often combined with chemotherapeutic agents.83-85 The high response rates to these therapeutic agents is influenced by the proliferative and antiapoptotic potential of the malignant cell population, underlining the importance of these parameters in the pathogenesis and treatment management of myeloid malignancies. Therefore, simultaneous detection of proliferative and apoptotic parameters in these cells could become a promising tool for prediction of response to this combination therapy.86
Utility for prognosis in a multiparameter setting
Proliferation and apoptotic markers could become promising targets for determining prognosis in myeloid malignancies. The results of the abovementioned conventional studies, most of which involved assessment by a single marker, clearly indicate that there is a relationship between the proliferative and apoptotic rates of various cell subsets in the BM and the prognosis of patients with myeloid malignancies. Combining both markers in a multiparameter setting could prove to be clinically useful. However, contradicting evidence was found in the reviewed studies, which described the relationship between proliferative and apoptotic rates and diagnosis, prognosis, and treatment response in myeloid malignancies. These studies investigated the BM cell population either as a whole or as subfractions with a limited number of parameters, including 1 or more proliferative and apoptotic parameters. Furthermore, changes in the proliferative and apoptotic rates in BM cells of myeloid malignancies are dependent on the cell subset that is assessed and on the type/stage of the myeloid malignancy. Therefore, further investigation regarding the application of proliferative and apoptotic parameters for prognosis or treatment response should be performed in a disease-, state-, and treatment-specific manner.
Implications of advances in flow cytometry
To integrate proliferative and apoptotic indices for clinical use in myeloid malignancies, it is of the utmost importance to dissect the biology within the complete hierarchy of the hematopoietic/leukemic development tree. The technical developments in flow cytometric analyses, together with the increasing knowledge about the expression profiles of differentiation markers in blood cell populations, allow the analysis of proliferative and apoptotic indices in myeloid cells during their maturation process.31,87 In the study by Nies et al,31 a flow cytometric assay for determination of the proliferating fraction during the maturation of various hematopoietic cell lineages was presented. This study showed that the progenitor cell populations during erythropoiesis in particular displayed a high proliferative capacity, which gradually decreased with maturation. This gradual decrease from a high proliferative capacity in the immature progenitor cell populations to a low proliferative capacity in mature cells was also observed duringmyelopoiesis and monopoiesis.
In a recent study,32 we used multiparameter flow cytometry and the combination of 15 CD markers and Ki-67 immunostaining to detect the proliferative fraction of individual cell populations in MPNs, MDS, and MDS/MPN. A schematic illustration of the flow cytometric assay used is shown in Figure 5. We investigated to what extent proliferative activity could be used for diagnostic purposes in these malignancies. BM aspirates from 74 patients with MPNs, MDS, or MDS/MPN and aspirates from 50 nonmalignant cases were analyzed by flow cytometry for Ki-67 expression separately during the various maturation steps within erythro-, myelo-, and monopoiesis. In the MPN patient cohort, the proliferative activity of all cell lineages was found to be significantly higher during almost all maturation stages compared with the benign control cohort. In the MDS and MDS/MPN cohort, a significantly lower proliferative activity was observed in the early maturation stages, whereas in the MDS/MPN patient cohort, increased proliferative activity was seen in the later stages of maturation. It was concluded that MDS and MDS/MPN display a distinct pattern in the proliferating fraction of maturating hematopoietic cells, which could become of added value in classifying these malignancies.
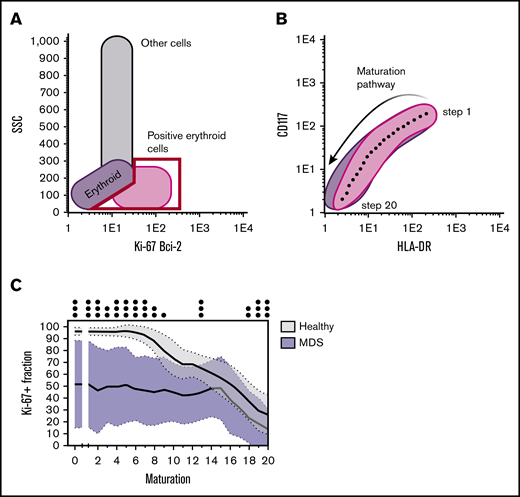
Schematic representation of the different steps to determine the proliferative and (anti-)apoptotic fractions in the different differentiation stages of maturating erythroid cells. (A) Either the Ki-67+ or Bcl-2+ fraction was first gated. (B) The maturation pathway was then drawn (based on CD117 and HLA-DR expression in the case of erythroid differentiation) and automatically divided into 20 equal maturation stages by the Infinicyt (version 2.0) software package. (C) The Ki-67+ or Bcl-2+ fraction was then calculated per maturation stage and plotted against the different maturation stages. The proliferative fraction of erythroid cells, as determined by the Ki-67+ fraction, was significantly lower for MDS patients in all stages of maturation compared with the proliferative fraction in healthy BM.32 SSC, side scatter.
Schematic representation of the different steps to determine the proliferative and (anti-)apoptotic fractions in the different differentiation stages of maturating erythroid cells. (A) Either the Ki-67+ or Bcl-2+ fraction was first gated. (B) The maturation pathway was then drawn (based on CD117 and HLA-DR expression in the case of erythroid differentiation) and automatically divided into 20 equal maturation stages by the Infinicyt (version 2.0) software package. (C) The Ki-67+ or Bcl-2+ fraction was then calculated per maturation stage and plotted against the different maturation stages. The proliferative fraction of erythroid cells, as determined by the Ki-67+ fraction, was significantly lower for MDS patients in all stages of maturation compared with the proliferative fraction in healthy BM.32 SSC, side scatter.
Clinical implementation of proliferative and apoptotic parameters
This review highlights several approaches for the detection of proliferative and apoptotic rates. Because some approaches require in vivo labeling, such as BrdU, EdU, TdR, and the TUNEL assay, these detection methods are less suitable for clinical implementation. However, such labeling methods do prove useful for in vivo experiments in a research setting. Fluorescent DNA intercalating dyes, such as PI and DRAQ5, are often used for cell cycle analyses and within the annexin V assay to distinguish apoptotic and necrotic cells. Furthermore, CFSE is a fluorescent compound that builds up within cells to follow the proliferative rate of cells and can be used for tracking the proliferative history of cells.38 Because these fluorescent compounds have a broad emission spectrum, the resulting spectral overlap in a majority of flow cytometric detection channels poses challenges for the integration of such compounds into panels for clinical use. Immunohistochemical staining of proliferation markers and apoptotic markers is routinely used in the clinical setting. These markers are detected by fluorescently labeled antibodies that can be easily incorporated into existing flow cytometric panels. FasL–Fas receptor interactions occur in the early stages of the apoptotic cascade, which means that antiapoptotic proteins upstream in the apoptotic cascade can prevent cells from undergoing apoptosis. Therefore, FasL–Fas receptor interactions are not predictive for apoptosis in all settings. However, staining of the proliferation marker Ki-67 and staining of pro- and antiapoptotic proteins of the Bcl-2 family are already routinely implemented for clinical use and are known for their widespread use in solid tumors and lymphoma. The reviewed studies also show an association between proliferation and apoptosis, as detected by Ki-67 and Bcl-2 family proteins, and diagnosis, prognosis, and treatment response. This further encourages implementation of such markers into existing flow cytometric panels for clinical use. Because pyroptotic cell death is of importance in low-grade MDS, markers for detecting the process of pyroptosis can be of additional value for assessing cell death in these malignancies. However, the number of markers available for detection of this cell death pathway is limited.
Future impact on clinical practice
Proliferative and apoptotic parameters can be determined via multiple methods, including flow cytometry, molecular diagnostics, and histopathological analysis. However, the use of molecular diagnostics is a rather costly method to determine the proliferative and apoptotic nature of myeloid malignancies. These malignancies comprise a broad spectrum of diseases, which increases the variety of genetic abnormalities that are encountered. Furthermore, a broad number of genetic abnormalities accumulate in these malignancies, which all eventually contribute to aberrancies in the balance between proliferation and apoptosis. Therefore, a more direct flow cytometric analysis of proliferative and apoptotic indices is a cost-efficient and relatively simple approach.
Although analysis of proliferative and apoptotic indices is widely applied in histopathology, flow cytometric analysis of these indices could be the preferred alternative for diagnosis of myeloid malignancies. The heterogeneity of the BM can be studied more accurately when a cell suspension of the BM is prepared compared with a tissue biopsy of the BM. The high number of cells that can be analyzed by flow cytometry increases the probability that rare populations or malignant clones will be detected during the diagnostic analysis.
Histopathological analysis has been proven to be an important diagnostic tool in myeloid malignancies. However, interobserver variability is high compared with that of flow cytometric analysis in the identification of myeloid cell subsets in the BM. Because the BM is a heterogeneous environment, this results in difficulties when determining the proliferative and apoptotic indices using a histological approach. An advantage of this histological approach is the possibility of examining the spatial distribution of the expressed proliferative and apoptotic parameters, which is not possible with flow cytometry. In contrast, quantification by flow cytometry is less prone to subjectivity, because larger quantities of cells can be analyzed than with histological approaches. Therefore, flow cytometric analysis needs to be explored further as a complementary technique to the histopathological analysis of myeloid malignancies. Although flow cytometry is by nature complex and personnel intensive and is often performed in experienced tertiary care hematology centers, it is already routine in the clinical context of myeloid malignancies. Therefore, novel parameters can easily be implemented. Proper care should be taken to minimize intra- and interobserver variability. External quality assessment rounds, as organized by the EuroFlow Consortium88 and UK NEQAS,89 for example, contribute to a reduction in the intra- and interobserver/laboratory variability of flow cytometric assays. Before they can be routinely implemented, such assessment rounds should be organized for the novel proliferation and apoptosis parameters.
Technical developments and standardization in multiparameter flow cytometry, together with increasing knowledge of the CD marker expression profiles of maturating myeloid cells (Figure 6), now allow determination of proliferative and (anti)apoptotic indices at the level of individual stages of differentiation of hematopoietic cells. These studies illustrate the applicability of proliferative and apoptotic parameters in a flow cytometric setting for assessment of the biological behavior of myeloid malignancies. Flow cytometric determination of proliferative and apoptotic parameters can, therefore, prove useful for estimating these biological behaviors in a majority of cells in cell populations and even in maturing cell populations. In active disease, assessment of the majority of the (maturing) cell population provides clinically useful data for initial diagnosis, estimation of prognosis, and initial treatment plans. However, recent results from single-cell analyses showed an astonishing inter- and intraindividual phenotypic heterogeneity in myeloid malignancies at the level of individual cells. The large phenotypic heterogeneity in these malignancies creates challenges for analyses of rare cell populations, such as quiescent stem and progenitor cells and malignant cells in a minimal residual disease (MRD) setting. Although flow cytometry is able to identify rare cell populations, as demonstrated in MRD studies by the EuroFlow Consortium,90 single-cell RNA or protein analyses may be more suitable in this context. These single-cell analyses include, among others, deployment of CyTOF, single-cell RNA sequencing, TARGET sequencing, and proteogenomics.91,92

Overview of the different stem cell compartments and progenitors in the BM. These progenitors can commit to various cell lineages for further differentiation, including erythropoiesis (A), megakaryopoiesis (B), myelopoiesis (C), and monopoiesis (D). The specific differentiation marker panels used for the recognition of individual stages of maturation are indicated. CMP, common myeloid progenitor; GMP, granulocyte/macrophage progenitor; HSC, hematopoietic stem cell; MDP, monocyte/dendritic cell progenitor; MEP, megakaryocyte/erythrocyte progenitor; MPP, multipotent progenitor.
Overview of the different stem cell compartments and progenitors in the BM. These progenitors can commit to various cell lineages for further differentiation, including erythropoiesis (A), megakaryopoiesis (B), myelopoiesis (C), and monopoiesis (D). The specific differentiation marker panels used for the recognition of individual stages of maturation are indicated. CMP, common myeloid progenitor; GMP, granulocyte/macrophage progenitor; HSC, hematopoietic stem cell; MDP, monocyte/dendritic cell progenitor; MEP, megakaryocyte/erythrocyte progenitor; MPP, multipotent progenitor.
In our opinion, detection of biological behavior by flow cytometry and these single-cell analysis techniques should supplement each other to provide a better understanding of the biology of myeloid malignancies. For instance, analyses of the remaining clonal cells in an MRD setting with single-cell analysis techniques, combined with analyses of the resulting biological behavior of cell populations during relapse, could provide additional insights for clinical management of such relapses. Furthermore, combining these analysis methods can also be used to investigate genetic aberrancies at the individual cell level and their implications for the biological behavior of the whole cell population.
The rise of next-generation sequencing has contributed prominently to advances in the understanding of the biology of myeloid malignancies.93,94 These techniques provide more information on the genetic background of cell populations but do not provide insight into their biological behavior. As whole cell populations are subjected to these sequencing methods, assessing interactions between different genetic aberrancies is challenging, and intercellular differences in genetic backgrounds are not assessed. Therefore, additional analyses of biological behavior by flow cytometry can provide the data necessary to link biological behavior with the genetic background of specific cell populations. In a clinical context, detection of the biological behavior of the majority of the malignant cell population by flow cytometry could be the preferred method for clinical management at initial diagnosis.
Recent studies underline the increasing applicability of artificial intelligence in myeloid malignancies. These studies present artificial imaging techniques that allow automated assessment of morphology and molecular diagnostics and automated flow cytometric assessment by FlowSOM.95,96 Markers for biological behavior, such as proliferative and apoptotic parameters, could be interesting candidates for incorporation into such automated approaches.
In conclusion, the studies highlighted in this review recognize the potential value of proliferative and apoptotic indices as diagnostic and prognostic markers for myeloid malignancies, despite some contradictory outcomes. Using state-of-the-art multiparameter flow cytometry that combines the extensive panel of differentiation markers that has recently become available and been shown to recognize the individual stages of maturation in the different hematopoietic lineages with the determination of their proliferative and apoptotic status could have a variety of potential applications in myeloid malignancies, including 1) diagnostic purposes, 2) determination of clinical outcomes, and 3) a better understanding of the underlying biology and pathogenesis of myeloid malignancies. However, consensus and standardization of procedures in flow cytometry are of paramount importance to bring such functional assays into clinical practice. There are sufficient markers and technologies available; the challenge now is to find consensus on standardized procedures and methods that will define how detection of proliferative and apoptotic rates is integrated into clinical practice for myeloid malignancies.
Acknowledgments
The authors thank Norbert C. J. de Wit (Central Diagnostic Laboratory, Maastricht University Medical Centre) for discussions on the clinical aspects and implications of the studies, Ruud Clarijs (Department of Pathology, Zuyderland Medical Centre) for providing the immunohistochemical staining images, and Bert Schutte (Department of Molecular Cell Biology, Maastricht University Medical Centre) for the illustrations of flow cytometric analyses.
S.G.C.M. is a PhD candidate at Maastricht University Medical Centre, and this work is submitted in partial fulfillment of the requirement for the PhD.
Authorship
Contribution: M.P.G.L., F.C.S.R., and A.H.N.H. designed and conceptualized the review procedure; S.G.C.M. wrote the first concept of the article; and all authors reviewed and amended subsequent versions and discussed the clinical aspects and implications of the study.
Conflict-of-interest disclosure: The authors declare no competing financial interests.
Correspondence: Stefan G. C. Mestrum, Department of Molecular Cell Biology Maastricht University Medical Centre, PO Box 616, 6200 MD Maastricht, The Netherlands; e-mail: sgc.mestrum@maastrichtuniversity.nl.

