

Key Points
Atg7 deficiency impairs HSC quiescence through dysregulation of mitochondrial metabolism, resulting in bone marrow failure at adult stage.
Atg7-deficient neonatal HSCs normally show long-term engraftment, which suggests Atg7-independent hematopoiesis.

Abstract
Hematopoietic stem cells (HSCs) undergo self-renewal or differentiation to sustain lifelong hematopoiesis. HSCs are preserved in quiescence with low mitochondrial activity. Recent studies indicate that autophagy contributes to HSC quiescence through suppressing mitochondrial metabolism. However, it remains unclear whether autophagy is involved in the regulation of neonatal HSCs, which proliferate actively. In this study, we clarified the role of autophagy in neonatal HSCs using 2 types of autophagy-related gene 7 (Atg7)-conditional knockout mice: Mx1-Cre inducible system and Vav-Cre system. Atg7-deficient HSCs exhibited excess cell divisions with enhanced mitochondrial metabolism, leading to bone marrow failure at adult stage. However, Atg7 deficiency minimally affected hematopoiesis and metabolic state in HSCs at neonatal stage. In addition, Atg7-deficient neonatal HSCs exhibited long-term reconstructing activity, equivalent to wild-type neonatal HSCs. Taken together, autophagy is dispensable for stem cell function and hematopoietic homeostasis in neonates and provide a novel aspect into the role of autophagy in the HSC regulation.
Introduction
Hematopoietic stem cells (HSCs) self-renew and differentiate to sustain lifelong hematopoiesis.1 HSCs retain cell cycle quiescence within their niche in the bone marrow (BM). Several studies have shown that HSC cell fate depends on metabolic state.2,3 Many groups have focused on how mitochondria, which is the main organelle to generate adenosine triphosphate by oxidative metabolism, function to maintain HSCs. Indeed, quiescent HSCs uniquely show low mitochondrial membrane potential (ΔΨm), and HSCs with high ΔΨm show decreased long-term reconstructing (LTR) activity compared with HSCs with low ΔΨm.4 In addition, our recent study also showed that the initiation of HSC division is accompanied with enhanced ΔΨm.5 Thus, mitochondrial regulation is closely linked to HSC quiescence.
Autophagy is a catabolic pathway characterized by the formation of autophagosomes, which fuse with lysosome for degradation.6,7 Autophagy is essential for cellular homeostasis through the clearance of damaged or dysfunctional organelles or proteins.8 Recently, several groups showed that autophagy was crucial for the maintenance of HSCs.9-11 The selective degradation of mitochondria by autophagy, mitophagy, is also crucial for the maintenance of HSCs.12,13 Inhibition of lipophagy, which is important for lipid droplet degradation and free fatty acids generation, causes the defect in the neutrophil differentiation and B1a B cell require lipophagy to maintain their self-renewal capacity.14,15 Through its E1 ubiquitin ligase-like function, autophagy-related gene 7 (Atg7) initiates autophagy. Indeed, Atg7-deficient mice present BM failure as a result of dysfunctional autophagy.10 In addition, Atg7-deficient HSCs exhibit premature aging phenotypes such as defective quiescence and skewing to myeloid lineage differentiation. Atg7-deficient LSK (Lineage−, Sca1+, c-Kit+) cells lose quiescence through measuring the expression of Ki67.10 In another study, Atg12 deficiency induces cell cycle progression and mitochondria related metabolism.11 In our previous study, initiation of HSCs division is related to intracellular calcium in the cytoplasm and mitochondria; calcium levels corelated with the upregulation of mitochondrial metabolisms.5 These facts indicate that autophagy is important to suppress HSC metabolism that allows the maintenance of HSC quiescent phenotype in steady-state conditions.
Neonatal HSCs differ in both cell cycle and metabolic state from adult HSCs.16 Unlike adult HSCs, neonatal HSCs actively proliferate, present high mitochondrial metabolism, and show low efflux ability. Generally, high proliferative activity is conversely correlated with LTR potential in adult HSCs, but neonatal HSCs show high LTR activity despite being highly proliferative.17 However, it remains unclear whether autophagy, a key regulator for HSC quiescence, is essential for cell cycling neonatal HSCs.
In this study, we analyzed the effect of autophagy on HSCs in neonate and adult mice by conditional deletion of Atg7 using Mx1-Cre inducible system or Vav-Cre system. Our data reveal that autophagy is dispensable for neonatal hematopoiesis HSCs and the significant role of autophagy for the maintenance of HSC quiescence at adult stage.
Materials and methods
Animals
Atg7flox/flox mice18 were crossed with Mx1-Cre+/−19 or Vav-Cre+/−20 mice to obtain Atg7flox/flox; Mx1-Cre+/− (Atg7flox/flox; Mx1-Cre) or Atg7flox/flox; Vav-Cre+/− (Atg7flox/flox; Vav-Cre) mice. To induce Cre-mediated recombination in Atg7flox/flox; Mx1-Cre mice, we intraperitoneally administered poly:IC (=pIpC, 200 mg/kg, nacalai tesque) twice every other day into 4-week-old mice. Atg7flox/flox; Cre−/− (Atg7flox/flox) mice were used as control mice. Eight-week-old C57BL/6-Ly5.2 mice were obtained from Japan SLC, Inc. All animal experiments were performed according to guidelines of Kumamoto University animal use.
Cell preparation
Whole BM cells were obtained by flushing femur and tibia bone with Dulbecco’s modified Eagle medium (Sigma) containing 10% fetal bovine serum (FBS; Biowest). Obtained BM cells were washed with Dulbecco’s phosphate-buffered saline (PBS; Sigma) containing 2% FBS once. In the case of HSC sorting, whole BM cells were stained by microbead-conjugated antibody for c-Kit (Militenyi Biotec), and c-Kit+ cells were roughly separated by autoMACS Pro Separator (Militenyi Biotec) before staining with fluorescence-conjugated antibodies.
Antibodies for flow cytometry
The following monoclonal antibodies were used as surface markers for cell sorting and flow cytometric analysis: anti-c-Kit (2B8), anti-CD150 (TC15-12F12.2), anti-CD48 (HM48-1), anti-EPCR (eBio1560; eBioscience), anti–Sca-1 (E13-161.7), anti-CD45.2 (104), anti-CD45.1 (A20), anti-B220/CD45R (RA3-6B2), anti–Mac-1 (M1/70), anti–Gr-1 (RB6-8C5), anti-CD4 (RM4-5), and anti-CD8 (53-6.72) antibodies. All antibodies were obtained from BioLegend unless otherwise noted. Flow cytometric analysis and cell sorting were performed using FACSCantoII (Becton Dickinson), FACSAriaIII (Becton Dickinson), and Moflo-XDP (Beckman Coulter), respectively. Obtained data were analyzed by using Flowjo software package v. 10. 6. 1 (Tree Star).
EdC uptake assay and cell cycle analysis
5-Ethynyl-2′-deoxycytidine (EdC) (150 mg/kg; Tokyo Chemical Industry Co.) was injected intraperitoneally. After 24 hours, EdC uptake in HSCs was determined by Click-iT Plus EdU Alexa Flour 488 Flow Cytometry Assay kit (Thermo Fisher Scientific), according to the manufacturer’s instructions. Cell cycle status was analyzed with the antibody for anti–Ki-67 (BioLegend) and Hoechst 33342 (Thermo Fisher Scientific), following the permeabilization of cell membrane by using BD Cytofix/Cytoperm Fixation/Permeabilization Kit (Becton Dickinson).
ΔΨm and mitochondrial superoxide
According to the manufacturer’s instructions, ΔΨm and mitochondrial superoxide level were examined with Mitoprobe JC-1 assay kit (Thermo Fisher Scientific) and MitoSOX Red Mitochondrial Superoxide indicator (Thermo Fisher Scientific), respectively. Simply, collected BM cells were stained with 2 μM JC-1 or 5 μM MitoSOX Red for 30 minutes at 37°C before flow cytometric analyses.
Measurement of autophagy activity
Autophagy activity was assessed with CYTO-ID autophagy detection kit 2.0 (Enzo Life Sciences, Inc.) by following the manufacturer’s instructions. Briefly, collected BM cells were treated with or without chloroquine in PBS containing 5% FBS for 30 minutes before staining with CYTO-ID (1:1000 dilution) for 30 minutes at 37°C. Each sample was measured by using FACSCantoII (Becton Dickinson). Autophagy activity was also assessed by anti-LC3 (4E12: MBL)-based analysis. Collected BM cells treated with or without chloroquine in PBS containing 5% FBS in PBS for 30 minutes. After that, cells were fixed by 4% paraformaldehyde for 15 minutes. After fixation, cells were permeabilized by 50 μM digitonin for 5 minutes. Cells were stained with anti-LC3 for 1 hour at room temperature. After 1 hour, cells were stained with Alexa488 2nd antibody (A11029: Thermo Fisher Scientific) for 1 hour at room temperature. Each sample was measured by using FACSCantoII (Becton Dickinson).
Transplantation
As described previously,5 C57BL/6 Ly5.1 recipient mice were lethally irradiated (total 10 Gy). Within 24 hours after irradiation, 1 × 10⁶ whole BM cells (test cells; Ly5.2) were transplanted with 1 × 10⁶ or 1 × 10⁵ whole BM cells (competitor cells; Ly5.1). One, 3, and 5 months after transplantation, the chimerism in peripheral blood (PB) or HSCs was analyzed using flow cytometric analyses.
RNA-seq
As previously described,5 RNA-seq was performed based on previously reported method.21 Briefly, 100 sorted HSCs were used to synthesize the first strand of cDNA with PrimeScript RT reagent kit (TAKARA Bio Inc.) and not so random primers.22 The first strand was treated with Klenow Fragments (3′-5′ exo-; New England Biolabs Inc.) and complement chains of not so random primers to synthesize the second-strand cDNA. After purifying double-strand cDNA, the library for RNA-seq was prepared and amplified using Nextera XT DNA sample prep kit (Illumina Inc.). Prepared libraries were sequenced with Nextseq 500 system (Illumina Inc.), and each obtained read was mapped to the reference sequence of mm10 using CLC genomic workbench v11.0.0 (Qiagen). Expression levels were normalized and subjected to statistical analyses based on edgeR. Transcriptome data were subjected to gene set enrichment analysis (GSEA) using GSEA v4. 0. 3 software.23 Gene sets were obtained from the database of Broad Institute.
Confocal microscopy
Femur bones derived from 8-week-old Atg7flox/flox; Vav-Cre and Atg7flox/flox mice were fixed with 1% paraformaldehyde overnight at 4°C, followed by a cryopreservative incubation in 30% sucrose (in phosphate buffer) for 1 to 2 days. After samples were embedded in O.C.T. Compound (Sakura Finetek), frozen sections of BM were prepared with a cryostat (Leica) and were washed with PBS 3 times every 5 minutes at room temperature to remove excess embedding compound. Following the incubation of these thick (more than 150 μm) sections in staining buffer (PBS containing 10% donkey serum, 0.2% Triton X-100, 1% BSA) overnight at 4°C, samples were stained with Alexa Fluor 647-conjugated TER-119 antibody (BioLegend) and 4′,6-diamidino-2-phenylindole (DAPI; 5 μg/mL, Thermo Fisher Scientific) for 1 day at 4°C in staining buffer. After staining, each thick section was washed with PBS-T (PBS containing 0.2% Triton X-100) 4 times every 15 minutes and then once every hour for 12 hours. Samples were cleared with RAPIClear 1.52 (SunJin Laboratory Co.) for more than 6 hours at 4°C. Transparent bones were imaged with a confocal microscope (Leica). Tiled z-stack images were reconstructed by using the microscopy image analysis software Imaris (Bitplane-Oxford Instruments). The number of TER-119+ and TER-119− cells were counted within 50 × 50-μm z-stack section of 3 locations randomly selected from 2 slices of femur bone.
Results
Atg7 is essential for long-term maintenance of hematopoiesis
It has been previously shown that Atg7flox/flox; Vav-Cre mice present BM failure because of diminished HSC functions.10 Yet, the Atg7 gene is deleted during the embryonic stage in Atg7flox/flox; Vav-Cre mice, which may not accurately reflect the effect of defective autophagy on hematopoiesis in adult mice. We used Atg7flox/flox; Mx1-Cre mice to focus on the effect of autophagy during adult hematopoiesis. Atg7 deletion with pIpC injection in 4-week-old mice led to decreased total BM cell number at 8 weeks old (Figure 1A). In addition, Atg7flox/flox; Mx1-Cre mice showed increased frequency of LSK (Lineage−, Sca1+, c-kit+) cells within BM (Figure 1B), enhanced frequency of myeloid lineage cells in PB (Figure 1C), and mild splenomegaly (Figure 1D), which are features of stress hematopoiesis under inflammation conditions. Moreover, Atg7flox/flox; Mx1-Cre HSCs also exhibited enhanced ΔΨm (Figure 1E) and reactive oxygen species generation (Figure 1F), which are hallmarks of actively dividing HSCs.5 These data suggest that the lack of autophagy at adult stage impairs HSC quiescence through the induction of stress-like hematopoiesis, similarly to Vav-Cre system.10 Next, to examine the impact of Atg7 deficiency on stem cell functions at adult stage, we performed a serial transplantation assay (Figure 1G). Although little difference in the chimerism of PB was detected between Atg7flox/flox and Atg7flox/flox; Mx1-Cre BM cells 1 or 3 months after transplantation (Figure 1H), Atg7flox/flox; Mx1-Cre BM cells showed decreased chimerism at 5 months after transplantation (Figure 1H) and after secondary transplantation (Figure 1I). As previously described,11 our data also confirmed that autophagy is essential for the maintenance of LTR activity in HSCs. On the one hand, Atg7 deficiency at adult stage hardly affected the chimerism of donor-derived cells by 3 months after transplantation (Figure 1H), unlike Vav-Cre system.10 Therefore, autophagy seems to be essential for the maintenance of HSC quiescence but may be dispensable for preserving stemness during rapid HSC divisions.
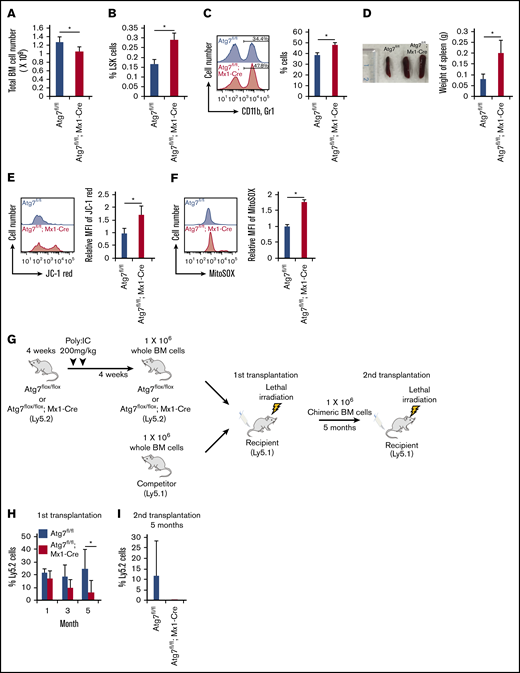
Effect of autophagy deficiency on long-term hematopoiesis. (A-B) After the administration of poly:IC, the number of total BM cell (A) and frequency of LSK (Lineage−, Sca1+, c-Kit+) cells (B) were analyzed. Data are presented as means ± standard deviation (SD; n = 3 in each condition, 2 independent experiments; *P < .05 by Student t test). (C) Frequency of myeloid cells (CD11b+ and Gr1+) were examined in PBMCs derived from Atg7fl/fl (fl = flox) or Atg7fl/fl; Mx1-Cre mice. Histograms represent the fluorescent intensity of CD11b and Gr1 antibody, and the graph shows frequency of CD11b+ and Gr1+ cells. Data are presented as means ± SD (n = 3 in each condition, 2 independent experiments; *P < .05 by Student t test). (D) Photograph of spleen and weigh of spleen were measured in Atg7fl/fl or Atg7fl/fl; Mx1-Cre mice. Graph shows weight of spleen. Data are presented as means ± SD (n = 3 in each condition, 2 independent experiments; *P < .05 by Student t test). (E-F) ΔΨm (E) and mitochondrial superoxide level (F) were examined in HSCs derived from Atg7fl/fl or Atg7fl/fl; Mx1-Cre HSCs. Histograms represent the fluorescent intensity of indicated dyes, and graphs show relative values against Atg7fl/fl-derived HSCs. Data are presented as means ± SD (n = 3 in each condition, 2 independent experiments; *P < .05 by Student t test). (G-I) After the administration of poly:IC, Atg7fl/fl; Mx1-Cre HSCs (Ly5.2) were transplanted into lethally irradiated recipient mice (Ly5.1) along with wild-type whole BM cells (Ly5.1) (G). (H) After 4, 12, and 20 weeks from primary transplantation, peripheral blood (PB) of each recipient was analyzed. (I) Moreover, PB was analyzed at 20 weeks after chimeric whole BM cells derived from recipient mice were serially transplanted. Graphs show the chimerism of PB in each recipient. Data are presented as means ± SD (n = 9, 2 independent experiments; *P < .05 by Student t test). Black and white bars represent Atg7fl/fl (used as a control) and Atg7fl/fl; Mx1-Cre-derived cells, respectively.
Effect of autophagy deficiency on long-term hematopoiesis. (A-B) After the administration of poly:IC, the number of total BM cell (A) and frequency of LSK (Lineage−, Sca1+, c-Kit+) cells (B) were analyzed. Data are presented as means ± standard deviation (SD; n = 3 in each condition, 2 independent experiments; *P < .05 by Student t test). (C) Frequency of myeloid cells (CD11b+ and Gr1+) were examined in PBMCs derived from Atg7fl/fl (fl = flox) or Atg7fl/fl; Mx1-Cre mice. Histograms represent the fluorescent intensity of CD11b and Gr1 antibody, and the graph shows frequency of CD11b+ and Gr1+ cells. Data are presented as means ± SD (n = 3 in each condition, 2 independent experiments; *P < .05 by Student t test). (D) Photograph of spleen and weigh of spleen were measured in Atg7fl/fl or Atg7fl/fl; Mx1-Cre mice. Graph shows weight of spleen. Data are presented as means ± SD (n = 3 in each condition, 2 independent experiments; *P < .05 by Student t test). (E-F) ΔΨm (E) and mitochondrial superoxide level (F) were examined in HSCs derived from Atg7fl/fl or Atg7fl/fl; Mx1-Cre HSCs. Histograms represent the fluorescent intensity of indicated dyes, and graphs show relative values against Atg7fl/fl-derived HSCs. Data are presented as means ± SD (n = 3 in each condition, 2 independent experiments; *P < .05 by Student t test). (G-I) After the administration of poly:IC, Atg7fl/fl; Mx1-Cre HSCs (Ly5.2) were transplanted into lethally irradiated recipient mice (Ly5.1) along with wild-type whole BM cells (Ly5.1) (G). (H) After 4, 12, and 20 weeks from primary transplantation, peripheral blood (PB) of each recipient was analyzed. (I) Moreover, PB was analyzed at 20 weeks after chimeric whole BM cells derived from recipient mice were serially transplanted. Graphs show the chimerism of PB in each recipient. Data are presented as means ± SD (n = 9, 2 independent experiments; *P < .05 by Student t test). Black and white bars represent Atg7fl/fl (used as a control) and Atg7fl/fl; Mx1-Cre-derived cells, respectively.
Atg7-deficient neonatal HSCs have a normal potential as stem cells
Next, to examines whether the contribution of autophagy to HSC maintenance is dependent on cell division status, we focused on P5 neonatal stage, because P5 neonatal HSCs showed enhanced EdC uptake (Figure 2A) and high ΔΨm (Figure 2B) compared with adult HSCs derived from 8-week-old mice. However, there was no difference in the mitochondrial mass of HSCs between neonatal and adult stage (supplemental Figure 1). To assess the effect of Atg7 deficiency on rapidly dividing neonatal HSCs, we used Atg7flox/flox; Vav-Cre mice, in which the Atg7 allele is deleted specifically in hematopoietic lineages at embryonic stage. The change in number of whole BM cells, HSCs, LEK (Lineage−, EPCR+, c-Kit+) cells and white blood cell number in PB was insignificant between Atg7flox/flox and Atg7flox/flox; Vav-Cre mice at neonatal stage (Figure 2C-F). However, 4- or 8-week-old Atg7-deficient mice exhibited significantly decreased number of whole BM cells, HSCs, LEK cells, and white blood cells in PB (Figure 2C-F). Indeed, HSCs seem to acquire quiescence from 4 weeks as Atg7flox/flox HSCs showed decreased EdC uptake (Figure 2A) and ΔΨm (Figure 2B) at 4 and 8 weeks. However, Atg7flox/flox; Vav-Cre HSCs from 4- or 8-week-old mice had significantly higher levels of EdC uptake (Figure 2A) and ΔΨm (Figure 2B) compared with control HSCs. Moreover, G0 cells were significantly decreased in Atg7flox/flox; Vav-Cre HSCs at 8 weeks (Figure 2G). These data indicate that Atg7-deficient HSCs fail to gain or maintain a quiescent state during transition from neonatal to adult stages, which support that autophagy is an indispensable process for HSC quiescence. On the one hand, Atg7 deficiency hardly affected the status of HSCs or hematopoiesis at neonatal stage, indicating that autophagy minimally contributes to actively dividing neonatal HSCs at the neonatal stage.

Autophagy deficiency exerted differential effects on hematopoiesis between adult and neonatal mice. (A) Cell division activity were determined by EdC uptake. Histograms represent EdC+ cells, and graphs show the frequency of EdC+ cells. Data are presented as means ± SD (n = 3 in each condition, 2 independent experiments; *P < .05 by Student t test). (B) To examine mitochondrial status, ΔΨm was also assessed. Histograms represent the fluorescent intensity of indicated dyes, and graphs show relative values against Atg7fl/fl-derived HSCs. Data are presented as means ± SD (n = 3 in each condition, 2 independent experiments; *P < .05 by Student t test). (C-F) Total number of BM cells (P5 = whole body, 4 and 8 weeks = both tibias and femurs) (C), the frequency of HSCs (D), the frequency of LEK cells (Lineage−, EPCR+, and c-Kit+) (E), and the number of white blood cells (F) in Atg7fl/fl and Atg7fl/fl; Vav-Cre mice were examined at P5, 4 weeks, and 8 weeks old. Data are presented as means ± SD (n = 3 in each condition, 2 independent experiments; *P < .05 by Student t test). (G) Cell cycle status was also determined by the combination between Hoechst 33342 and Ki67. Graphs show the cells with indicated cell cycle phase. Data are presented as means ± SD (n = 3 in each condition, 2 independent experiments; *P < .05 by Student t test).
Autophagy deficiency exerted differential effects on hematopoiesis between adult and neonatal mice. (A) Cell division activity were determined by EdC uptake. Histograms represent EdC+ cells, and graphs show the frequency of EdC+ cells. Data are presented as means ± SD (n = 3 in each condition, 2 independent experiments; *P < .05 by Student t test). (B) To examine mitochondrial status, ΔΨm was also assessed. Histograms represent the fluorescent intensity of indicated dyes, and graphs show relative values against Atg7fl/fl-derived HSCs. Data are presented as means ± SD (n = 3 in each condition, 2 independent experiments; *P < .05 by Student t test). (C-F) Total number of BM cells (P5 = whole body, 4 and 8 weeks = both tibias and femurs) (C), the frequency of HSCs (D), the frequency of LEK cells (Lineage−, EPCR+, and c-Kit+) (E), and the number of white blood cells (F) in Atg7fl/fl and Atg7fl/fl; Vav-Cre mice were examined at P5, 4 weeks, and 8 weeks old. Data are presented as means ± SD (n = 3 in each condition, 2 independent experiments; *P < .05 by Student t test). (G) Cell cycle status was also determined by the combination between Hoechst 33342 and Ki67. Graphs show the cells with indicated cell cycle phase. Data are presented as means ± SD (n = 3 in each condition, 2 independent experiments; *P < .05 by Student t test).
Next, to compare the activity of autophagy between neonatal and adult HSCs, we examined the gene expression pattern of autophagy-related genes by using RNA sequencing. Although some autophagy-related genes such as Praa2, Vmp1, Optn, Htra2, Rab39b, Vps13d, and Mfn2 were significantly upregulated in 4-week-old HSCs compared with P5 neonatal HSCs (Figure 3A), GSEA did not show significant enrichment of autophagy-related gene sets in either neonatal or 4-week-old HSCs (Figure 3B). The expression of important genes for Atg5/7 independent autophagy, Ulk1 and Becn1, were not different between neonatal and 4-week-old HSCs (supplemental Figure 2). In addition, neonatal HSCs exhibited enhanced number of CYTO-ID2–staining autophagosomes compared with adult HSCs in the absence or presence of chloroquine-mediated inhibition of phagosome degradation (Figure 3C). However, autophagy flux, an index for autophagy activity that is estimated based on the comparison between LC3 accumulation with and without chloroquine treatment,24 revealed that there is no difference between neonatal and adult HSCs (Figure 3D). Although adult HSCs exhibited equivalent autophagy activity to neonatal HSCs, autophagy deficiency hardly affected hematopoiesis at the neonatal stage (Figure 2). Thus, autophagy is not involved in the regulation of actively dividing neonatal HSCs.
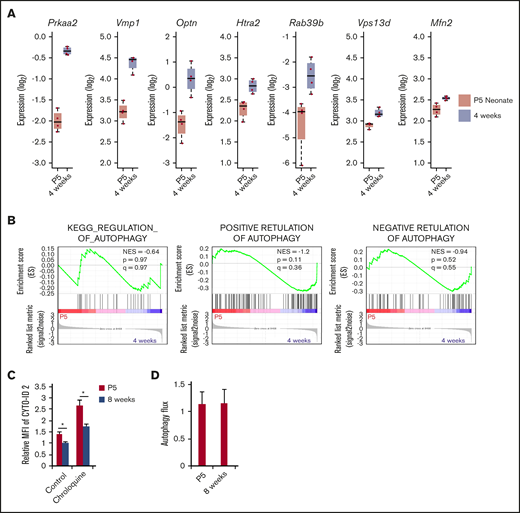
Expression of autophagy-related genes in HSCs derived from P5 and 4-week-old mice. (A) Expression level of autophagy-related genes was compared between P5 neonatal and 4-week-old mice HSCs by RNA-seq. Graphs show expression value estimated based on RPKM (n = 4 in each condition; *P < .05 by Student t test). (B) Enrichment of gene sets KEGG_REGULATION_OF_AUTOPHAGY, POSITIVE RETULATION OF AUTOPHAGY, and NEGATIVE RETULATION OF AUTOPHAGY within differentially regulated genes in P5 neonatal and 4-week-old mice HSCs. (C) Autophagy activity in P5 neonatal and 8-week-old adult HSCs was assessed by CYTO-ID staining. Graph shows fluorescent intensity relative to the value of P5 HSCs pretreated without chloroquine. Data are presented as means ± SD (n = 3 in each condition, 2 independent experiment; *P < .05 by Student t test). (D) Atg7fl/fl and Atg7fl/fl; Vav-Cre HSCs were fixed and stained with LC3 antibody. Autophagy flux was calculated from the geometric fluorescence intensity (GeoMFI) of LC3 in the absence or presence of chloroquine24 (The value of GeoMFI in the presence of chloroquine was divided by the value of vehicle). Data are presented as means ± SD (n = 3 in each condition, 2 independent experiments; *P < .05 by Student t test).
Expression of autophagy-related genes in HSCs derived from P5 and 4-week-old mice. (A) Expression level of autophagy-related genes was compared between P5 neonatal and 4-week-old mice HSCs by RNA-seq. Graphs show expression value estimated based on RPKM (n = 4 in each condition; *P < .05 by Student t test). (B) Enrichment of gene sets KEGG_REGULATION_OF_AUTOPHAGY, POSITIVE RETULATION OF AUTOPHAGY, and NEGATIVE RETULATION OF AUTOPHAGY within differentially regulated genes in P5 neonatal and 4-week-old mice HSCs. (C) Autophagy activity in P5 neonatal and 8-week-old adult HSCs was assessed by CYTO-ID staining. Graph shows fluorescent intensity relative to the value of P5 HSCs pretreated without chloroquine. Data are presented as means ± SD (n = 3 in each condition, 2 independent experiment; *P < .05 by Student t test). (D) Atg7fl/fl and Atg7fl/fl; Vav-Cre HSCs were fixed and stained with LC3 antibody. Autophagy flux was calculated from the geometric fluorescence intensity (GeoMFI) of LC3 in the absence or presence of chloroquine24 (The value of GeoMFI in the presence of chloroquine was divided by the value of vehicle). Data are presented as means ± SD (n = 3 in each condition, 2 independent experiments; *P < .05 by Student t test).
Atg7 deficiency minimally affects neonatal hematopoiesis in cell metabolism
Although Atg7 deficiency impairs hematopoiesis and adult HSC function at adult stage,10 it did not affect neonatal hematopoiesis (Figure 2). To test whether neonatal Atg7-deficient HSCs exhibit normal stem cell functions, we examined the reconstitution ability of neonatal Atg7-deficient HSCs by competitive transplantation. Surprisingly, when Atg7flox/flox; Vav-Cre BM cells were transplanted along with competitor cells into irradiated recipients (Figure 4A), these Atg7-deficient BM cells showed similar chimerism in PB at 1 or 3 months after transplantation compared with Atg7flox/flox BM cells (Figure 4B). In addition, the chimerism in HSCs within BM was also equivalent (Figure 4C). Moreover, Atg7-deficient mice usually showed increment of Gr1-positive neutrophil in PB,14 but this competitive transplantation assay did not show Atg7 deficiency–mediated skewing into any lineages at 3 months after transplantation (Figure 4D). Thus, neonatal Atg7flox/flox; Vav-Cre HSCs had normal potential as stem cells to reconstruct and maintain hematopoiesis after the transplantation. However, 4- or 8-week-old Atg7flox/flox; Vav-Cre mice showed failure of hematopoiesis (Figure 2C) and decreased HSC number (Figure 2D). Because Vav-Cre–mediated deletion is specific for hematopoietic linage, we speculated that normal hematopoiesis governed by competitor cells (Ly5.1 mouse BM cells) rescues HSCs from the negative effect of Atg7 deficiency in recipient mice. To examine this, we decreased the ratio of competitor cells (donor:competitor = 10:1) in a competitive transplantation assay (Figure 4A). Interestingly, decreased numbers of competitor cells drastically failed the engraftment of Atg7flox/flox; Vav-Cre BM cells (Figure 4E). In addition, most of recipient mice transplanted with Atg7flox/flox; Vav-Cre BM cells could not survive (4 of the 5 mice were dead), even when sufficient number of competitor cells (1 × 10⁵ cells) were simultaneously transplanted (Figure 4E). These results suggest that Atg7-deficient hematopoiesis has a negative feedback effect on HSCs, which is cancelled by the existence of normal hematopoiesis. Thus, Atg7 was dispensable for the maintenance of HSCs at the neonatal stage, but Atg7 deficiency failed the reconstruction of hematopoiesis in irradiated recipients through indirect effects on HSCs.

Autophagy-deficient HSCs showed a normal potential for long-term engraftment. Experimental scheme of transplantation assay (A). After P5 neonatal Atg7fl/fl; Vav-Cre BM cells (1 × 10⁶ cells) were transplanted with competitor cells (1 × 10⁶ cells) into recipient mice, and the chimerism of PB (B) or HSCs within BM (C) were analyzed at indicated points or at 3 months after the transplantation, respectively. (D) In addition, the composition from each 3-differentiated lineage in PB was also examined at 3 months after the transplantation. CD4 and CD8: T-cell lineage; Gr1 and CD11b: myeloid lineage, B220: B-cell lineage. Graphs show the frequency of indicated cell populations. Data are presented as means ± SD (n = 7 in each condition, 2 independent experiments; *P < .05 by Student t test). To reduce the effect of normal hematopoiesis, P5 neonatal Atg7fl/fl; Vav-Cre BM cells (1 × 10⁶ cells) were transplanted with decreased competitor cells (1 × 10⁵ cells) into recipient mice, and PB cells were analyzed at 4 and 12 weeks after the transplantation. Graphs show the frequency of indicated cell populations (n = 5 in each condition, 2 independent experiment; *P < .05 by Student t test).
Autophagy-deficient HSCs showed a normal potential for long-term engraftment. Experimental scheme of transplantation assay (A). After P5 neonatal Atg7fl/fl; Vav-Cre BM cells (1 × 10⁶ cells) were transplanted with competitor cells (1 × 10⁶ cells) into recipient mice, and the chimerism of PB (B) or HSCs within BM (C) were analyzed at indicated points or at 3 months after the transplantation, respectively. (D) In addition, the composition from each 3-differentiated lineage in PB was also examined at 3 months after the transplantation. CD4 and CD8: T-cell lineage; Gr1 and CD11b: myeloid lineage, B220: B-cell lineage. Graphs show the frequency of indicated cell populations. Data are presented as means ± SD (n = 7 in each condition, 2 independent experiments; *P < .05 by Student t test). To reduce the effect of normal hematopoiesis, P5 neonatal Atg7fl/fl; Vav-Cre BM cells (1 × 10⁶ cells) were transplanted with decreased competitor cells (1 × 10⁵ cells) into recipient mice, and PB cells were analyzed at 4 and 12 weeks after the transplantation. Graphs show the frequency of indicated cell populations (n = 5 in each condition, 2 independent experiment; *P < .05 by Student t test).
Atg7 deficiency promotes cell cycling in HSCs through the defective erythropoiesis
Finally, to examine the mechanism of how Atg7-deficient hematopoiesis negatively affects HSCs, we focused on Atg7-deficient erythropoiesis because Atg7flox/flox; Vav-Cre mice were near death at around 12 weeks of age because of severe anemia (Figure 5A).10 Indeed, Atg5/7 expression is significantly higher in proerythroblasts, and Atg7 deficiency leads to defective early erythropoiesis.25 Moreover, the expression of Atg5/7 correlates with mitochondrial mass, which suggests that Atg7-dependent mitophagy is involved in the maturation of erythrocytes during early erythropoiesis.25 Therefore, we confirmed that Atg7 deficiency significantly increased frequency of CD71 single positive cells within BM (Figure 5B). In addition, Atg7 deficiency led to a significantly increased number of TER-119+DAPI+ cells and decreased number of TER-119+DAPI− non-nuclear cells (Figure 5C). These results indicate that Atg7 deficiency attenuates the differentiation and enucleation in erythropoiesis, which may be involved in severe anemia at adult stages in Atg7flox/flox; Vav-Cre mice. Although the phenotypes of BM failure was observed at 4 weeks old, we suggest that Atg7 deficiency contributed to excess cell cycling in HSCs at the adult stage in response to the severe anemia, resulting in HSC exhaustion followed by further BM failure. To examine this possibility, we used phenylhydrazine (PHZ = 40 mg/kg) to induce severe anemia via hemolysis.26 After 7 days from PHZ injection, HSC division was promoted, as evidenced by enhanced EdC uptake (Figure 5D). These results indicate that the anemic state induces HSC divisions and suggest that the anemia in Atg7-deficient mice may cause BM failure at adult stage through excess HSC divisions.
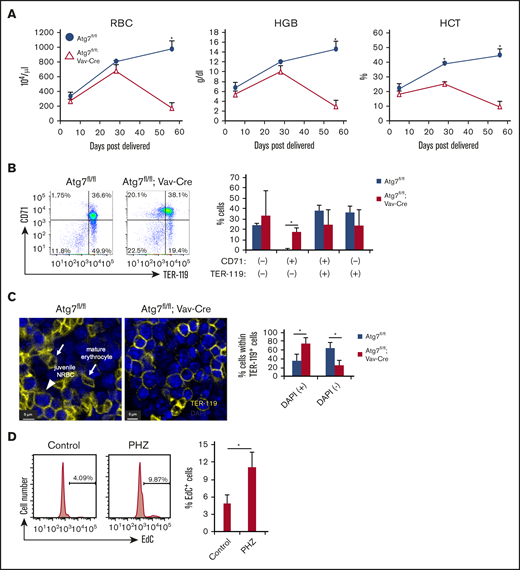
Autophagy deficiency inhibited erythroid differentiation. (A) Erythrocyte-related parameters in PB of 8-week-old Atg7fl/fl and Atg7fl/fl; Vav-Cre mouse PBMCs. Graphs show erythrocyte number (top left), hematocrit (bottom left), and hemoglobin (top right). Data are presented as means ± SD (n = 3 in each condition, 2 independent experiments; *P < .05 by Student t test). (B) Expression pattern of TER-119 and CD71 within BM cells of 8-week-old Atg7fl/fl or Atg7fl/fl; Vav-Cre mice was examined. Dot plot and graph show the frequency of each fraction. Data are presented as means ± SD (n = 3 in each condition, 2 independent experiments; *P < .05 by Student t test). (C) The number of nucleated (+) or enucleated (−) TER-119+ cells in bone sections of Atg7fl/fl and 8-week-old Atg7fl/fl; Vav-Cre mice was counted based on DAPI staining under a confocal laser microscope. Arrows or an arrowhead point to mature erythrocytes or juvenile nucleated red blood cell (NRBC) in these representative images, respectively. Graph shows the frequency of nucleated or enucleated cells within TER-119+ fraction. Data are presented as means ± SD (n = 3 in each condition, 2 independent experiments; *P < .05 by Student t test). (D) PHZ was injected intraperintoneally into 8-week-old WT mice. After 7 days, EdC uptake assay was performed. Histogram and graph show the frequency of EdC+ cells. Data are presented as means ± SD (n = 3 in each condition, 2 independent experiments; *P < .05 by Student t test).
Autophagy deficiency inhibited erythroid differentiation. (A) Erythrocyte-related parameters in PB of 8-week-old Atg7fl/fl and Atg7fl/fl; Vav-Cre mouse PBMCs. Graphs show erythrocyte number (top left), hematocrit (bottom left), and hemoglobin (top right). Data are presented as means ± SD (n = 3 in each condition, 2 independent experiments; *P < .05 by Student t test). (B) Expression pattern of TER-119 and CD71 within BM cells of 8-week-old Atg7fl/fl or Atg7fl/fl; Vav-Cre mice was examined. Dot plot and graph show the frequency of each fraction. Data are presented as means ± SD (n = 3 in each condition, 2 independent experiments; *P < .05 by Student t test). (C) The number of nucleated (+) or enucleated (−) TER-119+ cells in bone sections of Atg7fl/fl and 8-week-old Atg7fl/fl; Vav-Cre mice was counted based on DAPI staining under a confocal laser microscope. Arrows or an arrowhead point to mature erythrocytes or juvenile nucleated red blood cell (NRBC) in these representative images, respectively. Graph shows the frequency of nucleated or enucleated cells within TER-119+ fraction. Data are presented as means ± SD (n = 3 in each condition, 2 independent experiments; *P < .05 by Student t test). (D) PHZ was injected intraperintoneally into 8-week-old WT mice. After 7 days, EdC uptake assay was performed. Histogram and graph show the frequency of EdC+ cells. Data are presented as means ± SD (n = 3 in each condition, 2 independent experiments; *P < .05 by Student t test).
Discussion
Autophagy is recognized as an important process for the regulation or maintenance of quiescent HSCs at the adult stage9-11 through mitophagy12 and metabolic regulation.11 However, in this study, we, for the first time, found that autophagy contributes little to the maintenance of stemness in neonatal HSCs. Importantly, neonatal HSCs originally showed higher ΔΨm and proliferative capacity, unlike adult quiescent HSCs (Figure 2A-B,E). Because autophagy contributes to the maintenance of quiescence and low mitochondrial metabolism in adult HSCs,11 this process may be not involved in the maintenance of HSCs during rapid cell divisions. Because autophagy is activated in response to starvation conditions, the negative effect of autophagy deficiency may disappear under nutrition-rich situation. Indeed, actively dividing HSCs show an increase in glucose uptake compared with quiescent HSCs.5 Therefore, autophagy contributes to HSC regulation, which may be dependent on the status of nutrition in HSCs.
Importantly, neonatal HSCs show higher autophagy activity compared with adult HSCs (Figure 3C), which means that the autophagy process more actively functions in neonatal HSCs. However, Atg7 deficiency hardly affects stem cell function in neonatal HSCs (Figure 4B). As described previously, autophagy is especially critical for maintaining quiescence in adult HSCs. Therefore, we suggest that neonatal HSCs do not need autophagy-mediated quiescence to maintain stemness, because neonatal HSCs are instead cycling. On the one hand, the possibility that an unknown system compensates for the effect of Atg7 deficiency in neonatal HSCs cannot be excluded. Indeed, ULK1-dependent autophagy is independent of Atg5/7,27 which may compensate the effect of Atg7 deficiency on neonatal HSCs. In addition, ULK1 deficiency leads to mitochondria digestion failure in reticulocytes at embryonic stage, but Atg5 deficiency hardly affects it.28 Therefore, neonatal HSCs may originally rely on Atg7-independent autophagy rather than Atg7-dependent system. In addition, we found that some autophagy-related genes (Prkaa2, Vmp1, Optn, Htra2, Rab39b, Vps13d, and Mfn2_2) were differentially expressed between 4-week-old and P5 neonatal HSCs. These differences may influence the effect of Atg7 deficiency on HSCs.
Thus far, previous studies have shown the cell autonomous effect of autophagy deficiency on HSCs.10,11 However, we found that autophagy deficiency non–cell autonomously exerts the negative effect on HSCs. Although Atg7flox/flox; Vav-Cre neonatal HSCs have the normal potential as stem cells in a competitive transplantation assay (Figure 4B), Atg7flox/flox; Vav-Cre mice show not only BM failure but also HSC exhaustion at the adult stage, accompanied with the activation of HSC divisions (Figure 2A-C). This means that HSC exhaustion in adult Atg7flox/flox; Vav-Cre mice is attributed to the negative feedback from Atg7-deficient hematopoiesis rather than the direct effect on HSCs. Because Atg7flox/flox; Vav-Cre mice show normal hematopoiesis by neonatal stage, this negative feedback may initiate at BM rather than fetal liver. Indeed, Atg7-deficient hematopoiesis seems to impair normal hematopoiesis governed by functionally wild-type HSCs, becausee most of recipients transplanted with Atg7flox/flox; Vav-Cre BM cells could not survive even simultaneous input of enough Ly5.1 competitor cells (Figure 4E). Therefore, Atg7-deficient hematopoiesis may negatively affect the stem cell niche within BM. Thus, our data imply significant and non–cell-autonomous effects of autophagy on quiescent maintenance.
Although Atg7flox/flox; Vav-Cre mice died before 12 weeks old because of severe anemia,10 Mx1-Cre–induced Atg7-deficient mice could survive for at least 12 weeks of age. In addition, the Vav-Cre system significantly induced severe BM failure compared with the Mx1-Cre system (Figure 2C). This indicates that the Vav-Cre system induced severe anemia or BM failure compared with the Mx1-Cre system. In these conditional knockout mice, the Vav-Cre system deletes targeted alleles at the embryonic stage, whereas the Mx1-Cre system is dependent on the administration of plpC (mainly at 4 weeks old in this study).20,29 Importantly, even if Atg7 deficiency was induced by the Mx1-Cre system at the P5 neonatal stage, this inducible Atg7 deficiency could not reproduce the Vav-Cre–induced phenotype (date not shown). This implies that Atg7 deficiency at an earlier stage than P5 might contributed to the severe phenomena observed at the adult stage of Atg7flox/flox; Vav-Cre mice. Indeed, germline Atg7-deficient mice die within 1 day after birth because of an insufficient supply of amino acids.18 Therefore, the impact of Atg7 deficiency immediately after birth may be also involved in more drastic phenotypes in Atg7flox/flox; Vav-Cre mice at the adult stage.
In addition, Atg7 deficiency (Atg7flox/flox; Vav-Cre) induced severe BM failure (Figure 2C-D) at 4 weeks old but did not affect red blood cell parameters (Figure 5A). These data suggest that anemia may be not a main cause for BM failure and HSCs exhaustion at 4 weeks in Atg7flox/flox; Vav-Cre mice. Because Vav-Cre–induced Atg7 deficiency indirectly disturbed HSC functions (Figure 4B,E), this negative phenotype may be mediated by negatively affecting hematopoietic lineage niche cells for HSC maintenance. The disruption of autophagy exerts the negative effect on not only HSCs but also differentiated cells such as macrophages, megakaryocytes, T cells, B cells, and erythroid cells.30-32 Especially, macrophages or megakaryocytes reportedly support HSC regulation as niche cells.30,31 In addition to these effects, severe anemia may induce HSC activation at 8 weeks old in Atg7-deficient mice, resulting in further BM failure.
Taken together, we show a novel finding regarding the differential dependency on autophagy between neonatal and adult HSCs. Previous reports show the role of autophagy in adult quiescent HSCs. In this study, we propose that autophagy is dispensable for the maintenance of actively dividing HSCs. In addition, our findings suggest a significant and non–cell-autonomous effect of autophagy on quiescent maintenance in adult HSCs. Thus, our data indicate that the contribution of autophagy into the maintenance of stemness is quite different between adult quiescent and neonatal active HSCs. Therefore, our findings provide a novel aspect into the role of autophagy in HSC maintenance and shed light to the research for the regulation of neonatal active HSCs.
Data are available at the NCBI Gene Expression Omnibus under accession number GSE166911.
Acknowledgments
The authors thank Ryoko Koitabashi, Miho Kataoka, and Yu Matsuzaki at the International Research Center for Medical Sciences (IRCMS), Kumamoto University, for technical assistance in A-Seq experiments (Koitabashi) in several studies (Kataoka and Matsuzaki).
M.H. is supported by the Japan Society for the Promotion of Science (JSPS) Grant-in-Aid for Young Scientists (17K16191), JSPS Research Fellow for Young Scientists (19J00952), and the Uehara Memorial Foundation postdoctoral fellow. T.U. is supported by the JSPS Grant-in-Aid for Scientific Research (19H03688) and Grant-in-Aid for Challenging Exploratory Research (19K22641). T.S. is supported by the Singapore Ministry of Health’s National Medical Research Council under NMRC/MOH-STaR18May (MOH-000149) and JSPS Grant-in-Aid for Scientific Research (26221309).
Authorship
Contribution: M.H., T.U., and T.S. designed the study and wrote the manuscript; M.H. performed most of the experiments; T.Y., A.N.-I., and H.T. discussed and made suggestions for this study; M.S. performed bone marrow staining for confocal microscopy analysis and Ki67 staining; and T.M. helped with the RNAseq analysis.
Conflict-of-interest disclosure: The authors declare no competing financial interests.
Correspondence: Toshio Suda, International Research Center for Medical Sciences, Kumamoto University, 2-2-1 Honjo, Chuo-ku, Kumamoto City 860-0811, Japan; e-mail: sudato@keio.jp.

