

Key Points
Low mitochondrial activity is used to isolate the most biologically potent human HSCs within a population.
Human HSCs with lowest mitochondrial activity exhibit greatest maintenance of stem cell potential ex vivo.

Abstract
Hematopoietic cell transplantation is a critical curative approach for many blood disorders. However, obtaining grafts with sufficient numbers of hematopoietic stem cells (HSCs) that maintain long-term engraftment remains challenging; this is due partly to metabolic modulations that restrict the potency of HSCs outside of their native environment. To address this, we focused on mitochondria. We found that human HSCs are heterogeneous in their mitochondrial activity as measured by mitochondrial membrane potential (MMP) even within the highly purified CD34+CD38−CD45RA−CD90+CD49f+ HSC population. We further found that the most potent HSCs exhibit the lowest mitochondrial activity in the population. We showed that the frequency of long-term culture initiating cells in MMP-low is significantly greater than in MMP-high CD34+CD38−CD45RA−CD90+ (CD90+) HSCs. Notably, these 2 populations were distinct in their long-term repopulating capacity when transplanted into immunodeficient mice. The level of chimerism 7 months posttransplantation was >50-fold higher in the blood of MMP-low relative to MMP-high CD90+ HSC recipients. Although more than 90% of both HSC subsets were in G0, MMP-low CD90+ HSCs exhibited delayed cell-cycle priming profile relative to MMP-high HSCs. These functional differences were associated with distinct mitochondrial morphology; MMP-low in contrast to MMP-high HSCs contained fragmented mitochondria. Our findings suggest that the lowest MMP level selects for the most potent, likely dormant, stem cells within the highly purified HSC population. These results identify a new approach for isolating highly potent human HSCs for further clinical applications. They also implicate mitochondria in the intrinsic regulation of human HSC quiescence and potency.
Introduction
Hematopoietic stem cells (HSCs) produce all blood lineages and replenish blood in response to loss or injury throughout life. Allogeneic HSC transplantation is curative in many blood disorders, as well as in some solid tumors and autoimmune disorders,1-6 yet long-term survival is limited because of a lack of sufficient genetically matched HSC donors.7 Umbilical cord blood (CB) offers an alternative source with several advantages, including immune tolerance for mismatched genetic background.8 However low progenitor and stem cell yield in 1 unit of CB has been a major drawback to the wide use of CB in HSC transplantations. Major efforts have been dedicated to expand the progenitor and stem cell pool in CB. This approach has been challenged by loss of stem cell activity during ex vivo culture.9 Modifications of HSC metabolism, partly through modulations of mitochondrial activity in culture, profoundly affects HSC quiescence and potency10,11 and is a major source of loss of HSC activity ex vivo.
Mitochondria are the main source of cellular energy and adenosine triphosphate production implicated in biosynthesis of macromolecules and generation of metabolites that promote cell survival, proliferation, differentiation, maintenance of the epigenome, and overall homeostasis.12,13 The substrates produced in the tricarboxylic acid cycle are fed into the electron transport chain to maintain mitochondrial membrane potential (MMP). Mitochondria influence cellular signaling by among others buffering calcium and regulating reactive oxygen species production.10 As part of their quality control, mitochondria undergo dynamic changes in their morphology and network composition14-16 ; mitochondrial fission (or fragmentation) may precede lysosomal retention and/or elimination of mitochondria, whereas mitochondrial fusion is mostly associated with cell division.17 Modulations of mitochondrial dynamics are interconnected with mitochondrial metabolism, and signaling17 and found to be associated with circumstances in which HSC quiescence, adaptation with transition to activation, and proliferation and differentiation are modified18-29 and (reviewed in Filippi and Ghaffari30 and Snoeck31 ). Mitochondrial involvement in regulating HSC function is further supported by recent murine evidence including from our own laboratory showing that similar to hematopoietic progenitors, highly quiescent (dormant) HSCs are relatively rich in their mitochondrial content.19-21,25,32,33 Despite these findings, the potential contribution of mitochondrial properties to the control of human HSCs’ potency remains unknown.
Here, we explored this question and found that as in mouse HSCs,19,19-21,25,32,33 highly purified human HSC populations are heterogeneous in their mitochondrial content and MMP. By selecting human HSCs based on their MMP profile, we identified a subset of HSCs with distinct mitochondrial morphology, cycling properties, response to mitogenic stimuli, and superior in vivo engraftment potential. Overall, our study identifies a new approach in selecting for potent human HSCs and demonstrates the advantage of employing a single flow cytometry step using MMP to isolate the most potent subsets within highly purified HSC populations. These findings also implicate mitochondrial activity in regulating human HSC quiescence and potency.
Materials and methods
Mice
NOD/SCID/IL2-R γnull; nonobese diabetic/severe combined immunodeficient/interleukin-2 receptor γ null (NSG) mice were obtained from The Jackson Laboratory. Mice were maintained in specific pathogen-free suit at the animal facility of Icahn School of Medicine at Mount Sinai. Animal protocols were approved by the Institutional Animal Care and Use Committee of Icahn School of Medicine at Mount Sinai.
Human blood processing
Human blood samples including peripheral blood leukocyte reduction filters (LRFs) from healthy donors and CB were obtained from the New York Blood Center. All the analyses were performed using the LRFs except when specified as CB. Peripheral blood leukocytes obtained from 12 to 16 LRFs, or 2 to 3 units of CB were pooled to isolate CD34+ cells each time. Buffy coat was first extracted from fresh peripheral blood (PB) or CB after 15 minutes’ centrifugation at 2000g. Mononuclear cells (MNCs) were then isolated from the interphase of Ficoll gradient by layering the buffy coat on top of Ficoll-Paque PLUS media (GE Healthcare Life Science) and centrifuged at 800g for 30 minutes at 18°C (brake off). CD34+ cells were purified from MNCs by magnetic labeling and positive column separation using human CD34 MicroBead Kit and MACS columns and separator (MACS Miltenyi Biotec #130-046-703, #130-042-401) following the manufacturer’s instruction.
LTC-IC assay
The assay was carried out as previously performed.34,35 In brief, sorted MMP-low or -high CD38− hematopoietic stem and progenitor cells (HSPCs) or CD90+ HSCs were seeded on AFT024 stromal cell monolayers36,37 irradiated at 20Gy (X-ray source) and cultured in hydrocortisone (10−6M) supplemented MyeloCult H5100 (Stem Cell Technology #05100) at 37°C in humidified incubator with 5% CO2 for 5 weeks, or 6.5 weeks as indicated, with weekly one-half media change. Long-term culture initiating cell (LTC-IC) frequency was determined by limiting dilution analysis, applying Poisson distribution as described.38 Briefly, 2 to 3 different doses of cells were seeded in each well of 96-well plates with 10 wells per dose group. Cells harvested from each well at the end of the culture period were interrogated for their colony-forming ability in a 2-week methylcellulose culture (MethoCult H4435 methylcellulose medium; Stem Cell Technology #04435). The presence or absence of colony was scored for each dish as positive or negative responder and the percentage of nonresponders for each dose group was calculated. LTC-IC frequency was determined as the corresponding cell dose that generates 37% nonresponders using the method of Poisson’s maximum likelihood estimation. Statistical analysis was performed using L-Calc software (Stem Cell Technology). LTC-IC–derived colony-forming cells (CFCs) were quantified as the average number of colonies generated in methylcellulose medium (plated as triplicates) initiated from LTC-IC of 150-cell bulk culture.
Immunofluorescent staining, flow cytometry analysis, and FACS sorting
Purified CD34+ cells were stained with fluorochrome conjugated anti-human monoclonal antibodies: APC-CD34 (recognizes an epitope other than that is recognized by the clone QBEND/10 monoclonal antibodies used in magnetic labeling), PerCPCy5.5-CD38, FITC-CD90, PE Cy7/APC Cy7-CD45RA, PE Cy7-CD49f. Following immunostaining, cells were washed and stained subsequently with tetramethylrhodamine ethyl ester (TMRE, 100 nM; Sigma #87917) at 37°C for 20 minutes. Following washing, cells were resuspended in buffer containing 4′, 6-diamidino-2-phenylindole hydrochloride (DAPI; 1 μg/mL; Molecular Probes) and subjected to flow cytometry analysis or fluorescence-activated cell sorting (FACS). For verapamil treatment experiment, verapamil was added to the medium at 50 μM before TMRE staining.
Immunofluorescence and confocal microscopy
A minimal of 200 FACS sorted MMP-low and MMP-high CD90+ (CD34+CD38−CD45RA−CD90+) HSCs or CD34+CD38− HSPCs in 2% fetal bovine serum/Iscove modified Dulbecco medium (Gibco, Cat# 12440-053) were seeded into fibronectin coated 6 channel μ-slides (Ibidi), cytospun (250 rpm, 3 minutes), and incubated at 37°C with 5% CO2 for 30 minutes to allow attaching. Cells were then fixed for 10 minutes with freshly prepared 4% paraformaldehyde solution, washed, and permeabilized with 0.1% Triton-X-100/phosphate-buffered saline for 5 minutes. Cells blocked in 1% bovine serum albumin (BSA)/phosphate-buffered saline with Tween (PBST; 0.01% Tween-20 in phosphate-buffered saline) for 1 hour at room temperature (RT) or overnight at 4°C were then incubated with indicated primary antibody at indicated concentration in 1% BSA/PBST for 1 hour at RT, washed, and then incubated with fluorochrome-conjugated secondary antibody (1:1000) in 1% BSA/PBST in the dark for 1 hour at RT or overnight at 4°C. Cells were mounted with mounting media containing DAPI (Abcam 104139) and sealed. Single plane or Z stack confocal micrographs were acquired and processed using Zen software under Zeiss LSM880 Airyscan (Zeiss) confocal microscopy with a 100X oil objective.
Results
Degree of mitochondrial activity inversely correlates with the potency of human HSCs
To determine the status of mitochondrial activity, we used the positively charged fluorescent probe TMRE39 to measure MMP levels in freshly isolated phenotypically defined subpopulations of human CD34+ HSPCs, CD38− HSPCs (CD34+CD38−), CD90+ HSCs (CD34+CD38−CD45RA−CD90+), and CD49f+ HSCs (CD34+CD38−CD45RA−CD90+CD49f+)40 under steady state conditions. TMRE accumulates in mitochondria of live cells proportionately to mitochondrial activity.39 CD34+ cells purified from peripheral blood MNCs were stained with HSPC markers and TMRE then analyzed by flow cytometry (Figure 1A). We found that MMP levels progressively decrease in phenotypically defined HSPC subpopulations with higher stem cell potential (Figure 1B, left). We then gated the 10% lowest (low MMP) and 10% highest MMP (high MMP) levels of CD90+ HSCs. The same gating was applied to all parental compartments. Phenotypically defined HSCs were enriched in the low MMP fraction, whereas HSPCs were enriched in the high MMP portion (Figure 1B, right). Specifically, a higher percentage of CD90+ HSCs was observed in the low MMP fraction relative to high MMP of CD34+CD38−CD45RA− HSPCs in peripheral blood (Figure 1C).
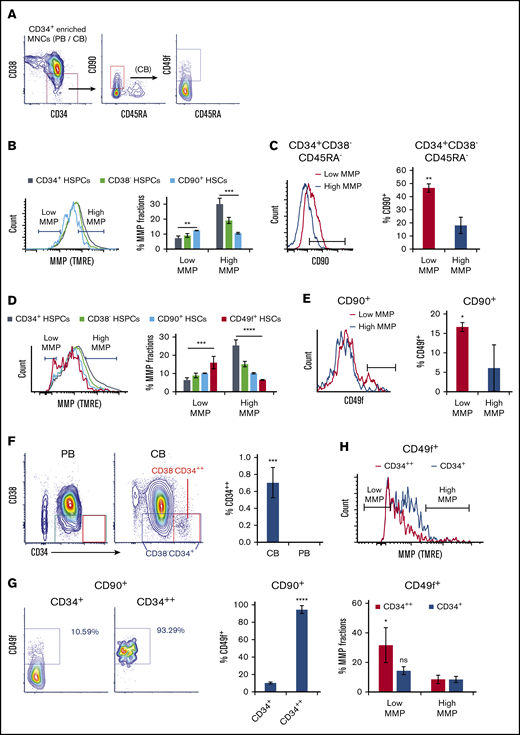
Mitochondrial activity decreases in HSPC subpopulations with increasing stem cell activity. (A) FACS gating strategy of phenotypically defined HSCs/HSPCs. (B,D) FACS histograms (left) of MMP of CD34+ HSPCs, CD38− HSPCs (CD34+CD38−), CD90+ HSCs (CD34+CD38−CD45RA−CD90+), of (B) PB or (D) CB, and CD49f+ HSCs (CD34+CD38−CD45RA−CD90+CD49f+) of (D) CB. The percentage of low and high MMP fractions within parental compartments (right; panel B, n = 3; panel D, n = 5). (C,E) FACS histograms (left) of (C) CD90 or (E) CD49f of subsets at low- or high-MMP levels of (C) PB CD34+CD38−CD45RA− HSPCs or (E) CB CD90+ HSCs. The percentage of (C) CD90+ HSCs or (E) CD49f+ HSCs in parental populations (right; n = 3). (F) FACS profiles of CD34/CD38 of CD34+ cell–enriched PB or CB MNCs (left). The percentage of CD34++ cells in total CD34+ enriched MNCs of CB or PB (right; n = 4). (G) FACS profiles of CD49f of total CD34+ or CD34++ fraction of CD90+ CB HSCs (left); the percentage of CD49f+ HSCs in parental populations (right; n = 3). (H) FACS histogram of MMP of total CD34+ or CD34++ fraction of CD49f+ HSCs (top); the percentage of low- or high-MMP subset within total CD34+ or CD34++ fraction of CD49f+ CB HSCs (bottom; n = 3). Low-MMP and high-MMP gates were set according to 10% the lowest and highest MMP of CD90+ HSCs and applied to all other parental compartments throughout Figure 1. Phenotypes above the graphs indicate parental population. Data are presented as mean ± standard deviation; (C,E-H) Student t test; (B,D) analysis of variance test; *P < .05, **P < .01, ***P < .001, ****P < .0001. ns, not significant.
Mitochondrial activity decreases in HSPC subpopulations with increasing stem cell activity. (A) FACS gating strategy of phenotypically defined HSCs/HSPCs. (B,D) FACS histograms (left) of MMP of CD34+ HSPCs, CD38− HSPCs (CD34+CD38−), CD90+ HSCs (CD34+CD38−CD45RA−CD90+), of (B) PB or (D) CB, and CD49f+ HSCs (CD34+CD38−CD45RA−CD90+CD49f+) of (D) CB. The percentage of low and high MMP fractions within parental compartments (right; panel B, n = 3; panel D, n = 5). (C,E) FACS histograms (left) of (C) CD90 or (E) CD49f of subsets at low- or high-MMP levels of (C) PB CD34+CD38−CD45RA− HSPCs or (E) CB CD90+ HSCs. The percentage of (C) CD90+ HSCs or (E) CD49f+ HSCs in parental populations (right; n = 3). (F) FACS profiles of CD34/CD38 of CD34+ cell–enriched PB or CB MNCs (left). The percentage of CD34++ cells in total CD34+ enriched MNCs of CB or PB (right; n = 4). (G) FACS profiles of CD49f of total CD34+ or CD34++ fraction of CD90+ CB HSCs (left); the percentage of CD49f+ HSCs in parental populations (right; n = 3). (H) FACS histogram of MMP of total CD34+ or CD34++ fraction of CD49f+ HSCs (top); the percentage of low- or high-MMP subset within total CD34+ or CD34++ fraction of CD49f+ CB HSCs (bottom; n = 3). Low-MMP and high-MMP gates were set according to 10% the lowest and highest MMP of CD90+ HSCs and applied to all other parental compartments throughout Figure 1. Phenotypes above the graphs indicate parental population. Data are presented as mean ± standard deviation; (C,E-H) Student t test; (B,D) analysis of variance test; *P < .05, **P < .01, ***P < .001, ****P < .0001. ns, not significant.
Similar analyses using umbilical CB supported these results (Figure 1D). In low MMP, fraction of CD90+ CB HSCs were further enriched in CD34+CD38−CD45RA−CD90+CD49f+ HSCs (CD49f+ HSCs) compared with high MMP (Figure 1E). Altogether, these results suggest that even the most primitive/potent subpopulations of HSCs, including CD90+ HSCs and CD49f+ HSCs,40,41 are heterogeneous in their MMP levels. Notably, the most potent phenotypically defined human HSCs are enriched in subpopulations with the lowest MMPs (Figure 1B,D). As anticipated,19,42 the gradual decrease in MMP follows a similar pattern in HSPCs pretreated or not with efflux pump inhibitor, verapamil, suggesting that although dye efflux as a result of multidrug resistance protein expression is an HSC property, the most potent HSCs exhibit lower MMP (supplemental Figure 1C).
During these side-by-side studies, we noticed that CD34+ cells in CB, in contrast to those in the peripheral blood, were subdivided into 2 populations, a major population containing almost all CD34+ cells, and a small population encompassing only <1% that expresses CD34 at very high levels (referred to as CD34++) (Figure 1F). The CD34++ cells were mostly negative for the CD38 marker, suggesting they constitute a more primitive subset of CD34+ cells (Figure 1F). CD34++ subpopulation exhibited the lowest levels of MMP of the entire CD34+ population and enriched for low MMP close to 30% (supplemental Figure 1A). CD34++CD38− HSPCs were highly enriched in CD90+ HSCs compared with the bulk CD34+CD38− population (supplemental Figure 1B). Furthermore, >90% of CD34++ CD90+ HSCs also expressed CD49f. Also known as very late antigen 6 and integrin α6, CD49f has been shown to greatly enrich for CB HSCs40 (Figure 1G). These observations led us to measure the MMP levels of CD49f+ HSCs within CD34++ fraction, which revealed that CD34++ subpopulation exhibits the lowest MMP levels of the entire highly potent CD49f+ HSCs (Figure 1H). These data suggest that the relative MMP levels, a reflection of mitochondrial activity, may be a predictor of the degree CD34+ human HSC potency.
Lower mitochondrial activity selects for greater stem cell potential
To test this hypothesis, we first examined HSC activity in vitro within subpopulations of CD34+ human PB with distinct MMP levels. The 25% lowest or highest TMRE fluorescent intensity (defined as MMP-low and MMP-high) were sorted (Figure 2A), and subjected to LTC-IC assay. Our results showed that MMP levels functionally segregate CD90+ HSCs because MMP-low CD90+ HSCs contained at least sevenfold more functional HSCs compared with MMP-high CD90+ HSCs (Figure 2B; supplemental Figure 2A; supplemental Table 1). The average number of LTC-IC–derived CFCs generated from bulk cultures was ninefold greater in MMP-low vs MMP-high CD90+ HSCs (Figure 2C). We also found that the more heterogeneous population of CD38− HSPCs was segregated into functionally distinct subsets based on MMP levels. The frequency of LTC-IC in MMP-low CD38− population was more than threefold higher compared with that of MMP-high CD38− population (Figure 2D; supplemental Figure 2B; supplemental Table 1). Similarly, LTC-IC–derived CFCs were threefold more elevated in MMP-low compared with the MMP-high CD38− population (Figure 2E). These combined studies suggest that the relative mitochondrial activity is an indicator of the potency of HSC populations regardless of their phenotypic profile.
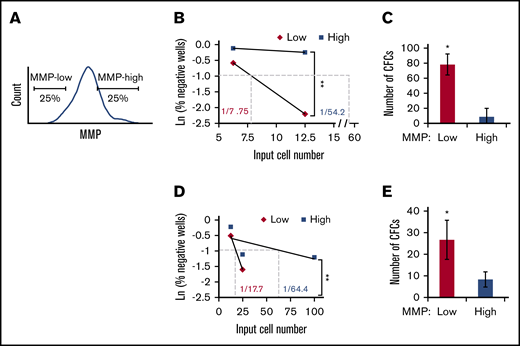
HSCs of lower mitochondrial activity maintain higher ex vivo stem cell function. (A) Gating strategy for FACS sorting MMP-low or MMP-high (25% lowest and highest of parental population, applied throughout the entire article except Figure 1 or otherwise indicated) CD38− HSPCs or CD90+ HSCs. (B,D) Representative scatter plots of limiting dilution analysis of LTC-IC frequency in MMP-low or MMP-high PB (B) CD90+ HSCs or (D) CD38− HSPCs. Dotted lines indicate LTC-IC frequency determined by Ln 37% nonresponder. P values calculated using L-Calc software, **P < .01, (C,E) Total number of LTC-IC–derived CFC generated from 150 initially seeded MMP-low and MMP-high PB (C) CD90+ HSCs or (E) CD38− HSPCs; (n = 2). Data are represented as mean ± standard deviation; (C,E) Student t test, *P < .05, **P < .01.
HSCs of lower mitochondrial activity maintain higher ex vivo stem cell function. (A) Gating strategy for FACS sorting MMP-low or MMP-high (25% lowest and highest of parental population, applied throughout the entire article except Figure 1 or otherwise indicated) CD38− HSPCs or CD90+ HSCs. (B,D) Representative scatter plots of limiting dilution analysis of LTC-IC frequency in MMP-low or MMP-high PB (B) CD90+ HSCs or (D) CD38− HSPCs. Dotted lines indicate LTC-IC frequency determined by Ln 37% nonresponder. P values calculated using L-Calc software, **P < .01, (C,E) Total number of LTC-IC–derived CFC generated from 150 initially seeded MMP-low and MMP-high PB (C) CD90+ HSCs or (E) CD38− HSPCs; (n = 2). Data are represented as mean ± standard deviation; (C,E) Student t test, *P < .05, **P < .01.
Importantly, ex vivo HSC function as measured by the frequency of LTC-IC was maintained in MMP-low CD90+ population that remained an additional 10 days in LTC (1 in 7.94 vs 1 in 7.75), whereas the frequency of LTC-IC–derived from MMP-high CD90+ population decreased by almost fivefold (1 in 64.4 vs 1 in 269) (Figure 2B-C; supplemental Figure 2C). These results suggest that in culture, stem cell activity of MMP-low HSCs is preserved for a longer period in contrast to that of MMP-high HSCs, whose stem cell activity rapidly declined.
We next determined whether different MMP levels would correlate with long-term repopulating ability. We transplanted 800 CB MMP-low and MMP-high CD90+ HSCs into NSG mice. Although the level of chimerism continuously increased in recipients of both MMP fractions during the transplant period, the level of chimerism in mice that received MMP-low CD90+ HSCs was significantly higher than MMP-high recipients (Figure 3A). This was also reflected in the levels seen in the bone marrow (BM), spleen, and PB at 7 months posttransplant (Figure 3B-C). Human grafts in NSG mice, in contrast to human blood, consist mainly of lymphoid cells possibly because of inefficient human myelopoiesis in NSG mice.43-45 Although lymphoid vs myeloid lineage distributions were very similar in the PB and the spleen of mice recipients of MMP-low vs MMP-high CD90+ HSCs (Figure 3D; supplemental Figure 3A), MMP-low in contrast to MMP-high HSCs produced greater human T- or B-lymphoid (CD3+/CD19+) lineages vs myeloid cells (CD33+) in the BM of NSG mice (Figure 3D; supplemental Figure 3A). In addition, human glycophorin A expression was detectable in the BM of recipients of MMP-low but not MMP-high HSCs 7 months posttransplantation (supplemental Figure 3B), altogether suggesting that HSCs with low MMP levels contain the most potent stem cells within the entire population.
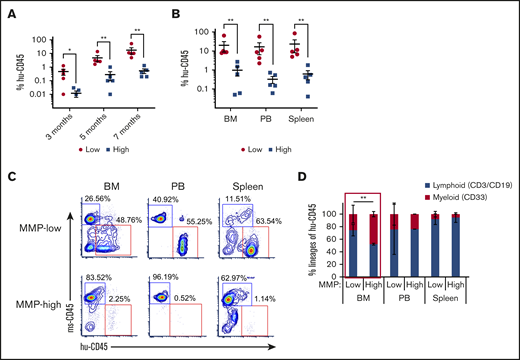
HSCs of lower mitochondrial activity show greater long-term repopulating capacity. (A) Temporal analysis of the engraftment ratio (the percentage of human CD45+ cells in total PB MNCs) of NSG mouse recipients of MMP-low or MMP-high CB CD90+ HSCs at 3, 5, and 7 months posttransplantation. (B) The engraftment ratio (the percentage of human CD45+ cells in total human and mouse CD45+ MNCs) in BM, PB, and spleen 7 months posttransplantation. (C) Representative FACS profiles of BM, PB, and spleen plotted as human CD45 (hu-CD45) (X) vs mouse CD45 (ms-CD45) (Y) from MMP-low or MMP-high recipient mice 7 months posttransplantation. (D) Myeloid/lymphoid lineage distribution (percentage of human CD33+ vs CD3+/CD19+ cells in total human CD45+ cells) in BM, PB, and spleen 7 months posttransplantation. Lineage analysis was performed only for transplants with engraftment ratio above 1%. Data are represented as mean ± standard deviation; (D) Student t test; (A-B) Mann-Whitney U test, *P < .05, **P < .01.
HSCs of lower mitochondrial activity show greater long-term repopulating capacity. (A) Temporal analysis of the engraftment ratio (the percentage of human CD45+ cells in total PB MNCs) of NSG mouse recipients of MMP-low or MMP-high CB CD90+ HSCs at 3, 5, and 7 months posttransplantation. (B) The engraftment ratio (the percentage of human CD45+ cells in total human and mouse CD45+ MNCs) in BM, PB, and spleen 7 months posttransplantation. (C) Representative FACS profiles of BM, PB, and spleen plotted as human CD45 (hu-CD45) (X) vs mouse CD45 (ms-CD45) (Y) from MMP-low or MMP-high recipient mice 7 months posttransplantation. (D) Myeloid/lymphoid lineage distribution (percentage of human CD33+ vs CD3+/CD19+ cells in total human CD45+ cells) in BM, PB, and spleen 7 months posttransplantation. Lineage analysis was performed only for transplants with engraftment ratio above 1%. Data are represented as mean ± standard deviation; (D) Student t test; (A-B) Mann-Whitney U test, *P < .05, **P < .01.
Notably, functionally highly potent MMP-low CD90+ HSCs are enriched 10-fold in the low MMP CD34+ population relative to the total CD34+ population (supplemental Figure 3C). These combined findings support the notion that highly potent human HSCs may be isolated based on intrinsic metabolic activity reflected by their MMPs.
Cell-cycle entrance is delayed in HSCs with lower mitochondrial activity
The potency of the most primitive HSCs is directly linked to their ability to maintain quiescence over time.46-52 Having shown that MMP levels can predict stem cell potency, we reasoned that mitochondrial activity may correlate with cell-cycle status in HSCs. To examine this, RNA and DNA were double stained with Pyronin Y and Hoechst, respectively, in MMP-low and MMP-high CD38− HSPCs (Figure 4A) or CD90+ HSCs (supplemental Figure 4A). More than 93.3% of MMP-low CD38− HSPCs were found in the G0 phase (Hoechst-low, Pyronin Y-low) compared with 70.4% of MMP-high cells (Figure 4A, right), suggesting that low MMP level identifies quiescent cells from a mixed population of both stem and progenitor cells. In addition, and consistent with previous reports50 we found that >90% of both MMP-low and MMP-high CD90+ HSCs are in G0 phase of cell cycle (supplemental Figure 4A, right).
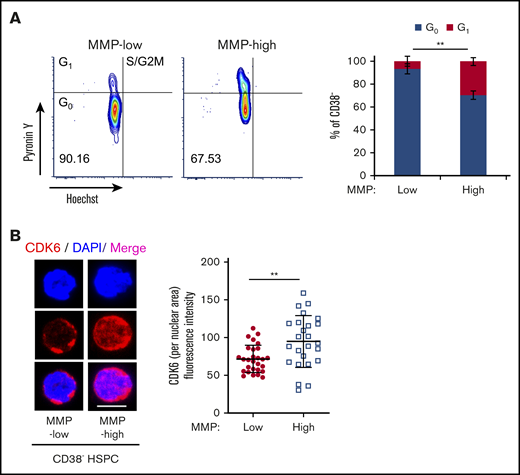
Subpopulations of quiescent HSCs with distinct mitochondrial activity. (A) FACS profiles (left) of cell-cycle analysis of sorted CD38− PB HSPCs, by Pyronin Y/Hoechst staining; percentage of G0 and G1 phases in MMP-low or MMP-high subsets (right; n = 3). (B) Representative immunofluorescent confocal image (left) of CDK6 and quantification of fluorescence intensity of CDK6 within nuclear area (right) in MMP-low and MMP-high CD38− PB HSPCs. CDK6, red; DAPI, blue; scale bar, 5 μm. Data are represented as mean ± standard deviation; Student t test, **P < .01.
Subpopulations of quiescent HSCs with distinct mitochondrial activity. (A) FACS profiles (left) of cell-cycle analysis of sorted CD38− PB HSPCs, by Pyronin Y/Hoechst staining; percentage of G0 and G1 phases in MMP-low or MMP-high subsets (right; n = 3). (B) Representative immunofluorescent confocal image (left) of CDK6 and quantification of fluorescence intensity of CDK6 within nuclear area (right) in MMP-low and MMP-high CD38− PB HSPCs. CDK6, red; DAPI, blue; scale bar, 5 μm. Data are represented as mean ± standard deviation; Student t test, **P < .01.
Because cyclin-dependent kinase 6 (CDK6) has been shown to be a marker of HSC activation and G0 exit,19,48,50 we investigated its expression in MMP fractions. We found that both MMP-low and MMP-high CD38− HSPCs that were primed to divide have similar total cellular expression of CDK6 protein (supplemental Figure 4B), whereas nuclear CDK6 expression was significantly higher in MMP-high cells (Figure 4B). This suggests that MMP-high HSPCs are activated or primed to progress further in the cell cycle. On the other hand, CDK6 expression was very low in both MMP fractions of CD90+ HSCs that we examined (supplemental Figure 4B).
Given these results, we wondered whether MMP levels could predict distinct kinetics of HSC division upon stimulation. Individually sorted cells were cultured in serum-free medium supplemented with standard mitogenic cytokines (SCF, TPO, Flt3 ligand). We monitored cell divisions in each well periodically and compared the kinetics of division. These studies revealed that the time required for 50% of the cells to complete a first division was delayed by 6.89 hours in MMP-low compared with MMP-high CD38− HSPCs (supplemental Figure 5A). Although MMP-low and MMP-high CD90+ HSCs displayed similar levels of quiescence and low CDK6 expression (supplemental Figure 4), their cell-cycle entry kinetics differed upon cytokine stimulation (Figure 5A-B). The division of MMP-low CD90+ HSCs was delayed by an average of 4.26 hours (Figure 5A). The mean time of MMP-low CD90+ HSCs to finish the first division was 83.5 hours, 6.35 hours longer than MMP-high CD90+ HSCs (Figure 5B-C). Furthermore, after exiting quiescence, the average interval between the first and second cell division was also longer for MMP-low than MMP-high CD90+ HSCs (Figure 5D), indicating that the impact of mitochondrial activity on HSC cycling may not be limited to G0 exit. Notably, MMP-low CD90+ HSCs of CB origin displayed an even greater delay in ΔKhalf compared MMP-high CD90+ CB HSCs (supplemental Figure 5B). MMP-high CD90+ HSCs were also found to proliferate 3.5 times more than MMP-low in culture and generate larger cluster of cells after 9 days under optimum cytokine conditions, further confirming these results (Figure 5E). The expression of CDK6 after 34 hours in culture with optimum cytokines was significantly more elevated in MMP-high compared with MMP-low CD90+ HSCs (Figure 5F-G). Although the nuclear size of MMP-high HSCs varied greatly ranging from small to large, MMP-low HSCs contained homogenously small size nuclei (Figure 5F,H). As shown by confocal images in Figure 5F, whereas MMP-high CD90+ HSCs during the 34 hours covered a range encompassing progressive stages of HSC priming, MMP-low CD90+ HSCs exhibited mostly uniform morphology (Figure 5F-H). These results demonstrate that upon cytokine exposure, MMP-low lag behind MMP-high CD90+ HSCs in cell-cycle entry and progression, despite the G0 phenotype of both subsets. Together, these findings support the notion that HSCs with higher mitochondrial activity are primed in their response to environmental cues.
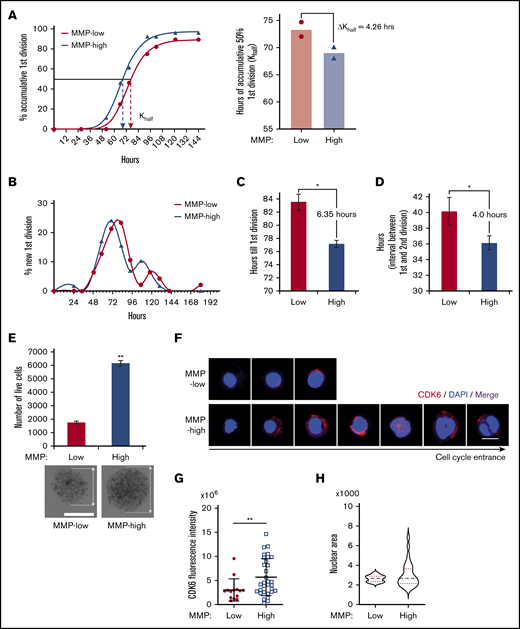
Cell-cycle entrance is delayed in HSCs with lower mitochondrial activity. (A) Representative plot (left) of the percentage of cumulative first division of total initial cells (fitted into sigmoidal curve) in MMP-low or MMP-high CD90+ PB HSC single-cell culture in cytokine-supplied STEM SPAN. R2 > 0.997. Dotted arrows represent Khalf: hours for cumulative 50% cells to finish first division (deducted from the curve). Mean best fit value (right) of Khalf of repeated experiments (P = .06, n = 2). ΔKhalf: difference of Khalf between MMP-low and MMP-high CD90+ HSCs. (B) Representative plot of the percentage of newly finished first division of total initial cells (fitted into spline curve). (C) The mean time (recorded) to complete the first division. (D) The mean interval time (recorded) between the first and second divisions. In total, 75 to 84 single live cells were scored (n = 2). (E) Total number of live cells from a 9-day expansion of 600 seeded cells in cytokine-supplied STEM SPAN (top; n = 2). Representative bright field light microscopy images of cell clusters (bottom; scale bar, 0.15 mm). Arrows indicate the diameter of the clusters. (F-H) Representative immunofluorescent confocal images of CDK6 (F; scale bar, 5 μm), quantification of total CDK6 fluorescent intensity (G), and the distribution of nuclear sizes (H) of MMP-low and MMP-high CD90+ PB HSCs after 34 hours in culture. Data are presented as mean ± standard deviation; Student t test, *P < .05, **P < .01.
Cell-cycle entrance is delayed in HSCs with lower mitochondrial activity. (A) Representative plot (left) of the percentage of cumulative first division of total initial cells (fitted into sigmoidal curve) in MMP-low or MMP-high CD90+ PB HSC single-cell culture in cytokine-supplied STEM SPAN. R2 > 0.997. Dotted arrows represent Khalf: hours for cumulative 50% cells to finish first division (deducted from the curve). Mean best fit value (right) of Khalf of repeated experiments (P = .06, n = 2). ΔKhalf: difference of Khalf between MMP-low and MMP-high CD90+ HSCs. (B) Representative plot of the percentage of newly finished first division of total initial cells (fitted into spline curve). (C) The mean time (recorded) to complete the first division. (D) The mean interval time (recorded) between the first and second divisions. In total, 75 to 84 single live cells were scored (n = 2). (E) Total number of live cells from a 9-day expansion of 600 seeded cells in cytokine-supplied STEM SPAN (top; n = 2). Representative bright field light microscopy images of cell clusters (bottom; scale bar, 0.15 mm). Arrows indicate the diameter of the clusters. (F-H) Representative immunofluorescent confocal images of CDK6 (F; scale bar, 5 μm), quantification of total CDK6 fluorescent intensity (G), and the distribution of nuclear sizes (H) of MMP-low and MMP-high CD90+ PB HSCs after 34 hours in culture. Data are presented as mean ± standard deviation; Student t test, *P < .05, **P < .01.
MMP-low HSCs contain fragmented mitochondria
Mitochondrial activity is regulated through dynamic modifications of their networks via a constant reshaping processes called fusion and fission.14,17 We used 3-dimensional confocal imaging and a specific probe translocase of outer mitochondria membrane 20 (TOM20) to examine mitochondrial morphology. Using this approach, we found that although total mitochondrial mass was comparable between MMP-low and MMP-high CD90+ HSCs (supplemental Figure 6A), mitochondria of MMP-low CD90+ HSCs were more fragmented than MMP-high HSCs (Figure 6Ai). The number of mitochondrial fragments (9 ± 3.14 vs 6.25 ± 3.38 per cell) was higher (Figure 6Aii), whereas the mean area (Figure 6Aiii) and volume (Figure 6Aiv) per fragment were lower in MMP-low vs MMP-high CD90+ cells, suggesting that MMP-high CD90+ HSCs contain more fused mitochondria than MMP-low CD90+ HSCs (Figure 6A). Similar results were found in MMP-low CD38− HSPCs labeled with TOM20 (supplemental Figure 6B) or voltage-dependent anion channel, another mitochondrial marker (supplemental Figure 6C). In addition, despite similar overall cellular expression (supplemental Figure 6D) of the mitochondrial fission dynamin-related protein 1 (DRP1) GTPase,16 the intensity of detectable localized DRP1 foci as well as DRP1 localization to mitochondria was significantly greater (Figure 6B-C) in MMP-low compared with MMP-high CD90+ HSCs. Altogether, these results suggest that potent human HSCs maintain a low MMP level through dynamic fragmentation of mitochondria.
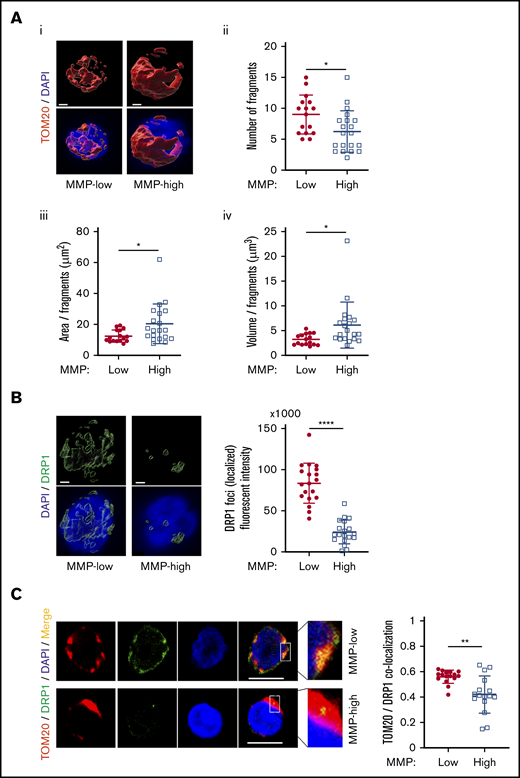
MMP-low HSCs contain more fragmented mitochondria. (Ai) Representative 3-dimensional immunofluorescent confocal images of TOM20 (red, TOM20; blue, DAPI; scale bar, 1 μm). (Aii) The total number of mitochondrial fragments per cell. (Aiii-Aiv) The average area and volume per fragment of mitochondria in each cell. (B) Representative 3-dimensional immunofluorescent confocal images (left) of DRP1 (green, DRP1; blue, DAPI; scale bar, 1 μm) and quantification (right) of fluorescence intensity of localized DRP1 foci above threshold. (C) Two-dimensional immunofluorescent confocal images (left; scale bar, 5 μm) of TOM20 (red), DRP1 (green), DAPI (blue), merged (yellow); inset contains magnified images, quantification of colocalization of TOM20 and DRP1 (right). All analyses were performed in MMP-low and MMP-high CD90+ PB HSCs. Data are presented as mean ± standard deviation; Student t test: *P < .05, **P < .01, ****P < .0001.
MMP-low HSCs contain more fragmented mitochondria. (Ai) Representative 3-dimensional immunofluorescent confocal images of TOM20 (red, TOM20; blue, DAPI; scale bar, 1 μm). (Aii) The total number of mitochondrial fragments per cell. (Aiii-Aiv) The average area and volume per fragment of mitochondria in each cell. (B) Representative 3-dimensional immunofluorescent confocal images (left) of DRP1 (green, DRP1; blue, DAPI; scale bar, 1 μm) and quantification (right) of fluorescence intensity of localized DRP1 foci above threshold. (C) Two-dimensional immunofluorescent confocal images (left; scale bar, 5 μm) of TOM20 (red), DRP1 (green), DAPI (blue), merged (yellow); inset contains magnified images, quantification of colocalization of TOM20 and DRP1 (right). All analyses were performed in MMP-low and MMP-high CD90+ PB HSCs. Data are presented as mean ± standard deviation; Student t test: *P < .05, **P < .01, ****P < .0001.
Discussion
Here, we showed that the greatly purified potent human CD90+ HSCs are heterogeneous in their mitochondrial content (morphology and activity). We demonstrated that low levels of mitochondrial activity as reflected in MMP identify a highly potent subset of CD90+ HSCs with significantly superior stem cell capacity (Figures 2 and 3). These MMP-low CD90+ HSCs are delayed in CDK6 expression and cell-cycle entry when stimulated with cytokines compared with MMP-high CD90+ HSCs that are more primed to divide (Figure 5). Furthermore, mitochondria in MMP-low CD90+ HSCs, in contrast to their MMP-high counterparts, are relatively fragmented (Figure 6). In sum, these results suggest that reduced mitochondrial activity and network organization in human HSCs are indicators of prolonged quiescence and select for HSC with long-lasting in vitro and in vivo activity (Figures 2 and 3).
Quiescent HSCs that bear greater divisional history are more likely to reenter cell cycle, which diminish their functional potential.48 The delay of MMP-low relative to MMP-high human HSCs in exiting quiescence implies a dormant state in these cells. This notion is further supported by our recent finding that phenotypically defined mouse HSCs with low MMP are enriched in label-retaining HSCs which share their molecular signature overlap.19 Using MMP as a parameter to isolate highly potent, dormant HSCs provides a strategy to greatly improve long-term engraftment of HSCs for transplantation. This approach may also be used for small molecule screening in the discovery of new effective candidate compounds for expansion of CB stem cells, considered currently as the best source for HSC transplantation. In addition, MMP levels may be used to enhance generation of HSCs from pluripotent stem cells.
MMP as a single parameter enriches for functional long-term potent MMP-low CD90+ HSCs almost 10-fold in the whole population of CD34+ cells (supplemental Figure 3C). The capacity of MMP-low to long-term repopulate immunodeficient NSG mice is 20-fold above that of MMP-high, indicating that elevated mitochondrial activity markedly diminishes stem cell potency (Figure 3). Notably, a low level of MMP in CD90+ HSCs is correlated with higher CD49f expression. Our results of long-term engraftment ratio of MMP-low CD90+ HSCs is estimated to reach a similar level as highly purified CD90+CD49f+ human HSCs,40 if the same methods for transplantation were applied. Given the context of the xenograft, our results might also reflect potential additional properties of the low MMP subpopulation of HSCs including homing and/or lodging during transplantation that require further investigation.
Bone marrow chimerism in the recipient of MMP-high HSCs exhibited higher myeloid to lymphoid ratio compared with MMP-low recipients (Figure 3C-D), consistent with our results in mice.19 More rapid and frequent cell-cycle entry of HSCs with higher mitochondrial activity may be implicated in myeloid-biased differentiation.24,25 This interpretation is consistent with several models of defective mitochondria in HSCs.25,53-55 These combined results raise the possibility that in addition to stem cell activity and cycling, mitochondrial heterogeneity might be part of an intrinsic network that controls the HSC lineage potential.19
Our studies also reveal a property of CD34, the main marker used for HSC isolation,34,56-58 which, to our knowledge appears to be specific to CB (Figure 1F-H). We observed that a very small but distinct fraction of CB, but not PB, cells express high levels of CD34, are almost entirely MMP-low, and highly enriched for CD49f+ cells. The high degree of purity of selected CD34+ MNCs and the large number of events acquired by flow cytometry enabled the detection of this minor population. Our results indicate a strong correlation between high CD34 expression and low mitochondrial activity which might be an indication of the developmental stage of CB stem cells.59,60
Our work identifies a new and simple approach based on mitochondrial activity to select for potent human HSCs for research and clinical use. The work will enable identifying properties of dormant human HSCs that may be diluted in the bulk of phenotypically identified, albeit highly purified, HSCs. This work also exposes a previously unrecognized function for mitochondrial membrane potential in improving human HSC culture. In combination with published findings (reviewed in Filippi and Ghaffari30 ), these results raise the possibility that mitochondrial properties might be intimately linked to, and actively participate in, determining human HSC lineage determination, an area that requires further investigation.
Any requests for additional data should be sent via e-mail to the corresponding author.
Acknowledgments
The authors thank the Flow Cytometry Core and Microscopy CoRE at the Icahn School of Medicine at Mount Sinai for technical help.
This work was supported by grants from the National Institutes of Health, National Heart, Lung, and Blood Institute (R01HL136255), National Cancer Institute (R01CA205975), and funds from NYSTEM IIRP C32602GG (S.G.)
Authorship
Contribution: J.Q. and S.G. designed the experiments and wrote the manuscript; J.Q., J.G., M.L., and T.A. performed experiments and analyzed data; K.M. provided key reagents; and S.G. conceived the project.
Conflict-of-interest disclosure: The authors declare no competing financial interests.
Correspondence: Saghi Ghaffari, Department of Cell, Developmental & Regenerative Biology, Icahn School of Medicine at Mount Sinai, One Gustave L. Levy Pl, Box 1496, New York, NY 10029; e-mail: saghi.ghaffari@mssm.edu.

