

Key Points
Use of NOACs rather than VKAs was associated with lower risks of all-cause death and all bleeding categories in AF patients.
Rate of death was highest in patients with major bleeding and higher in patients with nonmajor bleeding than in those with no bleeding.

Abstract
In atrial fibrillation (AF), lower risks of death and bleeding with non-vitamin-K oral anticoagulants (NOACs) were reported in meta-analyses of controlled trials, but whether these findings hold true in real-world practice remains uncertain. Risks of bleeding and death were assessed in 52 032 patients with newly diagnosed AF enrolled in GARFIELD-AF (Global Anticoagulant Registry in the FIELD–Atrial Fibrillation), a worldwide prospective registry. Baseline treatment was vitamin K antagonists (VKAs) with or without antiplatelet (AP) agents (VKA ± AP) (20 151; 39.3%), NOACs ± AP agents (14 103; 27.5%), AP agents only (10 748; 21.0%), or no antithrombotics (6219; 12.1%). One-year follow-up event rates (95% confidence interval [CI]) of minor, clinically relevant nonmajor (CRNM), and major bleedings were 2.29 (2.16-2.43), 1.10 (1.01-1.20), and 1.31 (1.21-1.41) per 100 patient-years, respectively. Bleeding risk was lower with NOACs than VKAs for any bleeding (hazard ratio (HR) [95% CI]), 0.85 [0.73-0.98]) or major bleeding (0.79 [0.60-1.04]). Compared with no bleeding, the risk of death was higher with minor bleeding (adjusted HR [aHR], 1.53 [1.07-2.19]), CRNM bleeding (aHR, 2.59 [1.80-3.73]), and major bleeding (aHR, 8.24 [6.76-10.04]). The all-cause mortality rate was lower with NOACs than with VKAs (aHR, 0.73 [0.62-0.85]). Forty-five percent (114) of all deaths occurred within 30 days, and 40% of these were from intracranial/intraspinal hemorrhage (ICH). The rates of any bleeding and all-cause death were lower with NOACs than with VKAs. Major bleeding was associated with the highest risk of death. CRNM bleeding and minor bleeding were associated with a higher risk of death compared to no bleeding. Death within 30 days after a major bleed was most frequently related to ICH. This trial was registered at www.clinicaltrials.gov as #NCT01090362.
Introduction
Oral anticoagulation (OAC) reduces the risk of death and stroke/systemic embolism (SE) in atrial fibrillation (AF), at the cost of an increased risk of bleeding.1-3 In AF, the rates and prognostic impact of bleeding have been described in controlled randomized trials (RCTs) and retrospective population-based studies.4-10 They were rarely analyzed in prospective registries.11 Non-vitamin-K oral anticoagulants (NOACs) have a better safety profile than vitamin K antagonists (VKAs) in RCTs and meta-analysis.12-16 Whether findings from RCTs are confirmed in a large prospective registry reflecting daily routine practice worldwide remains to be shown.
The aim of our study was to (1) describe the incidence, sites, severity, predictors, and outcomes of bleeding and (2) assess the safety profiles of NOACs vs VKAs at 1 year follow-up in 52 080 patients with newly diagnosed AF enrolled in the prospective Global Anticoagulant Registry in the FIELD–Atrial Fibrillation (GARFIELD-AF).17,18
Methods
Study design
GARFIELD-AF is the largest fully recruited multinational prospective registry in AF.17 Patients were prospectively recruited between March 2010 and August 2016 in >1000 investigational sites (identified nationally as representative) in 35 countries. Adults ≥18 years were eligible for inclusion if they were diagnosed with AF within 6 weeks of study entry. Identification of patients was according to standard local practice, and patients were required to have ≥1 unspecified investigator-defined risk factor for stroke. Patients were enrolled prospectively and consecutively at sites that reflected the diversity of care settings in each participating country (office-based practice; hospital departments [neurology, cardiology, geriatrics, internal medicine, and emergency]; anticoagulation clinics; and general or family practice).17,18
Ethics statement
Independent ethics committee and hospital-based institutional review board approvals were obtained. The registry was conducted in accordance with the principles of the Declaration of Helsinki, local regulatory requirements, and the International Conference on Harmonization–Good Pharmacoepidemiologic and Clinical Practice guidelines. Written informed consent was obtained from all study participants.
Procedures and outcome measures
Patients who were taking anticoagulants prior to study enrolment were excluded from this analysis. Baseline characteristics collected at study entry included medical history, care setting, type of AF, date and method of diagnosis of AF, symptoms, antithrombotic treatment (VKA, NOAC, and antiplatelet [AP] treatment), and cardiovascular drugs. The risk profile for death, stroke/SE, and bleeding was assessed with the congestive heart failure, hypertension, age ≥75 years, diabetes mellitus, prior stroke, TIA, or thromboembolism, vascular disease, age 65-74 years, sex category (CHA2DS2-VASc) and hypertension (uncontrolled systolic blood pressure >160 mm Hg), abnormal renal or liver function, previous stroke, bleeding history or predisposition, Labile international normalized ratios, elderly, and concomitant drugs or alcohol excess (HAS-BLED)17-19 and GARFIELD-AF risk calculator.20 We used standardized definitions for clinical events.17,18 Bleeding severity was defined as major, clinically relevant nonmajor (CRNM), and minor bleeding according to the International Society on Thrombosis and Haemostasis scale17,18 (details in supplemental Material). Data for this report were extracted from the study database on 19 November 2018.
Collection of follow-up data using an electronic case report (eCRF) form occurred at 4 monthly intervals up to 24 months or until death or loss to follow-up, whichever occurred first. Submitted data were examined for completeness and accuracy by the coordinating center (Thrombosis Research Institute, London, United Kingdom), and data queries were sent to study sites. In accordance with the study protocol, 20% of all eCRFs were monitored against source documentation.21
Statistical analysis
Continuous variables were expressed as medians and interquartile ranges and categorical variables as frequencies and percentages. As studies with large sample sizes tend to produce statistically significant findings in the presence of clinically irrelevant differences, no formal statistical tests were performed for the baseline tables.
For descriptive purposes, such as baseline tables where patients must be assigned to only 1 group, the worst bleed category that the patient experienced is assigned. Otherwise, the first occurrence of each bleed type is used.
Rates are presented as person-years with 95% confidence intervals for the first occurrence of the clinical outcomes. The timing of events by baseline treatment started at the day of enrolment; survival after bleeding started on the day of bleed.
All-cause mortality rates per 100 person-years for the different types of bleeds, including no bleed, were calculated using a different method. All patients started as “no bleeds” until they had their first worst bleed. At this point, time began for the corresponding bleed group and then followed up for a total of 365 days. A death was assigned to the period in which the event occurred. Thus, patients with bleeds contribute to the rate for both “no bleeds” and their worst bleed category.
Hazard ratios (HRs) of the risk of all-cause mortality for each type of bleed were calculated with Cox proportional hazards model, using bleeding by type as time-dependent covariates. To account for within-patient variance, given the occurrence of multiple bleeds in the same patient, clustering was used. Adjusted HRs (aHRs) used factors previously derived for all-cause mortality in the GARFIELD-AF study.22 Single imputation was applied for missing data.
For predictors of major bleeding (vs those without a major bleed), a LASSO (least absolute shrinkage and selection operator) model was used for a single imputation data set. The HRs and corresponding standard errors for the final model of major bleeding were derived across 5 multiple imputed data sets that had been generated applying the Markov chain Monte Carlo (MCMC) methodology.
Comparative effectiveness of treatments was calculated using the subset of patients from cohorts 3 to 5 (when NOACs were available), with a CHA2DS2-VASc ≥2 in men and ≥3 in women, without OAC treatment prior to enrolment and who were prescribed a VKA or a NOAC at baseline. HRs for NOACs vs VKAs were obtained using a Cox proportional hazards model using a propensity method of overlap weighting to balance covariates in the population.23 The applied method overlaps weights and optimizes the efficiency of comparisons by defining the population with the most overlap in the covariates between treatment groups. This scheme eliminates the potential for outlier weights by avoiding a weight based on a ratio calculation using values bounded by 0 and 1. Thus, when using overlap weights, many of the concerns regarding the assessment and the trimming of the weights are eliminated. Covariates evaluated in the weighting scheme included demographic characteristics, medical history, and other characteristics (details in supplemental Material). Treatment was defined as the first treatment received at the time of enrolment, approximating “intention to treat.” Patients with missing values were not removed from the study; single imputation was applied for the comparative effectiveness analysis.
Analyses were performed using R version 3.5.3 (libraries include, but are not limited to, survival_2.4 and ggplot2) and SAS Enterprise Guide 7.15.
Results
Baseline characteristics
Following the exclusion of patients with unavailable follow-up, the study population comprised all 52 032 patients prospectively recruited in the GARFIELD-AF registry with at least 1 year of follow-up, of whom 49 702 had no bleed, 1098 suffered only a minor bleed (2.29 [2.16-2.43]), 524 a minor or CRNM bleed (1.10 [1.01-1.20]), and 622 with ≥1 major bleed (1.31 [1.21-1.41]) per 100 patient-years, totaling 2330 patients with ≥1 bleeding episode, including 86 unclassified bleeds.
Patients who bled were older, tended to have higher blood pressure and lower body weight (major bleeding patients), and more frequently had a history of hypertension (major and CRNM bleeding patients) than patients who did not bleed. Those who bled had a more frequent history of bleeding, vascular disease, stenting, stroke, diabetes (major bleeding patients), and moderate to severe chronic kidney disease (CKD). They were more often white and less often Asian. The pattern of AF (permanent, persistent, paroxysmal, or unclassified) at the time of recruitment was similar across the different subgroups. The risk profiles for death, stroke/SE, and bleeding as assessed by the GARFIELD-AF risk calculator20 were higher in all patients who bled than in no-bleeding patients.
Overall, VKAs with or without AP agents (VKA ± AP) (n = 20 151, 39.3%) were more commonly prescribed than NOACs with or without AP agents (NOAC ± AP) (n = 14 103, 27.5%), AP monotherapy (n = 10 478, 21.0%), or no treatment (n = 6219, 12.1%). Bleeding irrespective of its severity was numerically more commonly observed in VKA-treated patients than in NOAC-treated patients, AP-treated patients, and no-treatment patients (Figure 1). The prescription of OAC combined with AP agents tended to be more frequent in patients who bled (Table 1).
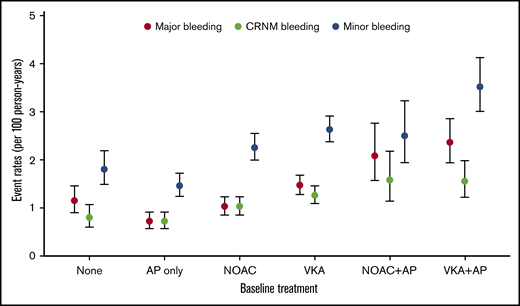
Bleeding rates per 100 person-years according to antithrombotic patterns at baseline.
Bleeding rates per 100 person-years according to antithrombotic patterns at baseline.
Baseline characteristics by bleeding occurrence and severity
| Baseline characteristics | Bleeding occurrence and severity | |||
|---|---|---|---|---|
| Major bleed (n = 622) | CRNM bleed (n = 524) | Minor (n = 1098) | No bleed (n = 49 702) | |
| Female sex, n (%) | 316 (50.8) | 225 (42.9) | 498 (45.4) | 21 913 (44.1) |
| Age, median (Q1;Q3), y | 76.0 (70.0;82.0) | 75.0 (68.0;81.0) | 74.0 (66.0;79.0) | 71.0 (62.0;78.0) |
| Ethnicity, n (%) | ||||
| White | 430 (71.4) | 406 (81.4) | 778 (75.5) | 30 338 (62.5) |
| Hispanic/Latino | 36 (6.0) | 22 (4.4) | 41 (4.0) | 3293 (6.8) |
| Asian | 123 (20.4) | 63 (12.6) | 185 (18.0) | 13 883 (28.6) |
| Afro-Caribbean/mixed/other | 13 (2.2) | 8 (1.6) | 26 (2.5) | 1021 (2.1) |
| BMI, median (Q1;Q3), kg/m2 | 26.5 (23.3;31.0) | 27.5 (24.4;30.9) | 27.0 (24.2;31.2) | 26.9 (23.9;30.7) |
| Systolic blood pressure, median (Q1;Q3), mm Hg | 133.0 (120.0;145.0) | 135.0 (120.0;145.0) | 134.0 (120.0;148.0) | 130.0 (120.0;145.0) |
| Diastolic blood pressure, median (Q1;Q3), mm Hg | 80.0 (70.0;87.5) | 80.0 (70.0;89.0) | 80.0 (70.0;88.0) | 80.0 (70.0;88.0) |
| Pulse, median (Q1;Q3), bpm | 88.0 (72.0;110.0) | 88.0 (71.0;112.0) | 84.0 (70.0;110.0) | 84.0 (70.0;105.0) |
| Type of atrial fibrillation, n (%) | ||||
| Permanent | 68 (10.9) | 76 (14.5) | 129 (11.7) | 6345 (12.8) |
| Persistent | 84 (13.5) | 77 (14.7) | 148 (13.5) | 7439 (15.0) |
| Paroxysmal | 146 (23.5) | 136 (26.0) | 292 (26.6) | 13 709 (27.6) |
| New onset (unclassified) | 324 (52.1) | 235 (44.8) | 529 (48.2) | 22 203 (44.7) |
| Care setting specialty at diagnosis, n (%) | ||||
| Internal medicine/neurology/geriatrics | 146 (23.5) | 125 (23.9) | 226 (20.6) | 9933 (20.0) |
| Cardiology | 370 (59.5) | 290 (55.3) | 652 (59.4) | 32 826 (66.1) |
| Primary care/general practice | 106 (17.0) | 109 (20.8) | 220 (20.0) | 6937 (14.0) |
| Care setting location at diagnosis, n (%) | ||||
| Hospital | 343 (55.1) | 275 (52.5) | 598 (54.5) | 29 085 (58.5) |
| Office/anticoagulation clinic/thrombosis center | 168 (27.0) | 158 (30.2) | 335 (30.5) | 15 225 (30.6) |
| Emergency room | 111 (17.8) | 91 (17.4) | 165 (15.0) | 5385 (10.8) |
| Medical history, n (%) | ||||
| Heart failure | 144 (23.2) | 130 (24.8) | 247 (22.5) | 11 201 (22.5) |
| Acute coronary syndromes | 101 (16.3) | 64 (12.2) | 155 (14.2) | 5208 (10.5) |
| Vascular disease* | 199 (32.2) | 149 (28.5) | 317 (29.0) | 12 129 (24.6) |
| Carotid occlusive disease | 37 (6.0) | 17 (3.3) | 40 (3.7) | 1445 (2.9) |
| VTE | 19 (3.1)) | 24 (4.6) | 35 (3.2) | 1274 (2.6) |
| Prior stroke/TIA/SE | 88 (14.2) | 75 (14.4) | 152 (13.9) | 5514 (11.2) |
| Prior bleeding | 40 (6.5) | 27 (5.2) | 60 (5.5) | 1186 (2.4) |
| Hypertension | 492 (79.4) | 405 (77.4) | 825 (75.1) | 37 823 (76.3) |
| Hypercholesterolemia | 281 (46.1) | 240 (47.3) | 490 (45.8) | 19 917 (41.4) |
| Diabetes | 177 (28.5) | 122 (23.3) | 228 (20.8) | 10 998 (22.1) |
| Cirrhosis | 7 (1.1) | 3 (0.6) | 5 (0.5) | 279 (0.6) |
| Moderate to severe CKD | 138 (22.9) | 102 (20.0) | 186 (17.6) | 4915 (10.3) |
| Dementia | 12 (1.9) | 9 (1.7) | 19 (1.7) | 723 (1.5) |
| Heavy alcohol consumption | 10 (1.9) | 8 (1.9) | 27 (3.0) | 979 (2.3) |
| Current smoker | 54 (9.5) | 26 (5.5) | 81 (8.2) | 5031 (11.1) |
| Treatment, n (%) | ||||
| NOAC ± AP | 160 (26.3) | 148 (28.8) | 307 (28.2) | 13 488 (27.5) |
| VKA ± AP | 311 (51.1) | 247 (48.1) | 529 (48.7) | 19 064 (38.9) |
| AP agent only | 72 (11.8) | 72 (14.0) | 147 (13.5) | 10 457 (21.3) |
| None | 66 (10.8) | 46 (9.0) | 104 (9.6) | 6003 (12.2) |
| AP treatment (alone or in combination) | 222 (36.5) | 176 (34.3) | 359 (33.0) | 17 321 (35.3) |
| CHA2DS2-VASc score, median (Q1;Q3) | 4.0 (3.0;5.0) | 4.0 (3.0;5.0) | 3.0 (2.0;5.0) | 3.0 (2.0;4.0) |
| HAS-BLED score, median (Q1;Q3)† | 2.0 (1.0;2.0) | 2.0 (1.0;2.0) | 2.0 (1.0;2.0) | 1.0 (1.0;2.0) |
| GARFIELD death score, median (Q1;Q3)‡ | 4.4 (2.5;7.8) | 3.9 (2.2;6.9) | 3.3 (1.7;6.5) | 2.6 (1.4;4.8) |
| GARFIELD stroke score, median (Q1;Q3)§ | 1.2 (0.9;1.8) | 1.1 (0.8-1.7) | 1.0 (0.7;1.6) | 0.9 (0.6;1.4) |
| GARFIELD bleeding score, median (Q1;Q3)|| | 1.5 (1.0;2.3) | 1.4 (0.9-2.0) | 1.3 (0.8;1.9) | 1.0 (0.6;1.5) |
BMI, body mass index; bpm, beats per minute; Q, quartile; TIA, transient ischemic attack.
Defined as peripheral artery disease and/or coronary artery disease.
The risk factor “labile international normalized ratios” is not included in the HAS-BLED score, as it is not collected at baseline. As a result, the maximum HAS-BLED score at baseline is 8 points (not 9).
The risk of mortality within 1 year.
The risk of nonhemorrhagic stroke/SE within 1 year.
The risk of major bleeding within 1 year.
VKA-treated patients who suffered a major bleeding tended to have a lower median time in therapeutic range (TTR) value (43.1 [interquartile range, 21.5-71.3]) than with CRNM (49.3 [23.5-73.1]) and minor bleeding (51.3 [26.2-72.3]). In NOAC-treated patients, the rate of recommended dosing tended to be lower in those who suffered major bleeding (66.4%) compared with CRNM bleeding (71.8%), minor bleeding (72.6%), and NOAC-treated patients who did not bleed (73%).
The risk profiles of patients prescribed VKA ± AP or NOAC ± AP were not significantly different as assessed with the common risk assessment tools (CHA2DS2-VASc and HAS-BLED). However, the GARFIELD-AF risk calculator showed a gradual increase in the risk of death, stroke/SE, and bleeding across the subgroups, from the no-bleed subgroup to the major bleeding subgroup. NOAC ± AP–treated patients tended to have more frequently a paroxysmal AF pattern (supplemental Table 1).
Sites, precipitants, and management of bleeding
Gastrointestinal bleeding and intracranial/intraspinal hemorrhage (ICH) were the most frequent bleeding and accounted for 40% and 24.8% of all major bleeds respectively; 249 cases and 154 cases; 0.51 (0.45 to 0.58) and 0.31 (0.27 to 0.37) per 100-patient-year respectively. The most frequent minor and CRNM bleeding sites were eyes, ears, nose, and skin related followed by gastrointestinal and genitourinary bleeds. Transfusion was necessary in 51% of cases of major bleeding (Table 2).
Sites, precipitants, and management of bleeding per bleeding types
| Major (n = 622) | CRNM (n = 524) | Minor (n = 1098) | Unknown (n = 86) | Total (n = 2330) | |
|---|---|---|---|---|---|
| Site of bleed, n (%) | |||||
| Eyes ears nose skin | 33 (5.3) | 192 (36.6) | 494 (45) | 30 (34.9) | 749 (32.1) |
| Gastrointestinal tract | 249 (40) | 112 (21.4) | 188 (17.1) | 21 (24.4) | 570 (24.5) |
| Genitourinary | 28 (4.5) | 116 (22.1) | 160 (14.6) | 11 (12.8) | 315 (13.5) |
| Thorax and lungs | 6 (1) | 18 (3.4) | 50 (4.6) | 3 (3.5) | 77 (3.3) |
| Intracranial/intraspinal | 154 (24.8) | 154 (6.6) | |||
| Other critical sites | 42 (6.8) | 42 (1.8) | |||
| Surgery or access | 8 (1.3) | 8 (1.5) | 15 (1.4) | 31 (5.6) | |
| Other | 77 (12.4) | 67 (12.8) | 171 (15.6) | 14 (16.3) | 329 (14.1) |
| Unknown | 25 (4) | 11 (2.1) | 20 (1.8) | 7 (8.1) | 63 (2.7) |
| Bleeding precipitant, n (%) | |||||
| Spontaneous | 337 (54.2) | 346 (66) | 687 (62.6) | 20 (23.3) | 1390 (59.6) |
| Trauma related (nonsurgical) | 68 (10.9) | 45 (8.6) | 93 (8.5) | 7 (8.1) | 213 (9.1) |
| Noncardiac surgery | 32 (5.1) | 30 (5.7) | 22 (2) | 1 (1.2) | 8 (0.3) |
| Cardiac surgery | 10 (1.6) | 2 (0.4) | 4 (0.4) | 16 (0.6) | |
| Unknown | 175 (28.1) | 101 (19.3) | 292 (26.6) | 58 (67.4) | 626 (26.8) |
| Intervention required for bleed, n (%) | |||||
| Surgical | 132 (21.2) | 58 (11.1) | 33 (3) | 3 (3.5) | 226 (9.6) |
| Medical | 352 (56.6) | 227 (43.3) | 205 (18.7) | 19 (22.1) | 803 (34.4) |
| None | 88 (14.1) | 233 (44.5) | 833 (75.9) | 38 (44.2) | 1192 (51.1) |
| Transfusion | |||||
| Yes | 317 (51) | 317 (13.6) | |||
| None | 226 (36.3) | 511 (97.5) | 1091 (99.4) | 66 (76.7) | 1894 (59.8) |
| Unknown | 79 (12.7) | 13 (2.5) | 7 (0.6) | 20 (23.3) | 119 (5.1) |
Bleeding rates and predictors of bleeding
The highest unadjusted rates of major bleeding were observed with the combination therapy of VKAs and AP agents (2.36 (1.94-2.87) and NOACs and AP agents (2.08 [1.57-2.76]) per 100 person-years (Figure 1; supplemental Table 2). The most potent predictors were age (HR, 1.23 [1.18-1.29] per 5-year increment), VKAs vs NOACs (HR, 1.38 [1.09-1.75]), combination therapy with an OAC plus AP agent (NOAC + AP vs NOAC: HR, 1.78 [1.26-2.51]; VKA + AP vs VKA: HR, 1.53 [1.20-1.95]), moderate to severe CKD (HR, 1.72 [1.41-2.10]), history of bleeding (HR, 2.38 [1.72-3.30]), baseline heart rate (HR, 1.02 [1.01-1.04] per 5-beat increment), and diabetes (HR, 1.26 [1.05-1.50]), and all were significant predictors of major bleeding. Asian ethnicity was an independent predictor of reduced risk of bleeding (HR, 0.77 [0.62-0.96]) (Table 3).
Predictors of major bleeding
| Description | χ2 | P | HR (95% CI)* |
|---|---|---|---|
| Age,y | 82.57 | <.0001 | 1.23 (1.18-1.29) |
| Comparisons of antithrombotic strategies | 62.25 | <.0001 | |
| AP vs NOAC | 0.71 (0.52-0.96) | ||
| NOAC + AP vs NOAC | 1.78 (1.26-2.51) | ||
| VKA vs NOAC | 1.38 (1.09-1.75) | ||
| VKA + AP vs VKA | 1.53 (1.20-1.95) | ||
| Moderate or severe CKD | 28.54 | <.0001 | 1.72 (1.41-2.10) |
| History of bleeding | 27.22 | <.0001 | 2.38 (1.72-3.30) |
| Pulse (per 5 bpm) | 9.17 | .003 | 1.02 (1.01-1.04) |
| Diabetes | 6.43 | .011 | 1.26 (1.05-1.50) |
| Asian vs not Asian | 5.66 | .018 | 0.77 (0.62-0.96) |
| Height per 5 (cm) | 5.27 | .022 | 0.95 (0.91-0.99) |
| Carotid occlusive disease | 3.88 | .049 | 1.41 (1.00-1.98) |
| Vascular disease | 3.49 | .061 | 1.19 (0.99-1.43) |
CI, confidence interval.
Adjusted for country of enrolment, cohort of enrolment, sex, age, race/ethnicity, type of AF, care setting, specialty, heart failure, acute coronary syndromes, vascular disease, carotid occlusive disease, prior stroke/TIA/SE, prior bleeding, VTE, hypertension, hypercholesterolemia, diabetes, cirrhosis, moderate to severe CKD, dementia, hyperthyroidism, hypothyroidism, current smoking, heavy alcohol consumption, BMI, heart rate, baseline systolic and diastolic blood pressure, baseline AP use.
Death rates
In patients in whom bleeding was classified, all-cause death occurred in 253 (11%) patients. Of those with a bleed, 163 out of 622 (26.2%) died after major bleeding, 35 out of 524 (6.7%) died after CRNM bleeding, and 56 out of 1098 (5.1%) died after minor bleeding. Most deaths occurred within the first 30 days. Seventy-eight patients (31%) died within the first day, 114 (45%) within 30 days, and 140 (55%) after 30 days, explaining the initial abrupt decrease in the event-free survival curve after major bleeding. The landmark analysis showed that after 30 days, the survival curve for major bleeding continued to diverge from the survival curves of minor and CRNM bleeding (Figure 2). Most of these early deaths occurred after major bleeding (103/114), most frequently after ICH (46 in 103 deaths within 30 days of major bleeding).
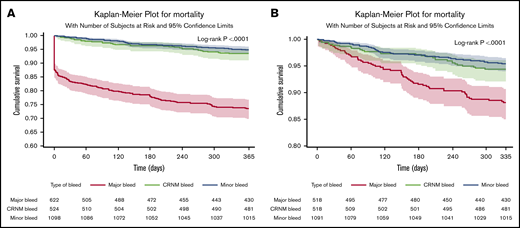
Survival curves after bleeding. (A) Survival curves after minor, clinically relevant nonmajor and major bleeding at 1 year (where bleed type is defined by the worst bleed type). (B) Landmark analysis from day 30 until a year from bleed.
Survival curves after bleeding. (A) Survival curves after minor, clinically relevant nonmajor and major bleeding at 1 year (where bleed type is defined by the worst bleed type). (B) Landmark analysis from day 30 until a year from bleed.
The rates of all-cause mortality per 100 patient-years were 4.00 (3.82-4.17) in no bleeding, 5.3 (4.1-6.9) in minor bleeding, 7.0 (5.0-9.8) in CRNM bleeding, and 34.4 (29.5 to 40.1) in major bleeding. After adjustment on a large variety of variables, the HR of all-cause mortality was higher in all 3 categories of bleeding compared with no-bleeding patients, respectively (aHR, 1.53 [1.07-2.19], 2.59 [1.80-3.73], and 8.24 [6.76-10.04] for minor, CRNM, and major bleeding) (Figure 3).
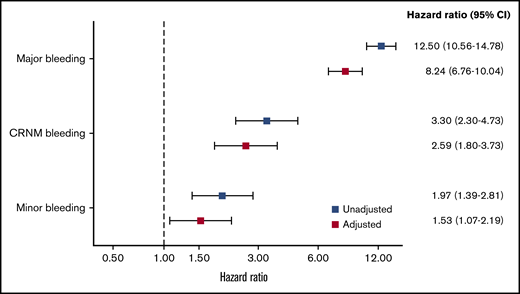
HRs for the risk of all-cause mortality according to type of bleeding. Adjusted for factors previously derived for all-cause mortality in the GARFIELD-AF study (age, treatment, CHF, BMI, sex, race, type of AF, current smoker, heavy alcohol use, diabetic, moderate to severe CKD, hypertension, history of bleeding, vascular disease, prior stroke/SE, or TIA). Bleed type was set as a time-dependent covariate.
HRs for the risk of all-cause mortality according to type of bleeding. Adjusted for factors previously derived for all-cause mortality in the GARFIELD-AF study (age, treatment, CHF, BMI, sex, race, type of AF, current smoker, heavy alcohol use, diabetic, moderate to severe CKD, hypertension, history of bleeding, vascular disease, prior stroke/SE, or TIA). Bleed type was set as a time-dependent covariate.
The death rates after major bleeding occurring under NOACs or VKAs were not significantly different (NOAC ± AP, 29.2 [21.3-40.1] vs VKA ± AP, 34.3 [27.6-42.7]) per 100 person-years (P = .483). The rates of all-cause death and cardiovascular death were 2.4-fold and 5.3-fold higher, respectively, after intracranial compared with extracranial hemorrhage (supplemental Table 3).
Causes of death
In patients who died after a bleed, the cause of death was cardiovascular in 99 patients (39%), mostly from ICH (53; 20.9%) and less often from heart failure (15; 5.9%), sudden death (10; 3.9%), or ischemic stroke (9; 3.5%). The cause was noncardiovascular in 113 patients (44.5%) and included cancer (30; 11.8%), respiratory failure (23; 9.1%), infection/sepsis (14; 5.5%), renal failure (6; 2.4%), or miscellaneous (40; 15.7%). The cause of death was undetermined in 42 patients (16.5%) (Table 4).
Causes of death after bleeding
| All-cause mortality | Major | CRNM | Minor | Total |
|---|---|---|---|---|
| Cardiovascular, n (%) | ||||
| Myocardial infarction | 4 (1.6) | 1 (0.4) | 0 (0) | 5 (2.0) |
| Intracranial hemorrhage | 53 (20.9) | 53 (20.9) | ||
| Ischemic stroke | 4 (1.6) | 3 (1.2) | 2 (0.8) | 9 (3.5) |
| CHF | 5 (2.0) | 3 (1.2) | 7 (2.7) | 15 (5.9) |
| Sudden death | 3 (1.2) | 3 (1.2) | 4 (1.6) | 10 (3.9) |
| Miscellaneous | 4 (1.6) | 1 (0.4) | 2 (0.8) | 7 (2.7) |
| Total cardiovascular | 70 (27.5) | 13 (5.1) | 16 (6.3) | 99 (38.9) |
| Noncardiovascular, n (%) | ||||
| Respiratory failure | 12 (4.7) | 5 (2.0) | 6 (2.4) | 23 (9.0) |
| Malignancy | 13 (5.1) | 8 (3.1) | 9 (3.5) | 30 (11.8) |
| Renal | 2 (0.8) | 1 (0.4) | 3 (1.2) | 6 (2.4) |
| Infection/sepsis | 7 (2.7) | 3 (1.2) | 4 (1.6) | 14 (5.5) |
| Miscellaneous | 36 (14.2) | 1 (0.4) | 3 (1.2) | 40 (15.7) |
| Total noncardiovascular | 70 (27.5) | 18 (7.1) | 25 (9.8) | 113 (44.5) |
| Unknown | 23 (9.0) | 3 (1.2) | 16 (6.3) | 42 (16.5) |
| Total | 163 (64.2) | 34 (13.4) | 57 (22.4) | 254 |
Comparative effectiveness analysis
This analysis was run on a subset of 19 640 patients from cohorts 3 to 5 (when NOACs were available) without OAC treatment prior to enrolment who received at baseline either NOACs (9870; 50.3%) or VKAs (9770; 49.7%). The rates of any-event, all-cause death and all bleeding types were lower in NOAC-treated patients than in VKA-treated patients (Tables 5 and 6).
Event rates per 100 person-years through 1 year for NOAC ± AP and VKA ± AP
| Type of event | Event rates | |||
|---|---|---|---|---|
| NOAC ± AP | VKA ± AP | |||
| Events | Rate (95% CI) | Events | Rate (95% CI) | |
| All-cause mortality | 354 | 3.67 (3.31-4.08) | 518 | 5.51 (5.05-6.00) |
| Any bleed* | 495 | 5.28 (4.84-5.77) | 567 | 6.23 (5.74-6.76) |
| Major bleed | 127 | 1.33 (1.11-1.58) | 177 | 1.90 (1.64-2.20) |
| CRNM bleed | 117 | 1.22 (1.02-1.47) | 121 | 1.30 (1.08-1.55) |
| Minor | 235 | 2.47 (2.18-2.81) | 258 | 2.79 (2.47-3.15) |
| ICH | 27 | 0.28 (0.19-0.41) | 39 | 0.41 (0.30-0.57) |
Includes bleeds of unknown types.
Unadjusted and adjusted hazard ratio for NOAC + AP and VKA + AP (reference group)
| Type of event | Unadjusted HR (95% CI) | P | aHR* (95% CI) | P |
|---|---|---|---|---|
| All-cause mortality | 0.67 (0.58-0.77) | <.0001 | 0.73 (0.62-0.85) | <.0001 |
| Any bleed | 0.85 (0.75-0.96) | .008 | 0.85 (0.73-0.98) | .024 |
| Major bleed | 0.70 (0.56-0.88) | .002 | 0.79 (0.60-1.04) | .090 |
| CRNM bleed | 0.95 (0.73-1.22) | .670 | 0.88 (0.65-1.19) | .392 |
| Minor | 0.89 (0.75-1.06) | .192 | 0.88 (0.71-1.09) | .231 |
| ICH | 0.67 (0.41-1.11) | .119 | 0.78 (0.42-1.43) | .417 |
Adjusted for country of enrolment, cohort of enrolment, sex, age, race/ethnicity, type of AF, care setting, specialty, heart failure, acute coronary syndromes, vascular disease, carotid occlusive disease, prior stroke/TIA/SE, prior bleeding, VTE, hypertension, hypercholesterolemia, diabetes, cirrhosis, moderate to severe CKD, dementia, hyperthyroidism, hypothyroidism, current smoking, heavy alcohol consumption, BMI, heart rate, baseline systolic and diastolic blood pressure, baseline AP use.
The HR for any bleeding was significantly lower with NOAC ± AP than VKA ± AP (aHR, 0.85 [0.73-0.98]) and substantially (although not significantly) lower for major bleeding (aHR, 0.79 [0.60-1.04]). The HR for ICH (aHR, 0.78 [0.42-1.43]) was in the same range as for major bleeding but with a low statistical power due to a low rate of events. The risk of death to was significantly lower with NOAC ± AP than with VKA ± AP (aHR, 0.73 [0.62-0.85]) (Tables 5 and 6).
Discussion
We found that NOAC use, either alone or combined with AP agents, was associated with a lower risk of any bleeding or major bleeding compared with VKAs, used either alone or combined with AP agents. The risk of ICH was also reduced with NOACs use to than same extent as major bleeding, though the reduction was non-significant. Use of VKAs rather than NOACs was among the strongest independent predictor of major bleeding and any bleeding, along with age, history of bleeding, moderate to severe CKD, as well as combination therapy with OACs and AP agents, which is still widely used in this population (7350 patients [14%]). Asian ethnicity was a predictor of a reduced risk of bleeding. Higher risks of bleeding and ICH in Asians compared with non-Asians were reported mostly in ancillary analyses of RCTs testing NOACs vs VKAs.24-27 This discrepancy is related to the different nature of RCTs and registry populations. Our earlier reports showed that Asians had a lower baseline risk profile, with younger age and lower rates of comorbidities compared with non-Asians.28 In addition, AP agents and VKAs remain widely prescribed in several Asian countries in whom target international normalized ratio in VKA-treated patients is lower than in non-Asian countries. This results in a lower risk of bleeding compared with non-Asian patients, yet with no excess risk of stroke/SE.29-31
Previous reports derived from RCTs, retrospective population-based registries, health care databases, or prospective registries deliver a common message, though with some degree of heterogeneity across reports. Meta-analyses of RCTs show that NOAC use is associated with a lower risk of stroke/SE, ICH, and death than VKA use,16,32,33 with some heterogeneity across NOACs.33 The message about major bleeding is less consistent. A lower risk of major bleeding was reported in Hicks meta-analysis that included phase 2 trials data in addition to all phase 3 RCTs,32 but neither in Ruff meta-analysis16 nor in Tereshchenko network meta-analysis.33 A lower risk of ICH was reported in Ruff and Hicks meta-analyses.16,32 In Tereshchenko meta-analysis, ICH was a component of the definition of major bleeding.33
In retrospective analyses of population-based or health care databases, heterogeneity was also found across NOAC subtypes in regard to risks of major bleeding and ICH. Major bleeding risk was found reduced in 2 analyses34,35 and ICH in 3.34-36 All 3 studies tended to show that apixaban and dabigatran had a more favorable efficacy/safety risk profile than other OACs. In the ORBIT-AF 2 registry, the risk of major bleeding and ICH rates was not significantly different between NOACs and VKAs use.37
These differences may be inherent to the varied populations analyzed in these reports. Baseline characteristics differ in RCTs compared with cohort studies and prospective registries. The quality of retrospective analyses depends on the completeness of data collection. In addition, the outcomes are affected by the impact of recall bias and survivorship bias.38 In addition, differences in code schemas used to assess rates and severity of bleeding may result in marked differences, even from analyses of the same database.39 Prospective registries provide a more robust model for collecting data and outcomes. The prospective nature of GARFIELD-AF registry as well as the use of the same bleeding scale (International Society on Thrombosis and Haemostasis) as in RCTs may explain the differences between our study and previous analyses.
The second important finding of this study is the confirmation that NOAC use either alone or combined with AP agents was associated with a significantly lower risk of all-cause mortality. A reduced risk of death was reported with NOACs compared with VKAs in meta-analyses of RCTs,16,32 although the reduction of mortality was not significant in some phase 3 trials.15,40 A reduced risk of death associated with NOAC use compared with VKA use was inconsistently reported in population-based analyses.33,36 In our study, the substantially lower risk of major bleeding with NOAC use was most likely the main driver of the reduction in the risk of all-cause death, as the rate of death after major bleeding was similar, irrespective of the OAC in use, at the time of bleeding. The lower risk of death in NOAC-treated patients cannot be explained by different baseline characteristics and risk profiles for death and bleeding between NOAC-treated and VKA-treated subgroups, as they were similar in both subgroups.
One-third of all deaths in those who had a bleed (78 patients) occurred the same day as the bleeding, and almost half of all deaths occurred within the first 30 days, explaining the early abrupt decrease in the event-free survival curve. Most of these early deaths occurred after ICH, which had a much worse prognosis than extracranial major bleeding. ICH accounted for 20% of all deaths at 1 year. Major bleeding was associated with the highest risk of death, but CRNM and minor bleeding carried a higher risk of death than no bleeding. After CRNM and minor bleeding, death was rarely related to bleeding complications but mostly driven by comorbidities, either cardiovascular (acute coronary syndrome/myocardial infarction, congestive heart failure [CHF], and sudden death) or noncardiovascular (respiratory failure, malignancy, or sepsis). In these patients, bleeding episodes may be considered as markers rather than the root cause of the higher risk of death.
Strengths and limitations
This report is based on prospective data collected worldwide that are representative of real-world practice. Our data are robust, as per protocol, 20% of all eCRFs were monitored against source documentation.
Our study did not assess efficacy/safety profile of the different NOAC subtypes; the steering committee made a decision at the beginning of the registry not to pursue this question when an RCT had not been first performed.
We cannot provide detailed information about postbleeding management. Data on noncardiovascular medications (such as proton pump inhibitors) were not collected. The severity of bleeding and cause of death were not independently adjudicated.
Clinical implications
Major bleeding is potentially catastrophic and is associated with an increased risk of death. Our findings should encourage clinicians to favor NOACs over VKAs whenever possible. Careful assessment of the risk of bleeding should be carried out before introduction of OACs, considering the baseline characteristics of patients and the information provided by bleeding risk assessment tools. Combination therapy with OACs plus AP agents should be avoided when possible, because AP agents are associated with higher risks of bleeding and ischemic events.3,41 Biological features that increase bleeding risk, such as low hemoglobin levels or platelet counts,42,43 and noncardiovascular concurrent medications that increase bleeding risk should be noted.44 As the risk of death is also driven by comorbidities and not only by bleeding, we advocate comprehensive management, targeting modifiable risk factors such as heart failure, vascular disease, diabetes, hypertension, and CKD. Minor and CRNM bleeding should not be considered benign events, as both are associated with a higher risk of death than no bleeding.
Conclusions
In patients with AF, use of NOACs rather than VKAs is associated with lower risks of all-cause death, all bleeding categories, and major bleeding. Half of all deaths after major bleeding occurred within the first month (one-third within the first day), predominantly from intracranial hemorrhage. Major bleeding was associated with the highest risk of death, and CRNM and minor bleeding were associated with a higher risk of death than no-bleeding patients. Underlying comorbidities that also affect the risk of death warrant comprehensive medical management of AF.
The data underlying this article will be shared by Karen S. Pieper (kpieper@tri-london.ac.uk) on reasonable request.
Acknowledgments
The authors thank the physicians, nurses, and patients involved in the GARFIELD-AF registry. Programming support was provided by Madhusudana Rao (TRI, London, United Kingdom). Editorial support was provided by Surekha Damineni (TRI).
The GARFIELD-AF registry is sponsored by the Thrombosis Research Institute, London, United Kingdom, and is supported by an unrestricted research grant from Bayer AG, Berlin, Germany. The work is supported by the Kantor Charitable Foundation for the Kantor-Kakkar Global Centre for Thrombosis Science.
Authorship
Contributions: J.-P.B., F.W.A.V., A.J.C., K.A.A.F., S.Z.G., S.G., S.H., W.H., F.M., A.G.G.T., M.v.E., and A.K.K. contributed to the study design; S.V. and K.S.P. analyzed the data; and all authors supervised the data analysis, provided the interpretation of results, contributed to the drafting and critical review of the manuscript, and approved the final draft.
Conflict-of-interest disclosure: F.W.A.V. has received grants from Bayer Healthcare and personal fees from Bayer Healthcare, BMS/Pfizer, Daiichi-Sankyo, and Boehringer-Ingelheim. A.J.C. has received institutional grants and personal fees from Bayer, Boehringer-Ingelheim, Pfizer/BMS, and Daiichi-Sankyo. F.C. reports minor speaking and consultancy fees from Boehringer-Ingelheim, Bayer, Daiichi-Sankyo, BMS, and Pfizer outside the submitted work. K.A.A.F. reports grants and personal fees from Bayer/Janssen AstraZeneca and personal fees from Sanofi/Regeneron outside the submitted work. S.Z.G. has received research support from BiO2 Medical, Boehringer-Ingelheim, BMS, Boston Scientific, Daiichi, Janssen, National Heart, Lung, and Blood Institute, and the Thrombosis Research Institute and has served as a consultant for Agile, Bayer, Boehringer-Ingelheim, BMS, Daiichi, Janssen, Portola, and Zafgen. S.G. has received personal fees from the Thrombosis Research Institute, Harvard University, and the American Heart Association and grants from the Vehicle Racing Commemorative Foundation, Nakatani Foundation for Advancement of Measuring Technologies in Biomedical Engineering, Bristol-Myers Squibb, Sanofi, Ono, and Pfizer. S.H. has received personal fees from Aspen, Bayer Healthcare, BMS/Pfizer, Daiichi-Sankyo, and Sanofi. F.M. is an employee of Bayer AG. K.S.P. reports personal fees from the Thrombosis Research Institute during the conduct of the study. A.G.G.T. has received personal fees from Bayer Healthcare, Janssen Pharmaceutical Research & Development, Astellas, and Portola. A.K.K. has received grants from Bayer AG and Sanofi and personal fees from Bayer AG, Janssen, Pfizer, Sanofi, Verseon, and Anthos Therapeutics. The remaining authors declare no competing financial interests.
A complete list of the GARFIELD-AF Investigators appears in the supplemental appendix.
Correspondence: Jean-Pierre Bassand, Department of Cardiology, EA3920, University Hospital Jean Minjoz, Boulevard Fleming, 25000 Besançon, France; e-mail: jpbassand@tri-london.ac.uk

