

Key Points
CIBERSORTx analytical approach reveals M0, M2, and eosinophil fractions in the BM to be the most relevant prognostic factors in patients with MDS.
High-risk immune cell scores correlate with NF-κB signaling, oxidative stress, and leukemic stem cell signature pathways.

Abstract
Aside from cell intrinsic factors such as genetic alterations, immune dysregulation in the bone marrow (BM) microenvironment plays a role in the development and progression of myelodysplastic syndromes (MDS). However, the prognostic implications of various immune cells in patients with MDS remain unclear. We adopted CIBERSORTx to estimate the relative fractions of 22 subtypes of immune cells in the BM of 316 patients with MDS and correlated the results with clinical outcomes. A lower fraction of unpolarized M0 macrophages and higher fractions of M2 macrophages and eosinophils were significantly associated with inferior survival. An immune cell scoring system (ICSS) was constructed based on the proportion of these 3 immune cells in the BM. The ICSS high-risk patients had higher BM blast counts, higher frequencies of poor-risk cytogenetics, and more NPM1, TP53, and WT1 mutations than intermediate- and low-risk patients. The ICSS could stratify patients with MDS into 3 risk groups with distinct leukemia-free survival and overall survival among the total cohort and in the subgroups of patients with lower and higher disease risk based on the revised International Prognostic Scoring System (IPSS-R). The prognostic significance of ICSS was also validated in another independent cohort. Multivariable analysis revealed that ICSS independently predicted prognosis, regardless of age, IPSS-R, and mutation status. Bioinformatic analysis demonstrated a significant correlation between high-risk ICSS and nuclear factor κB signaling, oxidative stress, and leukemic stem cell signature pathways. Further studies investigating the mechanistic insight into the crosstalk between stem cells and immune cells are warranted.
Introduction
Myelodysplastic syndromes (MDSs) are hematopoietic stem cell (HSC) disorders characterized by dysplasia of hematopoietic cells, ineffective hematopoiesis, and genetic alterations.1 Clinical and molecular heterogeneities make these diseases arduous to model and study, underscoring the importance of individualized management.2,3 The International Prognostic Scoring System (IPSS) and the revised IPSS (IPSS-R) have been widely used to risk-stratify patients with MDS and guide treatment choice.4,5 Nevertheless, the prognosis of patients may greatly vary, even within the same risk groups.6 Therefore, it is imperative to identify novel prognostic markers for better risk classification of patients with MDS.
The bone marrow (BM) microenvironment, immune cells, and relevant inflammatory pathways were recently shown to play important roles in the pathogenesis of MDS.7,8 For instance, the activation of Toll-like receptor (TLR) tumor necrosis factor receptor-associated factor 6 (TRAF6) signaling by chronic inflammation in MDS fortifies the competitive advantage of MDS hematopoietic stem and progenitor cells,9 and the proliferation of myeloid-derived suppressor cells suppresses antitumor responses and thus enhances the expansion of malignant clones.10,11 However, studies exploring the prognostic relevance of immune cells in BM have been hindered by the methodological barricade, limited identifiable immune cell subtypes, and modest sample sizes.
Newman et al recently developed a computational method, CIBERSORT (Cell type Identification By Estimating Relative Subsets Of known RNA Transcripts), and its next generation, CIBERSORTx, to profile the landscape of infiltrating immune cells in the tumor microenvironment based on gene expression data. It has been shown to outperform other methods in estimating the relative proportion of closely related cell types in bulk tumors without physical cell sorting.12,13 Although the use of CIBERSORT and CIBERSORTx has been validated in multiple tumor types,14-17 their applicability in hematological malignancies remains scarce. A study demonstrated higher fraction of M2 macrophage as a predictor of inferior event-free survival (EFS) and overall survival (OS) in patients with acute myeloid leukemia (AML) and identified the macrophage marker CD206 as a novel prognostic indicator in these patients.18
The present study applied CIBERSORTx to evaluate the relative percentages of immune cells in the BM of 316 patients with primary MDS who had adequate cryopreserved cells for RNA sequencing. We found that patients with a lower percentage of unpolarized macrophages (M0) but higher infiltration of macrophages M2 and eosinophils in the BM had adverse prognoses. An immune cell scoring system (ICSS) was constructed that was found to be closely associated with clinical characteristics and mutation patterns and could predict prognosis independently from established risk stratification systems and gene mutation statuses. The scoring system provides a novel complementary prognostication to refine risk stratification and potential guidance for future therapeutic approaches in patients with MDS.
Methods
Patients
We recruited 316 patients with primary MDS diagnosed at the National Taiwan University Hospital (NTUH) from January 1997 to December 2019 who had adequate cryopreserved BM samples for RNA sequencing. The diagnosis was based on the 2016 World Health Organization (WHO) classification.19 Patients with antecedent chemotherapy or hematologic malignancies were excluded from this study to ensure a more homogeneous cohort because the immune environment may be different between primary and therapy-related MDS (t-MDS). For external validation, we collected publicly annotated microarray data from GSE15061, in which gene expression and survival data of 132 patients with MDS were available.20 The Research Ethics Committee of NTUH approved this study (approval number: 201709072RINC), and informed consent was provided according to the Declaration of Helsinki.
Cytogenetic study and molecular mutation analysis by targeted next-generation sequencing
Cytogenetic analyses were performed as previously described and interpreted according to the International System for Human Cytogenetic Nomenclature.21 We used the TruSight myeloid sequencing panel and the HiSeq platform to analyze gene alterations and mutant allele burden of 54 myeloid-neoplasm relevant genes (supplemental Table 1) as previously described22 on BM samples from 302 patients with MDS. Library preparation and sequencing were performed according to the manufacturer’s instructions. The Catalog of Somatic Mutations in Cancer database version 86,23 ClinVar,24 dbSNP database version 151,25 PolyPhen-2 (Polymorphism Phenotyping version 2),26 and SIFT27 were used to evaluate the results of each variant.
Library preparation and RNA sequencing
The purified RNA was used to prepare the sequencing library using the TruSeq Stranded mRNA Library Prep Kit (Illumina, San Diego, CA) following the manufacturer’s recommendations. Briefly, mRNA was purified from total RNA (1 μg) using oligo(dT)-coupled magnetic beads and fragmented into small pieces at elevated temperatures. First-strand cDNA was synthesized using reverse transcriptase and random primers. After the generation of double-strand cDNA and adenylation on the 3′ ends of DNA fragments, the adaptors were ligated and purified with the AMPure XP system (Beckman Coulter, Beverly, MA). The quality of the libraries was assessed using an Agilent Bioanalyzer 2100 system and a real-time polymerase chain reaction system. The qualified libraries were then sequenced on an Illumina NovaSeq 6000 platform with 150-bp paired-end reads generated by Genomics, BioSci & Tech Co. (New Taipei City, Taiwan). The bases with low quality and sequences from adapters in the raw data were removed using Cutadapt (version 3.0). The qualified reads were aligned to the reference genome GRCh38 using STAR (version 2.7.6a), and read counts of each gene based on GENCODE (version 28) were calculated using featureCounts (version 2.0.1). Gene expression levels were normalized to metric transcripts per million.
Estimation of immune cell fractions
We used the CIBERSORTx, which was developed to quantify the relative fractions of distinct cell types within a complex gene expression admixture and has been widely adopted across various diseases, to estimate the relative cell fractions of 22 subtypes of immune cells that are actively involved in innate and adaptive immunity (supplemental Table 2). Normalized gene expression data were inputted to the CIBERSORTx Web site, with the data matrices prepared according to the reference expression signature containing 547 genes.
Bioinformatic analysis
The normalized signals for RNA sequencing data were analyzed using the preranked gene set enrichment analysis (GSEA) implemented in the R package clusterProfiler, with gene sets downloaded from the Molecular Signature Database. Analysis of differential expression (DE) of genes was performed using the Wilcoxon rank-sum test, and the false discovery rate method was applied for global gene analysis.28 The genes were ranked based on the log2 fold change in DE analysis.
Statistical analysis
We used the Mann-Whitney U and Kruskal–Wallis tests to compare medians and continuous variables of distribution. Fisher’s exact test or χ2 test was performed to examine differences among discrete variables. Pearson's correlation was used to calculate the correlation between estimated cell fractions and gene expression levels where relevant. Leukemia-free survival (LFS) was defined as the duration from the date of diagnosis to the date of the last follow-up, documented acute leukemia transformation, or death from any cause, whichever occurred first. OS was defined as the duration from diagnosis to the date of the last follow-up or death from any cause, whichever came first. We plotted the survival curves using Kaplan-Meier analysis and calculated the statistical significance using the log-rank test. The Cox proportional hazard model was used for univariate and multivariate analyses. Statistical significance was set at P < .05. All statistical analyses were conducted using IBM SPSS Statistics 23 for Windows and R software (version 4.0.3).
Results
Patient characteristics
Patient characteristics are summarized in Table 1. The median age of the 316 patients with MDS was 68.5 years. Among the 307 patients who had cytogenetic data at diagnosis, 25.4%, 24.4%, 22.5%, 24.1%, and 3.6% had IPSS-R very-high-risk, high-risk, intermediate-risk, low-risk, and very-low-risk MDS, respectively. In total, 51.3% of patients received supportive care only, and 154 received active treatment, including hypomethylating agents (HMAs) (115 patients; 36.4%), low-dose cytarabine (30 patients; 9.5%), and AML-directed intensive chemotherapy (28 patients; 8.9%) at the time of leukemic transformation or as a bridge to hematopoietic stem cell transplantation (HSCT). In total, 47 (14.9%) patients underwent allogeneic HSCT. During a median follow-up duration of 32.5 months (range, 0.2-165.4 months), 140 patients succumbed to the disease and 83 progressed to AML.
Comparison of clinical and laboratory features among three risk groups based on the immune cell scoring system
| Clinical characters | Total (N = 316) | Low risk (n = 182) | Intermediate risk (n = 111) | High risk (n = 23) | P value |
|---|---|---|---|---|---|
| Sex | .784 | ||||
| Female | 113 (35.8) | 67 (36.8) | 37 (33.3) | 9 (39.1) | |
| Male | 203 (64.2) | 115 (63.2) | 74 (66.7) | 14 (60.9) | |
| Age* | 68.5 (18-94) | 68.1 (22-94) | 69.3 (18-93) | 65.8 (20-85) | .228 |
| Laboratory data* | |||||
| WBC, × 109/L | 3.7 (0.5-54.4) | 3.8 (0.5-52.6) | 3.8 (0.8-54.4) | 3.0 (0.8-15.8) | .317 |
| ANC, × 109/L | 1.71 (0.1-37.1) | 2.0 (0.1-37.1) | 1.5 (0.1-32.3) | 0.9 (0.1-7.2) | .094 |
| Hb, g/dL | 8.4 (4-17) | 8.3 (4-17) | 8.4 (4-15) | 8.5 (6-12) | .662 |
| Platelet, × 109/L | 82 (1-721) | 79 (3-417) | 87 (1-721) | 68 (2-230) | .305 |
| BM blast (%) | 6 (0-19) | 3.8 (0-16) | 9.0 (0.4-18) | 10 (0-19) | <.001 |
| PB blast (%) | 0 (0-18) | 0 (0-16) | 1 (0-16) | 1 (0-18) | <.001 |
| 2016 WHO classification | |||||
| MDS-SLD | 32 (10.1) | 26 (14.3) | 6 (5.4) | 0 (0) | .012 |
| MDS-MLD | 49 (15.5) | 31 (17.0) | 15 (13.5) | 3 (13.0) | .682 |
| MDS-RS | 25 (7.9) | 17 (9.3) | 7 (6.3) | 1 (4.3) | .521 |
| MDS-RS-MLD | 24 (7.6) | 20 (11) | 4 (3.6) | 0 (0) | .025 |
| MDS-U | 5 (1.6) | 4 (2.2) | 1 (0.9) | 0 (0) | .565 |
| MDS-EB1 | 73 (23.1) | 39 (21.4) | 26 (23.4) | 8 (34.8) | .357 |
| MDS-EB2 | 108 (34.2) | 45 (24.7) | 52 (46.8) | 11 (47.8) | <.001 |
| IPSS-R†,‡ | |||||
| Very low | 11 (3.6) | 10 (5.7) | 1 (0.9) | 0 (0) | .064 |
| Low | 74 (24.1) | 50 (28.7) | 22 (19.8) | 2 (9.1) | .053 |
| Intermediate | 69 (22.5) | 42 (24.1) | 22 (19.8) | 5 (22.7) | .696 |
| High | 75 (24.4) | 40 (23.0) | 32 (28.8) | 3 (13.6) | .253 |
| Very high | 78 (25.4) | 32 (18.4) | 34 (30.6) | 12 (54.5) | <.001 |
| Treatment | |||||
| Supportive care | 162 (51.3) | 108 (59.3) | 45 (40.5) | 9 (39.1) | .004 |
| Active treatment§ | |||||
| HMA | 115 (36.4) | 56 (30.8) | 49 (44.1) | 10 (43.5) | .053 |
| LDAraC¶ | 30 (9.5) | 12 (6.6) | 14 (12.6) | 4 (17.4) | .095 |
| Intensive chemotherapy | 28 (8.9) | 13 (7.1) | 13 (11.7) | 2 (8.7) | .410 |
| HSCT | 47 (14.9) | 26 (14.3) | 15 (13.5) | 6 (26.1) | .287 |
P values of <.05 are statistically significant.
ANC, absolute neutrophil count; Hb, hemoglobin; LDAraC: low-dose cytarabine; MDS-EB, MDS with excess blasts; MDS-MLD, MDS with multilineage dysplasia; MDS-RS, MDS with ring sideroblasts; MDS-SLD, MDS with single lineage dysplasia; MDS-RS-SLD, MDS with ring sideroblasts and single lineage dysplasia; MDS-RS-MLD, MDS with ring sideroblasts and multilineage dysplasia; MDS-U, MDS, unclassifiable.
Median (range).
307 patients had chromosome data at diagnosis.
IPSS-R: very low, ≤1.5; low, >1.5 to 3; intermediate (INT), >3 to 4.5; high, >4.5 to 6; very high, >6.
Active treatment includes HMA, LDAraC, high-intensity chemotherapy, and HSCT. Some patients received more than 1 treatment modality: 15 received HMA and LDAraC; 8 received HMA and high-intensity chemotherapy; 6 received LDAraC and high-intensity chemotherapy; 1 received LDAraC and HSCT; 2 received high-intensity chemotherapy and HSCT; 28 received HMA and HSCT; 3 received HMA, high-intensity chemotherapy, and HSCT; and 13 received HSCT without bridging therapy.
Low-dose cytarabine at 20 mg once or twice daily for 10 consecutive days every 4 to 6 weeks.
Prognostic implication of immune cell subtypes and construction of an ICSS
We performed univariate Cox regression analysis to examine the prognostic impact of the 22 immune cell subtypes on the OS of patients with MDS. The hazard ratios (HRs) with lower and upper 95% confidence intervals of each immune cell are shown in supplemental Table 2. Higher percentage of M0 macrophages significantly correlated with better survival (HR: 0.962, P < .001), whereas higher fractions of M2 macrophages and eosinophils were associated with poorer survival (HR: 1.071, P = .012; and HR: 1.048, P = .009, respectively).
We divided the 316 patients into lower and higher groups for M0, M2, and eosinophils based on the median relative value of each cell subtype. Patients received 1 point each if they had lower M0, higher M2, or higher eosinophil counts. The immune cell score (from 0-3) of a patient corresponded to the sum of the points obtained from each of the 3 cell populations. The patients were divided into 4 groups with different scores. Seventy patients had a score of 0, 112 had a score of 1, 111 had a score of 2, and 23 had a score of 3. We further explored the prognostic impact of this categorization. The OS was significantly shorter for patients with a score of 3 than for those with a score of 2 (HR: 2.082, P = .007), and both groups had worse survival as compared with the patients with a score of 0 (score 2 group vs score 0 group: HR: 1.964, P = .007; and score 3 group vs score 0 group: HR: 4.062, P < .001; supplemental Table 3) or score 1 (score 2 group vs score 1 group: HR: 1.707, P = .009; and score 3 group vs score 1 group: HR: 3.578, P < .001). Patients with a score of 1 had no difference in OS from those with a score of 0 (HR: 1.161, P = .572). Accordingly, an ICSS was constructed, and patients were stratified into 3 groups as follows: score of 0 or 1, low-risk group; score 2, intermediate-risk group; and score 3, high-risk group.
Comparison of clinical characteristics and genetic alterations among different ICSS risk groups
The comparison of clinical and laboratory features among the different risk groups is shown in Table 1. The ICSS low-risk group had lower blast percentages in the BM (P < .001) and peripheral blood (P < .001) at diagnosis than the ICSS intermediate- and high-risk groups. No significant differences were observed in the distribution of sex, age, hemoglobin levels, white blood cell counts, and platelet counts among the 3 groups. Patients from the ICSS low-risk group had less MDS with excess blasts-2 (MDS-EB2) according to the 2016 WHO classification (24.7% vs 46.8% vs 47.8%, P < .001) but more MDS with single lineage dysplasia and MDS with ring sideroblasts and multilineage dysplasia (MDS-RS-MLD) than patients from the ICSS intermediate- and high-risk groups (14.3% vs 5.4% vs 0%, P = .012; and 11% vs 3.6% vs 0%, P = .025, respectively). The ICSS low-risk patients had the lowest frequency of IPSS-R very-high-risk MDS (18.4% vs 30.6% vs 54.5% for low-risk, intermediate-risk, and high-risk group, respectively; P < .001) but the highest frequency of low- and very-low-risk MDS (5.7% vs 0.9% vs 0%, P = .064; and 28.7% vs 19.8% vs 9.1%, P = .053, respectively). The distribution of cytogenetic abnormalities was generally similar among the 3 groups (supplemental Table 4), except that there were fewer poor-risk karyotypes (9.8% vs 20.7% vs 22.7% for low-risk, intermediate-risk, and high-risk group, respectively; P = .021) in the ICSS low-risk patients.
Considering molecular gene alterations, 230 (76.2%) of the 302 patients had at least 1 mutation in the 54 genes analyzed. As listed in supplemental Table 5, the most common mutation was ASXL1 mutation (22.5%), followed by RUNX1 (17.2%), TET2 (14.6%), SF3B1 (13.9%), and TP53 (12.9%) mutations. ICSS low risk was closely associated with SF3B1 mutation (low vs intermediate vs high: 18.4% vs 9.4% vs 0%; P = .016; supplemental Table 5), whereas ICSS high risk was related to NPM1, TP53, and WT1 mutations (low vs intermediate vs high: 1.7% vs 5.7% vs 13.6%, P = .014; 9.8% vs 14.2% vs 31.8%, P = .013; and 0% vs 0.9% vs 4.5%, P = .042, respectively).
The effect of ICSS on LFS and OS
The survival of the 3 ICSS risk groups was well stratified. ICSS high-risk patients had the shortest LFS and OS among the 3 groups (ICSS high- vs intermediate- vs low-risk patients: median, 7.6 months vs 10.9 months vs 85.2 months, P < .001; and 12.9 months vs 25.1 months vs 85.2 months, P < .001, respectively; Figure 1A-B). Subgroup analysis revealed similar findings in IPSS-R lower-risk (very-low-, low-, and intermediate-risk) and IPSS-R higher-risk (high- and very-high-risk) subgroups (Figure 2); the ICSS high-risk patients consistently had the worst LFS and OS among the 3 ICSS risk groups in IPSS-R lower-risk patients (median, 19.7 months vs 45.1 months vs not reached, P = .001; and 19.7 months vs 69.9 months vs not reached, P = .021, respectively) as well as in IPSS-R higher-risk patients (5 months vs 6.6 months vs 13.3 months, P = .006; and 8.7 months vs 14.2 months vs 22 months, P = .004, respectively). Incorporating IPSS-R and ICSS in survival analyses revealed that patients with low IPSS-R and low ICSS had the longest survival, and patients with high IPSS-R and high ICSS had the worst survival (Figure 3A). Time-dependent receiver operating characteristic (ROC) curves also inferred that ICSS had better predictive power for LFS and OS than IPSS-R (Figure 3B). Thus, ICSS could be complementary and incorporated into the IPSS-R to refine the risk stratification of patients with MDS.
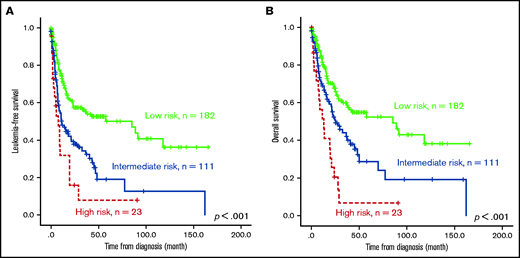
Kaplan-Meier survival curves of 316 patients with MDS. (A) LFS and (B) OS stratified by ICSS. Patients with high-risk ICSS had the worst LFS and OS among the 3 ICSS risk groups.
Kaplan-Meier survival curves of 316 patients with MDS. (A) LFS and (B) OS stratified by ICSS. Patients with high-risk ICSS had the worst LFS and OS among the 3 ICSS risk groups.
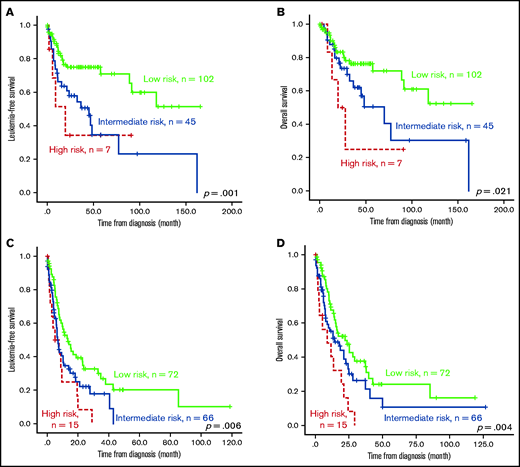
Kaplan-Meier survival curves stratified by ICSS in subgroups of patients with lower and higher IPSS-R. Outcome of the 307 patients who had cytogenetic data at diagnosis (thus, IRSS-R could be calculated). (A) LFS and (B) OS of patients from the IPSS-R lower-risk group. (C) LFS and (D) OS of patients from the IPSS-R higher-risk group. Patients with high-risk ICSS had the worst prognosis, whereas those with low-risk ICSS had the best outcome among the 3 subgroups across IPSS-R.
Kaplan-Meier survival curves stratified by ICSS in subgroups of patients with lower and higher IPSS-R. Outcome of the 307 patients who had cytogenetic data at diagnosis (thus, IRSS-R could be calculated). (A) LFS and (B) OS of patients from the IPSS-R lower-risk group. (C) LFS and (D) OS of patients from the IPSS-R higher-risk group. Patients with high-risk ICSS had the worst prognosis, whereas those with low-risk ICSS had the best outcome among the 3 subgroups across IPSS-R.

Kaplan-Meier survival curves incorporating ICSS and IPSS-R and time-dependent ROC curves analyzing predictive power of ICSS and IPSS-R, and Kaplan-Meier curves presenting OS of the external validation cohort from GSE15061. (A) OS was well stratified by incorporating ICSS and IPSS-R. (B) ROC curves were estimated by inverse probability of censoring weighting. (C) OS was well stratified by ICSS in the entire patient cohort. (D) Patients with MDS alone, excluding patients with CMML in the GSE15061 cohort. There were no ICSS high-risk patients in the GSE15061 cohort. AUC, area under the curve.
Kaplan-Meier survival curves incorporating ICSS and IPSS-R and time-dependent ROC curves analyzing predictive power of ICSS and IPSS-R, and Kaplan-Meier curves presenting OS of the external validation cohort from GSE15061. (A) OS was well stratified by incorporating ICSS and IPSS-R. (B) ROC curves were estimated by inverse probability of censoring weighting. (C) OS was well stratified by ICSS in the entire patient cohort. (D) Patients with MDS alone, excluding patients with CMML in the GSE15061 cohort. There were no ICSS high-risk patients in the GSE15061 cohort. AUC, area under the curve.
The prognostic implications of ICSS on LFS and OS were also demonstrated in the subgroups of patients with normal karyotype (n = 171; supplemental Figure 1A-B) and those without unfavorable cytogenetics, such as complex karyotypes, monosomy 7, and del(7q) (n = 262; supplemental Figure 1C-D).
We further analyzed the outcomes of patients with MDS receiving different treatment regimens. The ICSS high-risk patients still had the most inferior outcome in LFS and OS (supplemental Figure 2) regardless of whether they received supportive care (n = 162; high vs intermediate vs low risk: 1.8 months vs 21.1 months vs 118.1 months, P < .001; and 5.3 months vs 45.1 months vs 118.1 months, P < .001, respectively) or active treatment (n = 154; 8.7 months vs 10.3 months vs 16.8 months, P = .029; and 13.5 months vs 24.3 months vs 27.9 months, P = .024, respectively). However, the differences in LFS and OS among the 3 ICSS groups of patients treated with HMAs (n = 115) were alleviated (high vs intermediate vs low risk: 8.7 months vs 11.5 months vs 16.8 months, P = .232; and 19.4 months vs 27.8 months vs 26 months, P = .172, respectively; supplemental Figure 3A-B). Among those receiving HSCT, ICSS high-risk patients had a trend of shorter LFS and a significantly worse OS than ICSS low-risk patients (high vs low risk: 8.7 months vs 37.7 months, P = .071; and 12.9 months vs 91.4 months, P = .045, respectively; supplemental Figure 3C-D). The survival difference between high- and intermediate-risk patients was modest (high vs intermediate risk: 8.7 months vs 37.3 months, P = .231; and 12.9 months vs 40.6 months, P = .135, respectively), notwithstanding the limited number of patients (high risk, n = 6; intermediate risk, n = 15) in this comparison.
We also validated the prognostic significance of ICSS in another public cohort, GSE15061, which included patients with MDS and chronic myelomonocytic leukemia (CMML) with whole BM microarray gene expression data. Among the 132 patients with survival data, 100 patients were grouped into the low-risk group and 32 were grouped into the intermediate-risk group. No patients fell under the high-risk group because none of the patients simultaneously showed all 3 high-risk features. Patients in the intermediate-risk group had significantly poorer OS than those in the low-risk group (P = .048; Figure 3C). Excluding patients with CMML, the ICSS intermediate-risk group still tended to have a shorter OS (P = .08; Figure 3D). In the multivariate analysis, we included parameters that showed P < .1 in the univariate Cox regression analysis as covariates, including age, IPSS-R, ICSS, and mutations in ASXL1, EZH2, RUNX1, SF3B1, STAG2, and TP53 (supplemental Table 6). JAK2 and RAD21 were not included because of their low prevalence in this cohort (≤1%). The prognostic significance of ICSS remained valid for LFS (P = .001) and OS (P < .001), independent of other variables (Table 2).
Multivariate analysis for LFS and OS in 294 patients with MDS who had both cytogenetic and gene mutation data at diagnosis
| LFS | OS | |||||||
|---|---|---|---|---|---|---|---|---|
| 95% CI | 95% CI | |||||||
| Variable | HR | Lower | Upper | P | HR | Lower | Upper | P |
| Age* | 1.020 | 1.007 | 1.032 | .002 | 1.035 | 1.020 | 1.049 | <.001 |
| IPSS-R† | 1.692 | 1.428 | 2.004 | <.001 | 1.830 | 1.522 | 2.199 | <.001 |
| ASXL1 | 0.972 | 0.617 | 1.530 | .901 | 0.859 | 0.538 | 1.373 | .526 |
| EZH2 | 2.144 | 1.219 | 3.771 | .008 | 2.573 | 1.439 | 4.598 | <.001 |
| RUNX1 | 0.897 | 0.581 | 1.383 | .622 | 0.936 | 0.597 | 1.468 | .773 |
| SF3B1 | 0.513 | 0.264 | 0.999 | .050 | 0.413 | 0.197 | 0.866 | .019 |
| STAG2 | 1.620 | 0.947 | 2.770 | .078 | 1.231 | 0.697 | 2.176 | .474 |
| TP53 | 2.327 | 1.451 | 3.730 | <.001 | 3.365 | 2.056 | 5.508 | <.001 |
| ICCS‡ | 1.303 | 1.120 | 1.515 | .001 | 1.332 | 1.134 | 1.565 | <.001 |
P values of <.05 are statistically significant.
Only variables with P value ≤.10 in univariate analysis were incorporated into the multivariate Cox proportional hazard regression analysis.
CI, confidence interval.
Age, as a continuous variable analysis.
IPSS-R risk groups: very good, good, intermediate, poor, very poor.
Immune cell scoring system: low, intermediate, high.
Biological implication of immune cell fraction-derived scoring system
Following the above observations, we aimed to explore the potential mechanistic insight into how macrophage and eosinophil compositions affect MDS biology and prognosis. We first analyzed the correlations between each immune cell fraction and the blast percentage in the BM. As shown in Figure 4A-C, there was an incremental trend of blast percentages with an increase in M2 macrophages and eosinophils along with a parallel decrease in M0 macrophages. Furthermore, Pearson’s correlation revealed the negative correlation between the M0 fraction and BM blast percentages and the positive correlation between the M2 fraction and eosinophils with blasts (Figure 4D). In addition, GSEA showed that nuclear factor κB (NF-κB) signaling, BM oxidative stress response, and core-enriched HSC/leukemic stem cell (LSC) signatures were significantly enriched in patients with all 3 high-risk features (low fractions of M0, high fractions of M2, and eosinophils) than in patients without any high-risk features (all P < .01; Figure 5A). The most differentially expressed relevant genes in each pathway gene set, deciphered by leading edge analysis, are highlighted in Figure 5B and listed in supplemental Table 7. Interestingly, these pathway gene sets all shared 1 differentially expressed gene, JUN.

Histogram of the proportion of 22 types of immune cells and blasts in the BM from 316 patients with MDS and scatter plots depicting correlation between blast and immune cell percentages. There was an incremental trend of blast percentages along with a decrease in M0 macrophages (A, left to right) but an increase in M2 macrophage (B) and eosinophils (C). Pearson’s correlation (D) revealed weak to moderate yet significant correlations between blast percentages and M0 and M2 macrophages and eosinophils, respectively.
Histogram of the proportion of 22 types of immune cells and blasts in the BM from 316 patients with MDS and scatter plots depicting correlation between blast and immune cell percentages. There was an incremental trend of blast percentages along with a decrease in M0 macrophages (A, left to right) but an increase in M2 macrophage (B) and eosinophils (C). Pearson’s correlation (D) revealed weak to moderate yet significant correlations between blast percentages and M0 and M2 macrophages and eosinophils, respectively.

Functional enrichment analysis of pathways associated with high-risk immune cell score and the leading edge analysis diagrams. (A) GSEA plots show a significant association between ICSS high-risk and NF-κB, oxidative stress response, and core-enriched HSCs/leukemic stem cells signatures (all P < .01). (B) Diagrams show the log2 fold changes in all the genes studied, highlighting the genes in the leading edge analysis of NF-κB, oxidative stress, and HSC/LSC gene sets.
Functional enrichment analysis of pathways associated with high-risk immune cell score and the leading edge analysis diagrams. (A) GSEA plots show a significant association between ICSS high-risk and NF-κB, oxidative stress response, and core-enriched HSCs/leukemic stem cells signatures (all P < .01). (B) Diagrams show the log2 fold changes in all the genes studied, highlighting the genes in the leading edge analysis of NF-κB, oxidative stress, and HSC/LSC gene sets.
Discussion
Herein, we presented a concise immune cell fraction-derived scoring system to predict LFS and OS in patients with MDS. We demonstrated that this scoring system, which incorporates lower M0, higher M2, and higher eosinophils as adverse risk factors, independently predicted LFS and OS. The ICSS high-risk group had the worst LFS and OS among the 3 risk groups in the total cohort as well as in the subgroups of patients with higher- or lower-risk IPSS-R. We also demonstrated that patients in either the IPSS-R lower- or higher-risk group could be further stratified into different prognostic groups based on this ICSS. The ICSS may help identify higher-risk patients, particularly those with lower IPSS-R, for more aggressive treatment. Furthermore, in comparison with the ICSS low- and intermediate-risk groups, the ICSS high-risk group more frequently harbored NPM1, TP53, and WT1 mutations but less commonly showed SF3B1 mutation. More importantly, multivariate analysis proved that the immune cell score was an independent predictor of clinical outcomes in patients with MDS, regardless of patient age, IPSS-R risk, and mutations.
As a crucial component of the BM microenvironment, macrophages exhibit phenotypic heterogeneity and function controlled by microenvironmental signals.29,30 At present, classically activated M1 macrophages and alternatively activated M2 macrophages are thought to represent the 2 extremes of macrophage phenotypes.31,32 M1 macrophages play a role in antitumor immunity, whereas M2 macrophages have antiinflammatory and immunosuppressive functions. M2 macrophages now refer to all non–M1 macrophages and are divided into M2a to M2d subtypes.33 Tumor-associated macrophages are envisaged as M2-like phenotype, of which the M2d34 type participates in tumor invasion and metastasis as well as suppression of antitumor activity. Tumor-associated macrophages can promote cancer progression, and their accumulation in tumors is correlated with poor prognosis in various cancer types,35,36 including lymphoma and myeloma.37,38
In AML, more M2-like leukemia-associated macrophages in the BM correlated with an inferior prognosis.39 Al-Matary et al demonstrated that intense leukemia-associated macrophage infiltration correlated in vivo with worse survival in an NUP98-HOXD13 transgenic mouse model and that growth factor independence 1, whose absence impedes macrophage polarization toward a leukemia-supporting state both in vitro and in vivo, plays a crucial role in macrophage polarization.33 Recently, Xu et al used CIBERSORT to analyze BM samples from 3 independent AML cohorts; these authors found that higher M2 fraction was an adverse predictor of EFS and OS and that the macrophage marker CD206 could serve as a novel prognostic indicator for AML.18 In our MDS cohort, infiltration with more M2 was associated with inferior LFS and OS, indicating the adverse effect of M2 in solid tumors, AML, and MDS.
Although the enrichment of unpolarized M0 macrophages in the tumor microenvironment has been demonstrated to be detrimental for survival of patients with hepatocellular carcinoma and sarcoma,16,40 their role in MDS and other hematologic malignancies has been scarcely reported. Higher M0 population seemed to correlate with better survival in our study. We explored the relationships between M0, M2, and expression of IL4I1, which promotes M2 function and contributes to the immunoregulatory activities of interleukin-4 (IL-4)–treated macrophages (IL-4 polarizes M2 macrophages).32 We found that M0 fraction was inversely correlated with M2 fraction and the expression level of IL4I1 (Pearson's correlation coefficient, r = −0.3, P < .001; and r = −0.33, P < .001, respectively), whereas M2 fraction positively correlated with IL4I1 expression (r = 0.3, P < .001). In this context, it might be reasonable to assume that higher proportions of unpolarized macrophages are indicative of a more naïve and unstimulated microenvironment. Nonetheless, the interaction between M0 and M2, and even M1 is so complicated that their roles in the MDS microenvironment warrant further studies.
Eosinophils arise from multipotent CD34+ progenitor cells in the BM. Differentiation of eosinophil progenitors into mature eosinophils involves a complex network of cytokine and chemokine signals.41,42 Although eosinophilia is reported in various hematological malignancies, most studies concerning the prognostic implications of tumor-infiltrating eosinophils have mainly focused on solid cancers.43-46 Intriguingly, the role of infiltrating eosinophils in tumor proliferation has been deemed pleiotropic. For instance, the antitumorigenic effect was observed in cancers originating from the colorectum and stomach, wherein an increased level of tumor-infiltrating eosinophils correlated with a reduced risk of metastasis or recurrence.43 Inversely, tumor-infiltrating eosinophils have pro-tumorigenic implications in cervical cancer, Hodgkin lymphoma, and diffuse large B-cell lymphoma, and their accumulation correlated with relapse of disease and shortened survival.17,44-46 It was reported that higher BM eosinophil percentage, shown by CIBERSORT, was associated with a shortened EFS in a publicly annotated AML cohort (GSE10358).18 As for MDS, Matsushima et al first reported that patients with BM eosinophilia more frequently harbored complex karyotypes and had worse survival than those without BM eosinophilia.47 In line with Matsushima's observation, patients with a higher fraction of eosinophils in this study more frequently harbored poor-risk karyotypes (18.4% vs 11.0%, P = .076) and had poorer survival than patients with lower fractions.
Our bioinformatic analyses revealed the significant correlation between high immune cell risk scores and LSC signatures, NF-κB signaling, and oxidative stress characteristics. Recent studies have shown that LSC signatures are associated with higher risk of disease progression and mortality in patients with MDS and can serve as prognostic markers independent of IPSS-R risk and genomic alterations.48,49 Constitutive activation of NF-κB signaling has been known to play a critical role in MDS pathophysiology and is a feature of high-risk MDS.7,8,50-54 In addition, macrophages can be stimulated to M2-like phenotypes via NF-κB activation.55-58 Taken together, it is conceivable that higher-risk MDS features with both aberrantly upregulated NF-κB and higher macrophage M2 in the BM microenvironment.
Oxidative stress, on the other hand, has been shown to be involved in the development of myeloproliferative neoplasms, MDS, and AML.59-63 Fundamentally, oxidative stress and mitochondrial dysfunction can lead to DNA alterations, thereby disturbing the function of human HSCs. Increased oxidative stress may also activate the p38 mitogen-activated protein kinase pathway, thereby coaxing HSCs from quiescence to a proliferative state.64 The role of oxidative stress in the pathogenesis and evolution of MDS could be further supported by the presence of oxidized pyrimidine bases in the BM and blood CD34+ cells from patients with MDS but not in healthy individuals65 ; higher reactive oxygen species (ROS) levels in BM CD34posCD38low cells,66 red blood cells, and platelets60 from patients with MDS than in normal counterparts; and elevated intracellular levels of peroxides in BM leukocytes of patients with MDS.61 Regarding phenotypic features, higher frequency of exposure to specific toxins and radiations, which induce oxidative stress, is associated with karyotypic abnormalities in patients with MDS.67 Elevated ROS levels were associated with increased mutation frequency in a murine model of MDS.68 Moreover, transcriptional activation of the p53-S100A8/9-TLR4 inflammatory signaling, characterized by oxidative stress and mitochondrial dysfunction, was predictive of disease evolution in human MDS.69 Patients with high ROS and high superoxide/peroxides ratios had inferior OS than their counterparts.70 In the present study, ICSS high-risk patients had a higher frequency of poor-risk cytogenetics, more detrimental mutations, and reduced LFS and OS, corresponding with pronounced oxidative stress in the BM.
JUN was identified to be differentially expressed in the pathways shown above. JUN is a member of the activating protein 1 (AP-1) family and a central transcription factor during macrophage activation.71,72 The macrophage transformation from M1 to M2 can be induced by NF-κB via upregulation of JUN expression.57,58 The mRNA and protein levels of JUN in macrophages are also elevated after oxidative stress or proinflammatory stimulations.72,73 Although JUN has been a subject of intense studies in various subtypes of AML, wherein it is frequently overexpressed,74-77 its role in MDS pathophysiology and immune cell crosstalk, particularly among stem cells, macrophages, and eosinophils, in the microenvironment remains underappreciated. Taken together, JUN may serve as an enticing target for future research.
To the best of our knowledge, the present study is the first to adopt CIBERSORTx to analyze the clinical significance of BM immune cells in MDS. Our dataset is also the first public cohort to date using the whole BM containing immune cells for RNA sequencing in patients with MDS. We show that immune cells in the BM microenvironment significantly impact LFS and OS in patients with MDS in addition to clinical features and genetic alterations. The ICSS we constructed herein can serve as a complementary risk stratification system to predict clinical outcomes in the total MDS cohort and subgroups of patients with lower- and higher-risk IPSS-R. However, there are also some limitations to this study. First, the sample size was relatively small and the patients were enrolled from a single ethnic group. Second, the validation cohort was a microarray database with a limited number of cases, and only 2 risk groups were identified by ICSS stratification. Further validation using large, independent cohorts is warranted. Another confounding factor may originate from patient selection, because patients with t-MDS were excluded from this study. Studies have revealed that damage to BM from prior therapies can alter its microenvironment, and BM niche changes can initiate hematopoietic diseases, including dysplasia and neoplasia; conversely, malignant myeloid cells mediate remodeling of the BM microenvironment.78-86 Although several studies have explored the temporal-causal relationship of antimalignancy treatment and BM microenvironment dynamics, how the quantities and functions of immune cells are affected remains a potential area of research interest.87-89 Hence, whether the ICSS, which was constructed using primary data of patients with MDS, could be applied for the prognostication of patients with t-MDS and whether there are differences in the immune microenvironment between primary and t-MDS warrant further studies. Meanwhile, experimental studies, including but not limited to single-cell analysis, are needed to gain more detailed mechanistic insights into the crosstalk between immune cells and MDS blast cells within the BM microenvironment.
Acknowledgments
The authors thank Ken Mills for providing the survival data as validation and acknowledge service provided by the Department of Laboratory Medicine, Department of Medical Research, and Division of Hematology, Department of Internal Medicine, National Taiwan University Hospital.
This work was supported by grants from Ministry of Science and Technology, Taiwan (project number MOST 109-2314-B-002-221, 109-2314-B-002-222), Taiwan Ministry of Health and Welfare (project number MOHW109-TDU-B-211-134009), and Department of Medical Research, National Taiwan University Hospital (NTUH.107-N4084; NTUH.108-N4237).
Authorship
Contribution: Y.-H.W. collected and managed data, analyzed and interpreted statistics, researched the literature, and wrote the manuscript; C.-L.H. and C.-Y.Y. assisted in statistical analysis; Y.-Y.K., M.-H.T., Y.-L.P., C.-J.K., and C.-H.T. collected and interpreted next-generation sequencing data; H.-A.H. and W.-C.C. collected and managed data; and C.-C.L. and H.-F.T. conceived and coordinated the study and revised the manuscript.
Conflict-of-interest disclosure: The authors declare no competing financial interests.
Correspondence: Chien-Chin Lin, Department of Laboratory Medicine, National Taiwan University Hospital, No. 7, Chung-Shan S. Rd, Taipei City 10002, Taiwan; e-mail: lincc@ntu.edu.tw; and Hwei-Fang Tien, Department of Internal Medicine, National Taiwan University Hospital, No. 7, Chung-Shan S. Rd, Taipei City 10002, Taiwan; e-mail: hftien@ntu.edu.tw.

