

Key Points
Expression of CALCRL is an independent prognostic factor and a potential therapeutic target in pediatric AML.
CALCRL is linked with relapse risk in p ediatric AML, which supports its role as a master regulator of relapse-initiating drug-tolerant cells.

Abstract
We have recently identified the G protein-coupled neuropeptide receptor calcitonin receptor‐like (CALCRL) as an independent prognostic biomarker and a therapeutic target in more than 1500 adult patients with acute myeloid leukemia (AML). Here, we confirmed CALCRL expression as a prognostic factor in a cohort of 284 pediatric patients with AML. High CALCRL expression was independently associated with event-free survival (hazard ratio [HR], 1.87; 95% confidence interval [CI], 1.36-2.57; P = .0001), overall survival (HR, 1.55; 95% CI, 1.06-2.27; P = .025), and cumulative incidence of relapse (HR, 2.10; 95% CI, 1.49-1.96; P < .0001) when adjusting for age, white blood cell count, and genetic risk. Despite its association with leukemia stem cell signatures, CALCRL expression remained associated with all end points when compared with the 17-gene leukemic stem cell score. The strong association of CALCRL expression with the risk of relapse also in the pediatric population supports its role as novel age-independent master regulator of relapse-initiating, drug-tolerant AML cells in humans.
Introduction
Despite improvements in outcome over the past few decades, acute myeloid leukemia (AML) remains a major cause of childhood cancer mortality.1 Treatment relies on intensive chemotherapy, followed by allogeneic hematopoietic stem cell transplantation (HSCT) in high-risk genetic subgroups and in poor responders to induction therapy and is associated with significant morbidity.2 Careful risk stratification is key for the reliable identification of patients not in need of an allogeneic transplant to avoid significant late effects. Furthermore, to prevent relapses currently occurring in 30% of patients despite intensive frontline therapy, novel targets for pharmacological interventions with higher efficacy and a better therapeutic index are urgently needed.3
Calcitonin receptor‐like (CALCRL) is a G-protein coupled neuropeptide receptor involved in various biological processes such as proliferation, apoptosis, and inflammation.4,5 It can be activated by 2 ligands, adrenomedullin (ADM) and calcitonin gene-related peptide. Inhibition of CALCRL signaling has demonstrated therapeutic activity in preclinical models of solid malignancies6-10 and has emerged as a novel therapeutic principle in migraine.11 We recently demonstrated that higher messenger RNA (mRNA) and protein levels of CALCRL in leukemic blasts are consistently associated with adverse outcomes across various genetic backgrounds in 5 independent international cohorts collectively comprising more than 1500 adult AML patients.12 CALCRL knockout reduces colony formation of human AML cell lines, confirming a functional role of the receptor in AML.12 Together, these finding suggest CALCRL as an attractive novel therapeutic target in adult AML.
The molecular landscape of pediatric AML has been characterized in detail in recent years.13 Significant differences in molecular profiles have been found in comparison with adult AML.13 Thus, the clinical role of CALCRL expression demands validation in pediatric patients with AML. Here, we investigated the prognostic impact of CALCRL expression in a cohort of 284 pediatric AML patients treated within the AAML03P1, AAML0531, and CCG-2961 trials.13-16
Methods
Patients, samples, and treatment
The expression of CALCRL was analyzed in the publicly available mRNA-sequencing cohort from the Therapeutically Applicable Research to Generate Effective Treatments (TARGET)-AML project (284 patients) comprising children, including infants and adolescents, with de novo AML who were treated within the CCG-2961, AAML03P1, and AAML0531 trials of the Children’s Oncology Group.13-16 The institutional review board of the Children's Oncology Group approved these trials. CCG-2961 incorporated idarubicin, fludarabine, and interleukin-2 on a standard treatment backbone. AAML03P1 and AAML0531 introduced the monoclonal anti-CD33 antibody-drug conjugate gemtuzumab ozogamicin into standard first-line AML therapy. The TARGET-AML mRNA-sequencing and clinical data were downloaded from the TARGET Data Matrix on 26 March 2021.13
The 17-gene leukemic stem cell score (LSC17) was calculated as previously described.17 Gene set enrichment analysis was done with the curated “C2” collection of the Molecular Signatures Database version 7.4 (http://software.broadinstitute.org/gsea/msigdb/) that consists of 6290 gene sets from various sources.
Statistical analyses
Maximally selected rank statistics on event-free survival (EFS) as the primary end point was used to dichotomize CALCRL expression.18 Baseline characteristics were compared between CALCRL expression groups using χ2 or Fisher’s exact test for categorical and the Mann-Whitney test for continuous variables. Time-to-event variables were defined as described.12,13 Survival probabilities were estimated using the Kaplan-Meier method and compared using log-rank test. Cumulative incidence of relapse (CIR) was evaluated with the Aalen-Johansen estimator and compared using Gray’s test. All survival probabilities are given at 5 years. The follow-up time was calculated by the reverse Kaplan-Meier method. We used multivariable Cox proportional hazards models to assess statistical significance of prognostic factors with respect to overall survival (OS) and EFS, multivariable logistic regression models for achievement of complete remission (CR), and multivariable Fine-Gray proportional hazards regression models for CIR. Age, white blood cell count (WBC), and genetic risk19 were included in the multivariable models in addition to CALCRL expression. Cox proportional hazards models and Wald test for interaction was used to examine the potential heterogeneity of the prognostic impact of CALCRL expression across subgroups. The proportional hazards assumption was verified for each variable individually by inspection of scaled Schoenfeld residuals. Missing data were not imputed. Two-sided P values < .05 were considered to indicate significant differences. All analyses were performed using the R software package, version 4.0.3.
Results
CALCRL expression was dichotomized using maximally selected rank statistics on EFS that was adjusted for multiple testing (supplemental Data).18 Baseline characteristics of patients from the TARGET-AML cohort according to CALCRL expression levels are listed in Table 1. High CALCRL expression levels were significantly associated with inv(16)/t(16;16) (P = .0009) and internal tandem duplication of the FLT3 gene (FLT3-ITD; P = .0001), whereas low CALCRL expression was associated with t(8;21) (P < .0001), CEBPA mutations (P = .0076), and with a higher bone marrow blast count (P = .023). Overall, pediatric patients with high leukemic CALCRL expression trended to be allocated to adverse cytogenetic and molecular risk groups (P = .068). We found no association of CALCRL expression with age, sex, French-American-British classification type, involvement of the central nervous system, myeloid sarcoma, WBC, or peripheral blast count. The frequency of allogeneic HSCT in first CR was numerically higher in patients with high CALCRL expression, although not statistically significant (19.4% and 12.2% for high and low CALCRL expression, respectively; P = .21).
Patient characteristics according to CALCRL expression
| Variables | CALCRL expression | ||
|---|---|---|---|
| Low | High | P value | |
| N | 203 | 81 | |
| Age, y | .38* | ||
| Median (range) | 10 (0-23) | 10 (0-20) | |
| Sex, no. (%) | .15† | ||
| Male | 102 (50.2) | 49 (60.5) | |
| Female | 101 (49.8) | 32 (39.5) | |
| FAB, no. (%) | .059† | ||
| M0 | 6 (3.0) | 1 (1.2) | |
| M1 | 28 (13.8) | 8 (9.9) | |
| M2 | 47 (23.2) | 23 (28.4) | |
| M4 | 41 (20.2) | 24 (29.6) | |
| M5 | 47 (23.2) | 7 (8.6) | |
| M6 | 3 (1.5) | 1 (1.2) | |
| M7 | 8 (3.9) | 1 (1.2) | |
| NOS | 10 (4.9) | 7 (8.6) | |
| Missing | 13 (6.4) | 9 (11.1) | |
| WBC, ×109/L | .27* | ||
| Median (range) | 40.5 (0.9-519.0) | 51.1 (2.0-446.0) | |
| PB blasts, % | .67* | ||
| Median (range) | 61 (0-97) | 61 (0-97) | |
| BM blasts, % | .023* | ||
| Median (range) | 77 (20-99) | 70 (14-100) | |
| CNS involvement, no. (%) | .81* | ||
| Present | 16 (7.9) | 5 (6.2) | |
| Absent | 187 (92.1) | 76 (93.8) | |
| Extramedullary AML, no. (%) | .64* | ||
| Present | 23 (11.3) | 7 (8.6) | |
| Absent | 179 (88.2) | 74 (91.4) | |
| Missing | 1 (0.5) | 0 (0.0) | |
| Trial, no. (%) | .68† | ||
| AAML03P1 | 44 (21.7) | 16 (19.8) | |
| AAML0531 | 132 (65.0) | 51 (63.0) | |
| CCG-2961 | 27 (13.3) | 14 (17.3) | |
| HSCT in 1 CR, no. (%) | .21† | ||
| Yes | 22 (10.8) | 13 (16.0) | |
| No | 159 (10.8) | 54 (66.7) | |
| Missing | 22 (10.8) | 14 (17.3) | |
| Cytogenetics, no. (%)‡ | |||
| t(8;21) | 44 (22.8) | 1 (1.4) | <.0001§ |
| inv(16)/t(16;16) | 21 (10.9) | 21 (28.4) | .0009† |
| Normal | 47 (24.4) | 23 (31.1) | .34† |
| t(9;11) | 15 (7.8) | 1 (1.4) | .080§ |
| t(6;9) | 1 (0.5) | 2 (2.7) | .19§ |
| t(9;22) | — | — | |
| t(v;11q23) | 20 (10.4) | 3 (4.1) | .14§ |
| inv(3)/t(3;3) | 0 (0.0) | 1 (1.4) | .27§ |
| del(5q)/-5 | 1 (0.5) | 0 (0.0) | 1.00§ |
| −7 | 1 (0.5) | 1 (1.4) | .48§ |
| −17/abn(17p) | 2 (1.1) | 3 (5.3) | .092§ |
| Complex | 15 (7.8) | 4 (5.4) | .60§ |
| Monosomal | 3 (1.6) | 3 (4.1) | .35§ |
| Other | 30 (15.5) | 16 (21.6) | .32† |
| Missing | 10 (4.9) | 7 (8.6) | |
| FLT3-ITD, no. (%) | .0001† | ||
| Present | 22 (10.8) | 25 (30.9) | .43† |
| High allelic ratio | 14 (63.6) | 12 (48.0) | |
| Low allelic ratio | 8 (36.4) | 13 (52.0) | |
| Absent | 181 (89.2) | 56 (69.1) | |
| NPM1, no. (%) | .54§ | ||
| Mutated | 12 (5.9) | 7 (8.6) | |
| Wild type | 185 (91.1) | 70 (86.4) | |
| Missing | 6 (3.0) | 4 (4.9) | |
| CEBPA, no. (%) | .0076§ | ||
| Mutated | 16 (7.9) | 0 (0.0) | |
| Wild type | 185 (91.1) | 79 (97.5) | |
| Missing | 2 (1.0) | 2 (2.5) | |
| Risk group, no. (%)ǁ | .068† | ||
| Favorable | 89 (43.8) | 27 (33.3) | |
| Intermediate | 86 (42.4) | 34 (42.0) | |
| Adverse | 16 (7.9) | 13 (16.0) | |
| Missing | 12 (5.9) | 7 (8.6) | |
Significant P values are marked in bold.
BM, bone marrow; CEPBA, CCAAT/enhancer binding protein α; CNS, central nervous system; FAB, French-American-British classification; FLT3-ITD, internal tandem duplication of the FLT3 gene; HSCT, allogeneic hematopoietic stem cell transplantation; NPM1, nucleophosmin-1; PB, peripheral blood.
Mann-Whitney test.
χ2 test.
Patients may be counted more than once in cases with 2 or more coexisting cytogenetic abnormalities.
Fisher’s exact test.
Risk groups were defined as described19 as favorable [t(8;21), inv(16)/t(16;16), NPM1 or CEBPA mutations in the absence of FLT3-ITD], adverse [-5/del(5q), -7, or high FLT3-ITD allelic ratio], and intermediate (all other patients with available genetic data).
The median follow-up time was 6.1 years (interquartile range, 5.2, 7.6 years). In patients with pediatric AML, high CALCRL expression was associated with an inferior probability of EFS (12.2% and 40.3% at 5 years for high vs low CALCRL expression; P < .0001; Figure 1A). High CALCRL expression also predicted an inferior probability of OS (37.0% and 59.9% at 5 years; P = .0023; Figure 1B). High CALCRL expression trended to be associated with lower CR rates after induction therapy (82.7% and 90.6% for high and low CALCRL expression, respectively; P = .060). Of note, in patients who achieved a CR to induction therapy, high CALCRL expression predicted a significantly higher CIR at 5 years (85.2% and 51.7%; P < .0001; Figure 1C). We found no consistent heterogeneity of the associations between CALCRL expression levels by age, sex, WBC, genetic risk factors, type of trial, or allogeneic HSCT vs no HSCT in CR1 (Figure 2; supplemental Data).
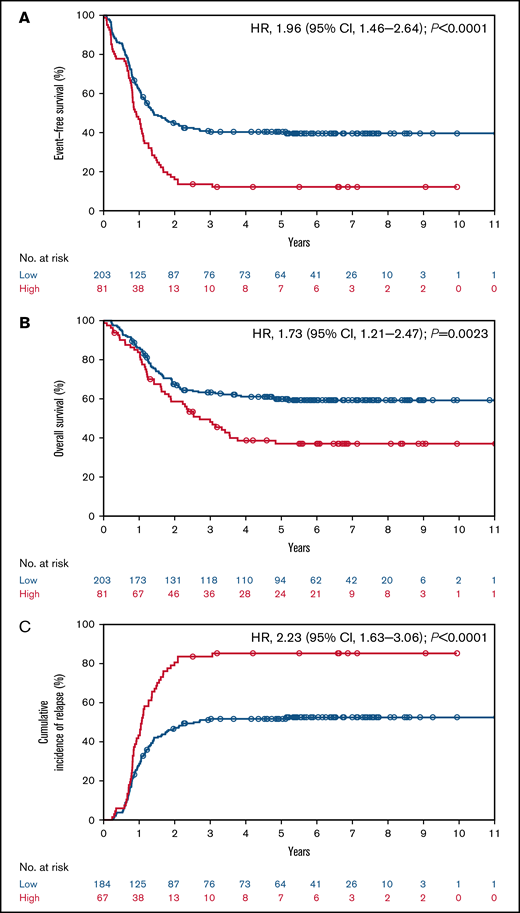
CALCRL expression and survival in the pediatric TARGET cohort.13 (A) Event-free survival, (B) overall survival, and (C) cumulative incidence of relapse according to dichotomized CALCRL expression levels.
CALCRL expression and survival in the pediatric TARGET cohort.13 (A) Event-free survival, (B) overall survival, and (C) cumulative incidence of relapse according to dichotomized CALCRL expression levels.

Forest plot of the association of CALCRL expression on event-free survival in selected subgroups of the pediatric TARGET cohort. Unadjusted hazard ratios (HRs) for high vs low CALCRL expression in selected subgroups are shown. Position of the squares represents the point estimate and horizontal lines represent the 95% confidence intervals (CI). The size of the squares is proportional to the precision of the estimate. The position of the diamond and the dotted vertical line represent the overall HR from the entire cohort. The lateral points of the diamond represent the 95% CI. The P values are for interaction of unadjusted hazard ratios by subgroups and represent heterogeneity. CBF, core-binding factor; CK, complex karyotype; MLL, mixed-lineage leukemia; NK, normal karyotype; NPM1, nucleophosmin-1.
Forest plot of the association of CALCRL expression on event-free survival in selected subgroups of the pediatric TARGET cohort. Unadjusted hazard ratios (HRs) for high vs low CALCRL expression in selected subgroups are shown. Position of the squares represents the point estimate and horizontal lines represent the 95% confidence intervals (CI). The size of the squares is proportional to the precision of the estimate. The position of the diamond and the dotted vertical line represent the overall HR from the entire cohort. The lateral points of the diamond represent the 95% CI. The P values are for interaction of unadjusted hazard ratios by subgroups and represent heterogeneity. CBF, core-binding factor; CK, complex karyotype; MLL, mixed-lineage leukemia; NK, normal karyotype; NPM1, nucleophosmin-1.
Next, we performed multivariable analyses to investigate whether the adverse prognostic impact of CALCRL was independent from established risk factors in pediatric AML (Table 2). Besides CALCRL expression, established risk factors such as age, WBC, and genetic risk factors were included in the models. Indeed, CALCRL expression levels remained independently associated with EFS (hazard ratio [HR], 1.87; 95% confidence interval [CI], 1.36-2.57; P = .0001) and OS (HR, 1.55; 95% CI, 1.06-2.27; P = .025) after multivariable adjustment. High CALCRL expression tended to be associated with a lower probability of CR to induction therapy, though not statistically significant (odds ratio, 0.57; 95% CI, 0.25-1.29; P = .17). Of note, in patients who achieved a CR after induction therapy, high CALCRL expression was associated with a twofold increased hazard risk of relapse (HR, 2.10; 95% CI, 1.49-2.96; P < .0001).
Multivariable regression analyses
| Variables in the model | OR/HR | 95% CI | P value |
|---|---|---|---|
| Complete remission | |||
| Age: per 10-y increase | 0.91 | 0.46-1.81 | .79 |
| WBC: per 50 × 109/L increase | 0.91 | 0.75-1.11 | .36 |
| Risk group* | .0064 | ||
| Favorable vs intermediate | 7.67 | 2.19-26.80 | .0014 |
| Adverse vs intermediate | 0.66 | 0.23-1.85 | .43 |
| CALCRL expression: high vs low | 0.57 | 0.25-1.29 | .17 |
| Overall survival | |||
| Age: per 10-y increase | 1.29 | 0.93-1.79 | .13 |
| WBC: per 50 × 109/L increase | 0.98 | 0.88-1.09 | .71 |
| Risk group* | <.0001 | ||
| Favorable vs intermediate | 0.35 | 0.22-0.53 | <.0001 |
| Adverse vs intermediate | 1.16 | 0.66-2.04 | .61 |
| CALCRL expression: high vs low | 1.55 | 1.06-2.27 | .025 |
| Event-free survival | |||
| Age: per 10-y increase | 1.11 | 0.85-1.45 | .44 |
| WBC: per 50 × 109/L increase | 1.03 | 0.94-1.12 | .55 |
| Risk group* | <.0001 | ||
| Favorable vs intermediate | 0.40 | 0.28-0.55 | <.0001 |
| Adverse vs intermediate | 1.04 | 0.63-1.70 | .89 |
| CALCRL expression: high vs low | 1.87 | 1.36-2.57 | .0001 |
| Cumulative incidence of relapse | |||
| Age: per 10-y increase | 0.98 | 0.72-1.32 | .87 |
| WBC: per 50 × 109/L increase | 1.01 | 0.91-1.12 | .83 |
| Risk group* | <.0001 | ||
| Favorable vs intermediate | 0.46 | 0.32-0.64 | <.0001 |
| Adverse vs intermediate | 0.79 | 0.44-1.41 | .42 |
| CALCRL expression: high vs low | 2.10 | 1.49-2.96 | <.0001 |
ORs greater or less than 1.0 indicate higher or lower CR rates, respectively, for the first category listed. HRs greater or less than 1.0 indicate an increased or decreased risk, respectively, of an event for the first category listed.
OR, odds ratio.
Risk groups were defined as described19 as favorable [t(8;21), inv(16)/t(16;16), NPM1 or CEBPA mutations in the absence of FLT3-ITD], adverse [-5/del(5q), -7, or high FLT3-ITD allelic ratio], and intermediate (all other patients with available genetic data).
Overall, CALCRL expression levels were associated with the differential expression of 2262 genes. Among those genes, 516 were up- and 1746 were downregulated. A heatmap of the 200 most significantly regulated genes is shown in Figure 3. High expression of CALCRL was strongly associated with high expression of TNFRSF18, which has been described to contribute to immune evasion of AML.20 It was also positively correlated with the upregulation of markers of stemness such as CDCP1.21,22 In turn, it was correlated with the downregulation of MSX2, which has been described as a negative regulator of stem cell functions.23 In addition, CALCRL expression inversely correlated with genes that sensitize toward chemotherapy MSX2 and CADM1.23,24 Overall, samples with high CALCRL expression were significantly enriched for genes defining signatures of LSCs on gene set enrichment analyses (supplemental Data). Because LSC signatures are strong predictors of outcome, we tested the prognostic performance of CALCRL expression compared with the LSC17 score.17 The LSC17 score has been described to be superior to other LSC scores and does not include CALCRL as a component. Here, we found that CALCRL expression remained prognostic when the LSC17 score was included in the multivariable analyses (supplemental Data) and CALCRL expression further stratified survival in pediatric AML patients with low and high LSC17 scores (Figure 3).
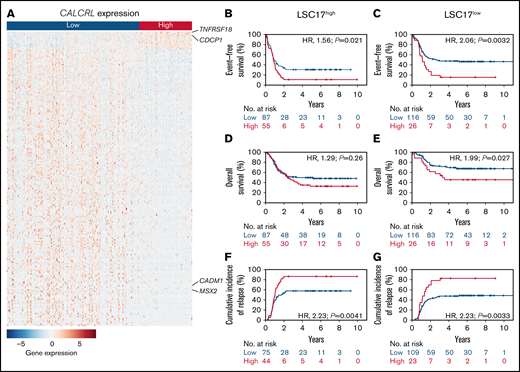
Biological insights. (A) Heat map of the 200 differentially expressed genes with the lowest adjusted P values ordered by log fold change between pediatric patients with AML with high and low CALCRL expression levels. Rows represent the color-coded genes with blue indicating low, white intermediate, and red high expression values for the given gene. Columns represent patients, ordered from left to right by CALCRL expression. Genes that are mentioned in the text are indicated. The complete list of the 200 most differentially regulated genes can be found in the supplemental Data. (B,C) Event-free survival, (D,E) overall survival, and (F,G) cumulative incidence of relapse according to CALCRL expression in patients with (B,D,F) high and (C,E,G) low LSC17 scores.17
Biological insights. (A) Heat map of the 200 differentially expressed genes with the lowest adjusted P values ordered by log fold change between pediatric patients with AML with high and low CALCRL expression levels. Rows represent the color-coded genes with blue indicating low, white intermediate, and red high expression values for the given gene. Columns represent patients, ordered from left to right by CALCRL expression. Genes that are mentioned in the text are indicated. The complete list of the 200 most differentially regulated genes can be found in the supplemental Data. (B,C) Event-free survival, (D,E) overall survival, and (F,G) cumulative incidence of relapse according to CALCRL expression in patients with (B,D,F) high and (C,E,G) low LSC17 scores.17
Discussion
The neuropeptide receptor CALCRL has been described as an independent prognostic factor and novel therapeutic target in adult patients with AML.12 In this study, we investigated the clinical and prognostic role of CALCRL in pediatric patients with AML. The expression of CALCRL and its associations with outcome were retrospectively analyzed in a publicly available cohort of 284 patients with childhood AML.13
Relapse is still a major cause of death in children and adults with AML.2,25 On a biological level, quiescent LSCs that survive chemotherapy have been proposed to cause relapse.26 On the clinical level, this is supported by the fact that LSC signatures are strong predictors of outcome.17 Here, we show that CALCRL expression is associated with stemness signatures in pediatric AML. It remains significantly associated with outcome even when the LSC17 score is included in the multivariable models, suggesting an added value over this existing stemness score. In recent years, evidence has been increasing that relapse of AML is caused by relapse-initiating drug-tolerant cells (RICs) that are not enriched for LSCs or quiescent cells in vivo.27,28 Interestingly, CALCRL has just been proposed as a master regulator of RICs in preclinical models of AML.29 Although the association of CALCRL with OS and EFS has previously been shown for adult patients with AML, a direct association with the risk of relapse has not been described before, to the best of our knowledge. The clinical association of CALCRL expression with the risk of relapse in the pediatric AML population supports the biological role of CALCRL as a marker of stemness and a master regulator of RICs in human AML. Overall, our findings support CALCRL as an attractive target for novel pharmaceutical interventions that are directed against mechanisms causing relapse of AML, now including children and adolescents with their high medical need.
Antibody-based inhibition of CALCRL has been proposed as a novel therapeutic principle in preclinical models of solid tumors.6-10 Here, inhibition of CALCRL results in a reduction of tumor growth by the disruption of angiogenesis and an antiproliferative impact on cancer cells. Interestingly, CALCRL-targeting drugs are approved for patients with migraine, based on the critical role of a neuropeptide acting on CALCRL signaling in this disease.11 These agents are well-tolerated in humans and therefore attractive candidates for repurposing as antileukemic agents. Recently, knockdown of CALCRL in human AML cell lines has been shown to prolong the survival of mice in AML xenotransplantation models and increase the sensitivity toward chemotherapy.29 Further studies are necessary to determine the therapeutic efficacy of antibody- or small molecule-based inhibition of CALCRL and/or its ligands ADM and calcitonin gene-related peptide alone and in combination with chemotherapy in pediatric and adult AML.
Our study has some limitations. First, our analysis is limited by its retrospective nature and needs validation in a prospective manner. Second, information on the time of transplantation was not available in the TARGET data matrix; thus, we were not able to investigate the impact of allogeneic HSCT in CALCRL high expressors in a time-dependent manner. In addition, we were not able to look for a potential bias caused by events unrelated to leukemia biology by censoring at allogeneic HSCT. However, we did not find any significant heterogeneity of the prognostic impact of CALCRL expression according to transplant status. Thus, the prognostic impact of CALCRL exists in both transplanted and nontransplanted patients and is not determined by the type of consolidation.
In summary, we identified CALCRL as a marker of stemness and an independent prognostic factor in pediatric AML, reinforcing its suitability as a novel therapeutic target in these patients. We demonstrated that the expression of CALCRL is strongly connected with the risk of relapse in pediatric AML, which supports its role as a master regulator of RICs. Results of this study will stimulate prospective analysis of the prognostic value of CALRCL expression in future trials and clinical investigation of repurposed CALCRL-targeting drugs in children and adolescents with AML.
Acknowledgments
The results published here are in whole or part based upon data generated by the Therapeutically Applicable Research to Generate Effective Treatments (https://ocg.cancer.gov/programs/target) initiative, phs000218. The data used for this analysis are available at https://portal.gdc.cancer.gov/projects. The authors thank all patients and clinicians contributing data to the published dataset.
L.A. is supported by the Innovative Medical Research Fund of the University of Münster Medical School (AN111813). G.L., C.R., and W.E.B. are supported by the German Research Foundation (DFG EXC 1003, Cluster of excellence ‘Cells in Motion’). C.S. is supported by the Eurostars-2 programme (grant E!11969 ComPAIR).
Authorship
Contribution: L.A. designed the study; L.A. performed statistical studies and analyzed the data; M.W. performed the GSE and DGE analyses; S.M. coordinated the studies providing the material and the public database used for this analysis; L.A., A.A., W.E.B., S.M., C.S., and C.R. wrote the manuscript; L.A., M.W., J.-H.M., M.F.A., A.A., S.S., W.E.B., G.L., M.D., S.M., C.S., and C.R. interpreted the data and made the decision to submit the manuscript for publication.
Conflict-of-interest disclosure: The authors declare no competing financial interests.
Correspondence: Linus Angenendt, Department of Medicine A, University Hospital Münster, Albert-Schweitzer-Campus 1, 48149 Münster, Germany; e-mail: linus.angenendt@ukmuenster.de.

