

Key Points
Comparison of the mutation frequencies and numbers of 122 genes in 3096 cases enables identification of “mutation-driven” entities.
Differences in mutation patterns in cases with or without CHIP-associated mutations across entities suggest differences in pathophysiology.

Abstract
Acquired somatic mutations are crucial for the development of most cancers. We performed a comprehensive comparative analysis of the mutational landscapes and their correlation with CHIP-related (clonal hematopoiesis of indeterminate potential) mutations and patient age of 122 genes in 3096 cases of 28 different hematological malignancies. Differences were observed regarding (1) the median number of mutations (highest, median n = 4; lowest, n = 0); (2) specificity of certain mutations (high frequencies in atypical chronic myeloid leukemia [aCML; ASXL1, 86%], follicular lymphoma [FL; KMT2D, 87%; CREBBP, 73%], hairy cell lymphoma [BRAF, 100%], lymphoplasmacytic lymphoma [MYD88, 98%; CXCR4, 51%], myeloproliferative neoplasm [MPN; AK2, 68%]); (3) distribution of mutations (broad distribution within/across the myeloid/lymphoid lineage for TET2, ASXL1, DNMT3A, TP53, BCOR, and ETV6); (4) correlation of mutations with patient’s age (correlated with older age across entities: TET2, DNMT3A, ASXL1, TP53, EZH2, BCOR, GATA2, and IDH2; younger age: KIT, POT1, RAD21, U2AF2, and WT1); (5) correlation of mutation number per patient with age. Moreover, we observed high frequencies of mutations in RUNX1, SRSF2, IDH2, NRAS, and EZH2 in cases comprising at least 1 DTA (DNMT3A, TET2, ASXL1) mutation, whereas in cases without DTA mutations, TP53, KRAS, WT1, and SF3B1 were more frequent across entities, suggesting differences in pathophysiology. These results give further insight into the complex genetic landscape and the role of DTA mutations in hematological neoplasms and define mutation-driven entities (myelodysplastic syndrome/MPN overlap; secondary acute myeloid) in comparison with entities defined by chromosomal fusions (chronic myeloid leukemia; myeloid/lymphoid neoplasm with eosinophilia).
Introduction
Genetic changes causing aberrant proliferation constitute one of the hallmarks of cancer cells that can be caused by molecular mutations (single nucleotide level) or by translocations, deletions, amplifications, and/or whole chromosome aneuploidy (chromosomal level).1 The type of aberration causing malignant cell transformation depends on the respective cancer.2 In hematological malignancies, molecular mutations play crucial roles in pathogenesis and classification/diagnosis of many types of leukemias and lymphomas, but also chromosomal translocations (eg, BCR-ABL1 in chronic myeloid leukemia[CML]) or aneuploidy (eg, hyperdiploid or hypodiploid acute lymphoblastic leukemia [ALL]) are known to be fundamental for development of the respective diseases.3,4 Although some molecular mutations are known to be very specific for certain entities (eg, BRAF in hairy cell leukemia [HCL], MYD88 in lymphoplasmacytic lymphoma [LPL]),5,6 others were detected in a variety of malignancies (eg, mutations in TP53, TET2, DNMT3A, and RUNX1), often even across the myeloid/lymphoid lineage. Generally, accumulation of mutations in somatic cells during development is also known to be not only one of the reasons for cancer development, but also regarded as a major cause of aging.7,8 Moreover, mutations in some genes (mainly affecting DNMT3A, TET2, and ASXL1) that are known to be present with high frequencies (eg, in patients with acute myeloid leukemia [AML] or myelodysplastic syndrome [MDS]) were also detected in individuals with blood cell parameters in the normal range (clonal hematopoiesis of indeterminate potential [CHIP]) in an age-related manner: CHIP was rarely detected in persons younger than 40 years, but in ∼10% of persons older than 70 years.9 Moreover, individuals with CHIP showed an increased risk of developing hematological neoplasms (∼14-fold higher than in individuals without CHIP),10 which was found to be dependent on clone size, the specific mutation detected and the number of mutations of the genes associated with CHIP.11,12 CHIP was additionally proposed to increase the risk of heart disease, vascular diseases, inflammation, and diabetes,13 as well as to function as a risk factor for therapy-related AML/MDS.14
Thus, to gain further insight into the mutational landscapes of hematological malignancies and their relation to CHIP and aging, we performed a comprehensive large-scale evaluation of the mutational landscape of most hematological cancers. In more detail, we performed (1) a comprehensive analysis and comparison of the mutation frequencies of 122 selected genes in 3096 cases with 28 different hematological malignancies for identification of “mutation-driven” entities, (2) a correlation analysis of DTA mutations (ie, mutations in DNMT3A, TET2, and ASXL1) with mutational landscapes and (3) correlation of the mutation frequencies with the age of the respective patients. The project was intended as a “real-world analysis” providing a reference for the mutational landscape in hematological malignancies obtained from an unselected group of patients. Beside the potential implication for diagnostics, age-specific mutations were characterized in several entities. To our knowledge such an analysis has not been performed this large a number of hematological malignancies before.
Material and methods
Patients and samples
For diagnostic workup, 3096 patients diagnosed with 28 different hematological malignancies (Table 1) sent to the MLL Munich Leukemia Laboratory between August 2007 and May 2020 were selected based on sample availability for WGS. Diagnoses (from peripheral blood and/or bone marrow) were confirmed based on morphology, immunophenotype, cytogenetics, and molecular genetics, as previously published.15-17 For analysis of mutation frequencies and for correlation to DTA mutations, the total cohort of 3096 cases was used; for correlation with age of the patients, only cohorts with ≥50 cases were selected, for adequate statistical power (11 different hematological malignancies, 2656 cases; Table 1). For abbreviations of entities used in the text, see Table 1. All patients had given written informed consent to the use of genetic and clinical data according to the Declaration of Helsinki. The study has been approved by the internal review board of the MLL Munich Leukemia Laboratory.
Summary of disease entities and abbreviations
| Entity | Abbreviation | Cases, n | Age (median y, range) | Mutations (median) |
|---|---|---|---|---|
| Myelodysplastic syndrome | MDS | 577 | 73 (23-93) | 2 |
| Myelodysplastic/myeloproliferative neoplasms, unclassifiable | MDS/MPN-U | 10 | 81 (77-85) | 4 |
| Myeloproliferative neoplasms | MPN | 306 | 68 (22-91) | 2 |
| Chronic myeloid leukemia | CML | 94 | 55 (16-85) | 0 |
| Atypical CML | aCML | 50 | 74 (50-92) | 4 |
| Chronic myelomonocytic leukemia | CMML | 24 | 75 (59-89) | 4 |
| Myeloid or lymphoid neoplasms associated with eosinophilia | MLN-eo | 36 | 51 (24-82) | 0 |
| Acute myeloid leukemia | AML | 675 | 68 (18-93) | 2 |
| Secondary acute myeloid leukemia | sAML | 16 | 70 (48-83) | 4 |
| Therapy-associated acute myeloid leukemia | tAML | 16 | 53 (33-73) | 1 |
| Acute undifferentiated leukemia | AUL | 24 | 74 (18-88) | 3 |
| Mixed phenotype acute leukemia | MPAL | 30 | 64 (19-89) | 2 |
| B-cell acute lymphoblastic leukemia | B-ALL | 224 | 54 (0.1-93) | 1 |
| T-cell acute lymphoblastic leukemia | T-ALL | 101 | 37 (11-91) | 2 |
| T-cell neoplasm | T-NHL | 33 | 62 (41-82) | 1 |
| NK cell neoplasm | NK | 40 | 68 (44-87) | 0 |
| B-cell neoplasm | B-NHL | 30 | 71 (46-83) | 1 |
| Burkitt’s lymphoma | BL | 20 | 69 (26-82) | 2 |
| Chronic lymphocytic leukemia | CLL | 263 | 67 (30-94) | 1 |
| Follicular lymphoma | FL | 63 | 54 (43-88) | 3 |
| Mantle cell lymphoma | MCL | 17 | 66 (29-81) | 1 |
| Lymphoplasmacytic lymphoma | LPL | 55 | 70 (42-88) | 2 |
| Hairy cell leukemia | HCL | 45 | 74 (35-86) | 1 |
| Hairy cell leukemia variant | HCL-v | 43 | 71 (42-81) | 1 |
| Monoclonal gammopathy of undetermined significance | MGUS | 12 | 61 (35-87) | 0 |
| Multiple myeloma | MM | 248 | 69 (26-91) | 1 |
| Persistent polyclonal B-cell lymphocytosis | PPBL | 29 | 45 (30-56) | 0 |
| Blastic plasmacytoid dendritic cell neoplasm | BPDCN | 15 | 74 (16-88) | 2 |
Entities highlighted in bold and comprising at least 50 cases were used for association analysis of patient age.
Whole-genome sequencing
Total RNA and genomic DNA were extracted from lysed cell pellets of diagnostic bone marrow or peripheral blood of all 3096 patients using MagNA Pure 96 system with the DNA and Viral Nucleic Acid Large Volume and Cellular RNA Large Volume Kits (Roche, Basel, Switzerland). Library preparation was performed with the TruSeq DNA PCR-Free HT sample preparation kit (Illumina, San Diego, CA) according to the manufacturer’s protocol and 151-bp paired-end sequences were generated on NovaSeq6000 and HiSeqX sequencing instruments (Illumina) with 90× coverage. As matched-normal samples were not available, a mixture of genomic DNA from multiple anonymous donors was used as normal controls. Read mapping and tumor/normal variant calling were performed using Illumina’s Whole-Genome Sequencing (WGS) app, version 5.0, and Tumor Normal app, version 3.0 for analysis of genomic data. WGS reads were mapped to the human reference genome (Ensembl GRCh37) by using Ilumina’s Isaac aligner (iSAAC-03.16.02.19). Structural variations were called with Manta (version 0.28.0). To remove false-positive fusion events, a customized WGS filtering pipeline was applied, with each variant requiring at least 2 paired-read support and PASS or MGE10kb flag. Final analysis was performed only on protein-altering and splice-site variants, as annotated by the Illumina annotation engine.
Mutational analysis and variant filtering
For mutational analysis, data on 122 selected genes were used (supplemental Table 1). Of note, for patients with multiple myeloma, only 29 genes were evaluated because of low coverage (only genes with a coverage per exon >15 were used for analysis). To exclude artifacts, only variants in regions described as high confidence by the Genome in a Bottle Consortium18 were analyzed further. Moreover, genes prone to generate artifacts by their location in problematic genomic regions were excluded from further analysis.19 To remove potential germline variants, each variant was queried against the gnomAD database,20 and variants with global population frequencies >0.0005 where excluded. Moreover, variants were eliminated if a germline origin was suggested by ClinVar and/or the COSMIC database,21 and, simultaneously, a variant allele frequency (VAF) ranging from 0.45 to 0.55 was detected. In addition, only mutations with a HePPY (Hematological Predictor of Pathogenicity) score of >0.5 were used for this cohort.22
Statistical analysis
Statistical analyses were performed using SPSS (version 19.0.0) software (IBM Corporation, Armonk, NY). For correlation analysis, the Pearson correlation coefficient (bivariate correlation) was used. For comparison of median values, the independent-samples Student t test was applied (SPSS). All reported P-values are 2-sided and were considered significant at P < .05.
Results
Numbers of mutations and mutational patterns
Entities with the highest numbers of mutations detected in the 122 selected genes (median, n = 4), and thus with potentially the largest impact of mutations on pathogenesis, comprised several MDS/MPN overlap entities (aCML [range, 1-7 mutations], CMML [range, 1-6 mutations], MDS/MPN-U (range, 2-5 mutations], and sAML cases [range, 2-8]). By contrast, the lowest numbers (median, n = 0) of mutations were observed for CML (range, 0-3), MGUS (range, 0-2), MLN-eo (range, 0-3), NK cell neoplasm (range, 0-3), and PPBL (range, 0-2). In the total cohort of 3096 cases, the most frequently mutated genes were TET2 (14%), ASXL1 (13%), TP53 (10%), SF3B1 (9%), DNMT3A (9%), and SRSF2 (9%). Entities with very high frequencies of specific mutations (>50%) comprised aCML (ASXL1, 86%), BPDCN (TET2, 67%), BL (TP53, 60%), CMML (TET2, 67%; ASXL1, 58%), FL (KMT2D, 87%; CREBBP, 73%), HCL (BRAF, 100%), LPL (MYD88, 98%; CXCR4, 51%), MDS/MPN-U (ASXL1, 60%), MPN (JAK2, 68%), B-NHL (TP53, 50%), and T-NHL (STAT3, 52%; Figures 1 and 2). Mutations additionally enriched in distinct entities included SETBP1 (predominantly in MDS/MPN overlaps, 26%), CSF3R (30% in MDS/MPN-U), STAT3 (only in T-NHL and NK cell neoplasm, 52% and 23%, respectively), NOTCH1 and PHF6 (T-ALL, 38% and 30%) and MYC and ID3 (almost exclusively in BL, 30% each; Figures 1 and 2). Regarding the occurrence of mutations in myeloid and lymphoid neoplasms, genes predominantly mutated in myeloid neoplasms comprised SF3B1 (with the exception of CLL), JAK2, NPM1, RUNX1, IDH2, CEBPA, STAG2, NF1 and GATA2. By contrast, mutations in KMT2D, MYD88, ARID1A, ATM, CXCR4, BIRC3, and CD79B were detected almost exclusively in lymphoid malignancies (Figure 1). Genes with high mutation frequencies in plasma cell neoplasms included mainly NRAS and KRAS, although mutations in these 2 genes were also detected in a variety of other entities. Of note, only 29 genes were evaluated in MM samples because of low coverage, hence conclusions on the mutational landscape in patients with MM are limited. A broad distribution across entities was observed for mutations in TET2 and ASXL1 (although both were enriched in myeloid neoplasms, especially in MDS/MPN overlaps), DNMT3A and TP53 (with a high mutation frequency in B-NHL and BL), BCOR, and ETV6. Thus, the first 3 (DTA genes), were mutated with high frequencies also occurring in lymphoid neoplasms. In line with this finding, gene mutations in the largest number of entities comprised DNMT3A (n = 23 entities); TET2 (n = 21); ASXL1, TP53, NRAS (n = 19 each); and KRAS and BCOR (n = 17 each).
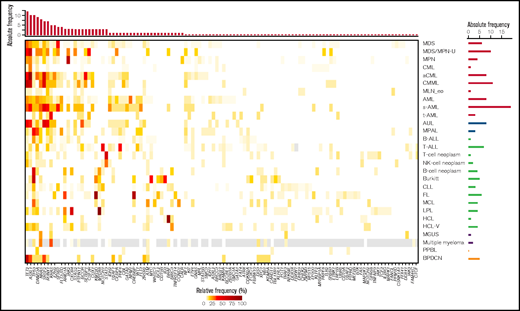
Overview of the detected mutation frequencies in the 28 analyzed entities. The color indicates the frequency of the respective mutation in each entity. Gray, NA. The top bar plot indicates the number of entities in which the respective gene shows a mutation frequency of >10%; the genes are sorted accordingly. The bar plot on the right depicts the total number of genes that are mutated with a frequency of >10% in the respective entity.
Overview of the detected mutation frequencies in the 28 analyzed entities. The color indicates the frequency of the respective mutation in each entity. Gray, NA. The top bar plot indicates the number of entities in which the respective gene shows a mutation frequency of >10%; the genes are sorted accordingly. The bar plot on the right depicts the total number of genes that are mutated with a frequency of >10% in the respective entity.
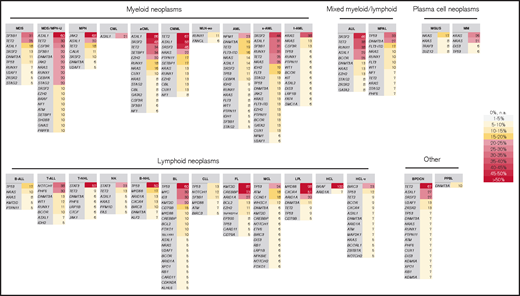
Summary of most frequently mutated genes per entity. All genes with a mutation frequency of >5% are depicted. Color code corresponds to the frequency level. The entities are sorted according to classification into myeloid, lymphoid, mixed, plasma cell neoplasm, and other.
Summary of most frequently mutated genes per entity. All genes with a mutation frequency of >5% are depicted. Color code corresponds to the frequency level. The entities are sorted according to classification into myeloid, lymphoid, mixed, plasma cell neoplasm, and other.
We moreover analyzed a potential correlation of mutation frequencies with the sex of the patients (only mutations with a total mutation frequency of > 2% were used for this investigation). Interestingly, some mutations were found to occur predominantly in female patients (DNMT3A; 12% in female vs 7% in male patients; P < .001; NPM1; 7% vs 5%; P = .002), whereas other were correlated with male sex, comprising several genes the function in splicing (ASXL1, 9% vs 15%, P < .001; PHF6, 1% vs 3%, P = .008; SF3B1, 8% vs 10%, P = .036; SRSF2, 5% vs 11%, P < .001; U2AF1, 2% vs 4%, P = .007; and ZRSR2, 0% vs 3%, P < .001).
Mutation patterns in cases with and without DTA mutations
Further, we compared the mutational patterns of cases with at least 1 DTA mutation (DNMT3A, TET2, and ASXL1; n = 920 cases in the total cohort) to cases without such mutations (n = 2176) to decipher CHIP-correlated patterns of the accompanying mutations. Significant differences with respect to accompanying mutations were detected mainly in myeloid neoplasms (MDS, mutations in genes [n = 12] significantly different in cases with at least 1 DTA mutation compared with cases without DTA mutations, without DTA genes themselves; AML, n = 7; MPN, n = 5; aCML, n = 2; CMML, n = 1) but also in MPAL (n = 3); T-ALL (n = 2); and B-ALL, FL, and LPL (n = 1) (Figure 3). In more detail regarding the affected genes, mutations in TP53 were found significantly enriched in cases without DTA mutations in 4 different entities (aCML, AML, MDS, and MPAL), moreover mutations in KRAS, WT1, and SF3B1 were more abundant in cases without DTA mutations (cases of CMML, AML, and aCML). By contrast, cases with DTA mutations were characterized by high frequencies of mutations in RUNX1 (n = 4 entities: AML, B-ALL, MDS, and MPN), SRSF2 (n = 3; AML, MDS, and MPN), IDH2 (n = 3; AML, MDS, and T-ALL), NRAS (n = 3; MDS, MPAL, and T-ALL) and EZH2 (n = 2; MDS and MPN). Mutations that were found to be more abundant in cases with DTA mutations in 1 entity each included IDH1 and U2AF1 (both in AML); FAT4 (FL); UBR5 (LPL); BRCC3, CBL, DHX29, NF1, SH2B3, and STAG2 (all in MDS); FLT3 (MPAL); and CSF3R and MPL (both in MPN) (Figure 3). The median VAF of DNMT3A, TET2, and ASXL1 in the total cohort was 42.7, 40.5, and 41.3, respectively (range, 1.2-93.5, 1.1-66.7, and 2.7-100, respectively). The median VAF of the genes that were recurrently found to be differentially associated with and without DTA genes comprised TP53 (46.9, in cases with at least 1 DTA mutation, vs 59.8, in cases without DTA mutations), RUNX1 (43.9 vs 43.2), SRSF2 (45.8 vs 42.1), IDH2 (43.2 vs 42.2), NRAS (36.5 vs 27.1), and EZH2 (48.0 vs 15.4). In more detail, comparison of the medium VAFs of certain genes with DTA genes in distinct entities suggest that mutations in EZH2 in MDS; mutations in NRAS in AML, B-ALL, MDS, and MPN; and TP53 mutations in T-ALL may have occurred after a preceding CHIP, whereas mutations in EZH2 in T-ALL and mutations in TP53 in AML showed a high VAF and thus was unlikely to have evolved after CHIP (supplemental Figure 1).
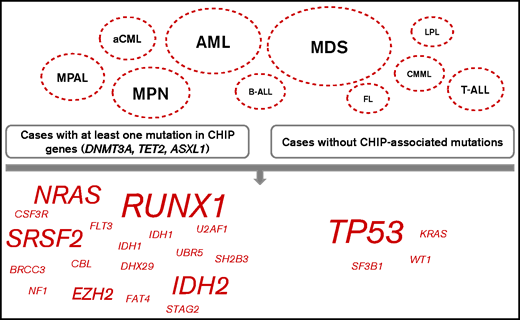
Mutational patterns in relation to DTA mutations. Comparison of the mutational patterns of cases with at least 1 DTA mutation (DNMT3A, TET2, ASXL1; left panel) with cases without such mutations (right panel). The depicted entities are the ones in which certain mutations (shown on the bottom, script size indicates the number of entities with changes in this mutation) with significantly different frequencies dependent on presence of DTA mutations were found.
Mutational patterns in relation to DTA mutations. Comparison of the mutational patterns of cases with at least 1 DTA mutation (DNMT3A, TET2, ASXL1; left panel) with cases without such mutations (right panel). The depicted entities are the ones in which certain mutations (shown on the bottom, script size indicates the number of entities with changes in this mutation) with significantly different frequencies dependent on presence of DTA mutations were found.
Correlation of number and frequencies of molecular mutations with the patient’s age
As expected, the age of the analyzed cohorts differed strongly, ranging from 37 years (median; range, 11-91 years) in T-ALL to 81 years in MDS/MPN-U (77-85 years) (Table 1). For further analysis on age relation and distribution, only cohorts with ≥50 cases were used (2656 patients, 11 entities: aCML, AML, B-ALL, CLL, CML, FL, LPL, MDS, MPN, MM, and T-ALL [Table 1]). Analysis of the relative number of patients in each decade in these 11 entities revealed that, for many entities, a peak in decade 7 (70.0-79.9 years; aCML, AML, MDS, LPL, MPN, and MM) or decade 6 (B-ALL and CLL) was detected. By contrast, patients with FL showed a peak in decade 4, and those with T-ALL in decade 2, whereas age distribution was found to be uniform in patients with CML (supplemental Figure 2).
In this selected cohort of 2656 patients, 5709 mutations in the 122 analyzed genes were detected. Younger patients showed a lower median number of mutations than older patients (median number of mutations for patients ≤60 years, 1; >60 years, 2; P < .001). An association between age and the number of mutations per patient was detected for the total cohort (P < .001) and for AML (P < .001), B-ALL (P = .015), CLL (0.039), MDS (P < .001), MPN (P < .001), and T-ALL (P = .005), but not for aCML, CML, FL, LPL, and MM. This effect was less pronounced when CHIP-related genes (ASXL1, DNMT3A, and TET2) were omitted from the cohort and was then merely detected for the total cohort, AML, and MDS cases (total cohort, P = .025; AML, P = .001; and MDS, P = .001). When mutation frequencies of the 122 analyzed genes were correlated with age, the strongest influence was found for AML, as 17 genes were mutated in an age-related manner: mutations in KIT, POT1, RAD21, U2AF2, and WT1 correlated significantly with younger age, whereas for ASXL1, BCOR, BCRR3, DNMT3A, ETV6, IDH2, RUNX1, SRSR2, TET2, TP53, U2AF1, and PHF6, a significant correlation with older age was observed (Figure 4; supplemental Figure 3). Of note, some mutations correlating with younger age were associated with an aberration known to occur more frequently in younger age; for example, the majority of the KIT mutations in AML were associated with t(8;21)(q22;q22)/RUNX1-RUNX1T1 or inv(16)(p13q22)/CBFB-MYH11 (22 of 25 cases; 88%), a similar observation was detected for RAD21 in AML (associated with t(8;21) in 8 of 19 cases, 42%). Age-dependent mutational profiles were also detected for CLL, B-ALL, MDS, MPN, T-ALL, FL, MM, and LPL (Figure 4; supplemental Figure 3). No age-dependent differences in mutational patterns were detected for aCML and CML. Thus, the genes that were found to be mutated in most entities in older patients comprised TET2 (n = 6 entities); TP53 (n = 4); DNMT3A (n = 3); and ASXL1, BCOR, EZH2, GATA2 and IDH2 (n = 2). By contrast, POT1 was found to be preferentially mutated in younger patients in 2 entities (AML and LPL). Moreover, for some mutations, the relation to patient age was entity specific: PHF6 mutations correlated with younger age in CLL (median age, mutated vs unmutated, 43 years vs 67 years; P = .04), but to older age in AML (74 years vs 68 years; P = .007), similar to CD79B (older age, CLL; 93 years vs 67 years; P = .015; younger age, LPL, 52 years vs 71 years; P = .023), and NRAS (older age, T-ALL, 75 years vs 34 years, P < .001; younger age: B-ALL, 63 years vs 69 years, P = .009; MM, 65 years vs 70 years, 0.042; supplemental Figures 4 and 5). Of note, T-ALL patients with mutations in DNMT3A or TET2 were clearly older than patients without such mutations (DNMT3A, median age 75 vs 33 years; TET2, 74 vs 37 years).
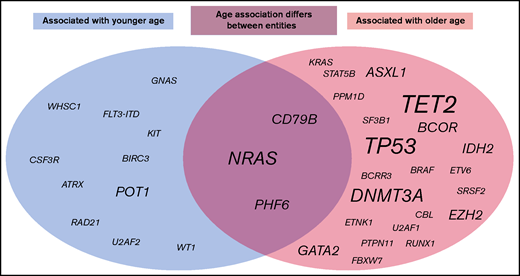
Graphic summary of age-associated molecular mutations. The circles include all mutations across all entities that were found to be associated with younger age (gray, left ide) or older age (light red, right) or for which the age association was found to differ between entities (middle). Script size indicates the number of entities with changes in this mutation.
Graphic summary of age-associated molecular mutations. The circles include all mutations across all entities that were found to be associated with younger age (gray, left ide) or older age (light red, right) or for which the age association was found to differ between entities (middle). Script size indicates the number of entities with changes in this mutation.
Discussion
Several genetic alterations are known to be crucial for the development of most cancers, including acquired somatic mutations, structural variations (ie, chromosomal translocations leading to certain gene fusions), and copy number variations. In the present study, we comprehensively analyzed the frequencies and distribution of somatic mutations in hematological malignancies (28 different entities, 122 selected genes) to decipher entities that seem to be mainly mutation driven and further investigated the correlation of these mutations to patient age. Thus, we provide a comprehensive large-scale evaluation of the mutational landscape of most hematological cancers that has, to our knowledge, not been performed for such a large number of cases and entities before. Although molecular mutations are known to play important roles in pathogenesis in most hematological neoplasms, our comparative analysis allowed for identification of certain entities that seem to be mainly driven by the acquisition of mutations as primary events causing the diseases, as a high number of molecular mutations was found, including many MDS/MPN overlap cases (comprising aCML, CMML, and MDS/MPN-U), as well as sAML cases (median number of detected mutations, 4). Moreover, also in FL and AUL cases, a high number of mutations (median, 3) were detected. The high number of observed mutations in FL cases is noteworthy, as the hallmark of FL is known to be a chromosomal translocation (t(14;18)(q32;q21)/IGH-BCL2), detectable in ∼90% of all FL cases and leading to overexpression of BCL2.23,24 However, as the IGH-BCL2 rearrangement was also detected by RT-PCR in healthy individuals, it has already been reported that this aberration alone is not sufficient for FL development.25,26 This conclusion is supported by our data, showing an overall large number of mutations in FL patients in comparison with other hematological entities, especially a very high frequency of mutations in KMT2D (87%) and CREBBP (73%), which is in line with previous analysis.27 On the other hand, a very low number of mutations was detected in CML and MLN-eo cases, which are known to be defined by certain translocations as primary events in pathogenesis (CML: t(9;22)(q34;q11)/BCR-ABL1; MLN-eo: rearrangements involving PDGFRA (4q12), PDGFRB (5q31-33), FGFR1 (8p11), and t(8;9)(p22;p24.1)/PMC1-JAK2),28 although molecular mutations may play important roles in progression of these diseases, as well. Thus, a substantial role of molecular mutations in development of these diseases is not likely. Further, molecular mutations were found to be infrequent in patients with MGUS or PPBL, which 2 entities that are known or have been reported to be benign or “premalignant,”29,30 explaining the observed low number of mutations.
Moreover, although certain mutations were found to be very specific or very frequent in certain entities, others showed a broad distribution within or even across the myeloid/lymphoid lineage. Specific/frequent mutations included well-known examples such as MYD88 in LPL, BRAF in HCL and JAK2 in MPN, but also KMT2D and CREBBP in FL, TP53 in BL, ASXL1 in MDS-MPN-U and aCML, and TET2 in CMML and BPDCN. Gene mutations or mutational patterns that occur very frequently in a certain entity could be used in (differential) diagnostics for assignment of a correct diagnosis in difficult cases, as it is already applied for MYD88 mutations in LPL or BRAF mutations in HCL.5,6 Moreover, some of these mutational patterns could in the future potentially be used, together with data on gene fusions and copy number changes, for a WGS-only classification and/or diagnosis of cases. On the other hand, the identification of certain mutations could, independent of the respective diagnosis, be used therapeutically for so-called basket trials, a new type of clinical trial for which eligibility is based on the presence of a specific genomic alteration, irrespective of histology.31 These biomarker-driven trials were already conducted for patients with mutations in KRAS, NRAS, or BRAF (in patients with multiple myeloma, ovarian cancer, colorectal cancer, or non–small-cell lung cancer, for example, or for mutations in IDH1, IHD2, and FGFR2 in patients with, eg, advanced biliary tract carcinoma or glioma).32-34 Thus, data as generated in the present study could provide further therapeutical options for patients otherwise lacking specific treatment possibilities.
It has to be noted, that although TET2 and ASXL1 showed a very high frequency in certain entities in our study, they belong to the genes that depicted the broadest distribution across entities and were detected in substantial amounts also in lymphoid malignancies. As TET2 and ASXL1, together with DNMT3A, belong to the group of genes known to be associated with CHIP,9 it can be postulated that CHIP plays a role in these entities. Interestingly, previous analysis35 of the genomic profiles of ultra-stable CLL, low-count MBL (monoclonal B-cell lymphocytosis) and patients with high-count MBL revealed striking similarities and further suggested that at least some somatic mutations may have occurred before the onset of CLL or even before MBL, similar to CHIP occurring before MDS. In addition, mutational profiles of these ultrastable CLL cases seemed to differ from CLLs with a more rapid progression and were characterized by infrequent CLL driver gene mutations and by noncoding variants targeting key pathways/cellular processes relevant to normal and neoplastic B-cell development.35 This observation of different molecular patterns is also supported by our data, as we deciphered differences in the mutation patterns of cases with vs without CHIP-associated mutations across all entities. Cases with at least 1 DTA mutation showed an enrichment of mutations in RUNX1, SRSF2, IDH2, NRAS, and EZH2, whereas cases without DTA mutations were mainly characterized by frequent mutations in TP53, but also in KRAS, WT1, and SF3B1, suggesting differences in pathophysiology of cases, with and without mutations in DTA genes. Of note, these observations were made, not only for myeloid malignancies such as MDS and AML, but also for other entities, including T-ALL and B-ALL. Correlation of mutation frequencies to patient age revealed the well-known association of the DTA mutations (DNMT3A, TET2, and ASXL1) to older age across entities, but other genes were also found to show this correlation (eg, TP53, EZH2, BCOR, GATA2, and IDH2). A lower number of mutations were correlated with younger patient age, which could in many cases be explained by association with other age-related aberrations. Interestingly, some mutations show varying age-relation dependent on the entity (eg, PHF6 mutations; CLL, younger age; AML, older age; T-ALL, equal distribution; supplemental Figure 5), proposing differences in mutation mechanisms or selection dependent on the respective entity. PHF6 is a tumor-suppressor gene with a proposed role in transcriptional regulation and/or chromatin remodeling and was found to be mutated frequently in T-ALL (∼20% of cases) and more rarely in AML cases (3%) where it was found to be associated with an immature morphology (FAB subtypes M0-M2).36-38 So far, PHF6 mutations have not been described in CLL cases; thus their role in CLL pathogenesis and association with younger age in these patients could be further evaluated.
Taken together, our data give further insight into the different mutational landscapes of leukemias and lymphomas and into their interrelation with aging, providing additional insight on different pathogenesis pathways of hematological cancer. Moreover the results indicate that CHIP may play a greater role in a higher number of hematological malignancies than so far anticipated and it characterizes the relationship between DTA mutations and other mutations in more detail. In addition, we hope that this “real-world analysis” of a large number of patients comprising most hematological cancers may help improve classification and/or diagnosis of particularly ambiguous cases on the one hand and add therapeutic molecular-based options for patients otherwise lacking specific treatment possibilities on the other hand (basket trials), thus providing a source for the researcher as well as the clinician.
Acknowledgments
The authors thank all coworkers at the MLL Munich Leukemia Laboratory for their dedicated work and all the physicians for providing the samples, caring for the patients, and collecting the data.
Authorship
Contribution: A.S. and C.H. designed the study and were responsible for chromosome banding and FISH analyses; A.S. interpreted the data and wrote the manuscript; A.S., C.H., W.W., C.B., and M.M. performed the molecular and bioinformatic analyses; W.K. performed the immunophenotyping; T.H. conducted the cytomorphologic analyses; and all authors read and contributed to the final version of the manuscript.
Conflict-of-interest disclosure: C.H., W.K., and T.H. declare part ownership of the MLL. A.S., W.W., C.B., and M.M. are employed by the MLL.
Correspondence: Anna Stengel, MLL Munich Leukemia Laboratory, Max-Lebsche-Platz 31, 81377 Munich, Germany; e-mail: anna.stengel@mll.com.

