

Key Points
Heterozygous mutations in the SLFN14 AAA domain cause species-specific differences in platelet and erythroid lineage commitment.
SLFN14K208N/+ mice display pronounced microcytic erythrocytosis and anemia resulting from defective red blood cell formation.

Abstract
Schlafen 14 (SLFN14) has recently been identified as an endoribonuclease responsible for cleaving RNA to regulate and inhibit protein synthesis. Early studies revealed that members of the SLFN family are capable of altering lineage commitment during T-cell differentiation by using cell-cycle arrest as a means of translational control by RNase activity. SLFN14 has been reported as a novel gene causing an inherited macrothrombocytopenia and bleeding in human patients; however, the role of this endoribonuclease in megakaryopoiesis and thrombopoiesis remains unknown. To investigate this, we report a CRISPR knock-in mouse model of SLFN14 K208N homologous to the K219N mutation observed in our previous patient studies. We used hematological analysis, in vitro and in vivo studies of platelet and erythrocyte function, and analysis of spleen and bone marrow progenitors. Mice homozygous for this mutation do not survive to weaning age, whereas heterozygotes exhibit microcytic erythrocytosis, hemolytic anemia, splenomegaly, and abnormal thrombus formation, as revealed by intravital microscopy, although platelet function and morphology remain unchanged. We also show that there are differences in erythroid progenitors in the spleens and bone marrow of these mice, indicative of an upregulation of erythropoiesis. This SLFN14 mutation presents distinct species-specific phenotypes, with a platelet defect reported in humans and a severe microcytic erythrocytosis in mice. Thus, we conclude that SLFN14 is a key regulator in mammalian hematopoiesis and a species-specific mediator of platelet and erythroid lineage commitment.
Introduction
Endoribonucleases are a family of proteins responsible for cleaving RNA to regulate and inhibit protein synthesis.1 The Schlafen (SLFN) family of proteins/genes is made up of 10 mouse and 6 human SLFN genes, all of which possess a characteristic AAA domain coding for DNA helicases, transcription regulators, protein folding regions, and a distinctive SLFN box of unknown function.2 SLFN proteins are divided into 3 subgroups and are highly homologous, classified based on their increasing length. Subgroups II and III contain the aforementioned regions and a SWADL region, whereas subgroup III also possesses an additional helicase region ∼ 400 aa.2-5
Reported roles for the SLFN family of proteins include translational control by RNase activity (SLFN14), transfer RNA cleavage as part of the DNA damage response in tumor cells, and T-cell lineage and commitment (SLFN1).6 Recently, SLFN14 mutations have been reported in 5 unrelated families worldwide who present with macrothrombocytopenia and associated excessive bleeding.7-11 Patients with these mutations have a platelet function defect in response to adenosine diphosphate, collagen, and PAR1-peptide and decreased platelet adenosine triphosphate secretion.7 Further investigation discovered that SLFN14 colocalizes with ribosomes and causes endoribonucleolytic degradation of ribosomal RNA in cells.12 These data, coupled with expression data from several databases, suggest that SLFN14 is responsible for cleavage and regulation of critical RNAs in megakaryocytic and erythroid differentiation. Regulatory RNAs are thought to be critical in hematopoietic lineage commitment, with unique RNA signatures reported in multipotent and bipotent progenitors.13-15 Pisareva et al revealed that SLFN14 is associated with cleaving RNA and ribosome-bound messenger RNA (mRNA) in an Mg2+-dependent and nucleotide triphosphate (NTP)–independent manner.16 Recent evidence in primary human cells from platelet and erythroid lineages suggests that SLFN14 may function in a similar way in cleaving RNA from the ribosomal unit prior to splitting, influencing hemoglobin production during blood cell development.17
Despite these insights, the mechanistic role of SLFN14 in megakaryocyte (MK) development and hemostasis is unknown. To address this, we generated a global CRISPR-mediated knock-in (KI) mouse model of the patient mutation K219N missense substitution (mouse K208N homolog), which is known to cause thrombocytopenia, and investigated its overall role in hematopoiesis and platelet function. Homozygous KI mice for this mutation (SLFN14K208N/K208N) did not survive to weaning and, similarly, SLFN14 mutations identified in humans are all of a heterozygous nature; therefore, heterozygous mice were used in all experiments compared with litter-matched wild-type controls (SLFN14K208N/+ and SLFN14+/+, respectively). We investigated the SLFN14 K208N mutation through hematological analysis, platelet activation, function, and its overall role in hematopoiesis. SLFN14K208N/+ mice showed significant differences from SLFN14+/+ mice in gross hematological analyses. However, unlike the human variants, these mice demonstrate a major defect in erythropoiesis but not megakaryopoiesis or thrombopoiesis.
Differences in the consequences of this missense mutation suggest that SLFN14 is a species-specific regulator of platelet and erythroid lineage commitment. In humans, the mutation causes a defect in thrombopoiesis, whereas a homologous missense mutation in mice causes a significant defect in erythropoiesis. SLFN14K208N/+ mice present with pronounced microerythrocytosis, hemolytic anemia, splenomegaly, and abnormal thrombus formation in vivo.
Materials and methods
Mice
A SLFN14 K208N–KI mouse was generated in-house using CRISPR-Cas9 gene editing. All mice were generated on a C57BL/6J background and were bred in heterozygote/wild-type pairs. Animal care and welfare were in accordance with United Kingdom Home Office regulations and the use of Animals (Scientific Procedures) Act 1986. Animals were housed at the Biomedical Services Unit at the University of Birmingham.
Genotyping
All mice were genotyped in-house using DNA extraction from mouse ear clips (DNeasy Blood & Tissue Kits; Qiagen, Manchester, United Kingdom). Polymerase chain reaction (PCR) and Sanger sequencing were used to identify SLFN14 K208N–KI mice following the procedure and conditions outlined in supplemental Tables 1 and 2.
Flow cytometry
Flow cytometry was performed on a BD Accuri C6 flow cytometer, and results were analyzed using BD Accuri C6 software. Flow cytometry antibodies are listed in supplemental Tables 4.
Platelet preparation
Mice were exsanguinated under terminal anesthesia by isoflurane/O2 (5%) gas. Blood was drawn from the inferior vena cava, using a 25-gauge needle, into 1:10 (volume-to-volume ratio) acid citrate dextrose anticoagulant. Washed platelets were prepared as described in supplemental Material.
Light transmission aggregometry
Washed platelet counts were normalized to 2 × 10⁸/mL with Tyrode’s-HEPES buffer. Aggregation in 300 µL of platelets was measured using a lumi-aggregometer (Chrono-Log, Havertown, PA) at 37°C under stirring conditions (1200 rpm) for 6 minutes post–agonist addition.
Platelet spreading
Washed platelets at 2 × 10⁷/mL were incubated for 45 minutes on collagen-coated (10 µg/mL) and fibrinogen-coated (100 µg/mL) coverslips under resting or preactivated conditions (0.1 U/mL thrombin). Adhered cells were fixed with 10% formalin, permeabilized, and stained with Alexa Fluor 488–conjugated phalloidin. Images were captured on a Zeiss Epifluorescence microscope and analyzed using a semiautomated machine learning–based workflow.18,19
Hemostasis assay
All experiments were double blinded and conducted on 20 to 29g SLFN14K208N/+ and litter-matched wild-type mice. Mice were anesthetized using isoflurane/O2 (5%) gas, and 2 to 3 mm of tail tip was excised using a sterile razor blade and placed in prewarmed saline (37°C). Time until first cessation of bleeding was recorded.
Clot retraction
Platelet-rich plasma (PRP) from SLFN14K208N/+ and SLFN14+/+ mice was adjusted to a final concentration of 2 × 10⁸/mL using platelet-poor plasma and Tyrode’s-HEPES buffer supplemented with 2mM CaCl2, as previously described.20 Erythrocytes were added for visualization, and clot formation was stimulated by 1 U/mL thrombin. Clots were monitored every 30 minutes for 2 hours, and clot weight and volume were calculated.
In vivo thrombosis assays
Laser-induced injury of cremaster arterioles and FeCl3-induced injury of carotid arteries were performed and analyzed as previously described.21
Histological analysis
Spleens and decalcified bones were embedded in paraffin wax and sectioned at 5 µm prior to staining with hematoxylin and eosin (H&E) and Perls Prussian blue. Sections were scanned using a Zeiss Axio ScanZ1 slide scanner (Carl Zeiss Ltd., Cambridge, UK). The number of MKs was counted in 10 fields of view taken from 2 femur sections and 1 spleen section per mouse. Sectioning and image analysis were performed double blinded.
Spleen and bone marrow progenitor flow cytometry
Spleens were homogenized and whole bone marrow was flushed from mouse femurs and tibias in 1% fetal bovine serum and 2 mM EDTA in phosphate-buffered saline. Cells were filtered through a 70-µm cell strainer and stained with antibodies as per supplemental Table 4. A total of 50 000 events was collected using a BD Accuri C6 flow cytometer and gated to eliminate dead and cell doublets. Cells were imaged on poly-l-lysine coated coverslips using a Zeiss LSM880 confocal microscope.
Statistical analysis
Data are presented as mean ± standard error of the mean (SEM), unless stated otherwise. A Student t-test and 2-way analysis of variance were used for platelet activation, and a Mann-Whitney U test was used for in vivo analysis, with P < .05 deemed significant. All analyses were conducted using GraphPad Prism software (v8.4).
Animal care and welfare were in accordance with United Kingdom Home Office regulations and the use of Animals in Scientific Procedures Act 1986 under Project License number P53D52513 (to N.V.M.).
Results
SLFN14 K208N homozygotes do not survive to weaning because of severe anemia
An in-house CRISPR-KI model was developed using homology directed repair (HDR). Human oligonucleotide donor templates of the K219N mutation were coinjected with single guide RNA as per the CRISPR-Cas9 mechanism (Figure 1A). This resulted in the G>T substitution and subsequent K208N amino acid change. Sanger sequencing was used to genotype mice, with Figure 1B showing successful KI of the mutation. A χ2 analysis of heterozygote/heterozygote breeding pairs shows significant deviation from Mendelian inheritance, with ∼25% of offspring lost preweaning (P < .0001; Figure 1C). The average prewean loss was 25% across 15 litters, the same proportion of expected homozygote offspring according to Mendel’s law (supplemental Table 3). To assess embryonic lethality, embryos were gathered for observation and genotyping at 12.5 and 14.5 days post–vaginal plug. At embryonic day 12.5 (E12.5), SLFN14K208N/+ mice were not different from wild-type littermates. However, SLFN14K208N/K208N embryos were significantly paler, with less-defined vasculature (Figure 1D). E14.5 SLFN14K208N/K208N embryos were much more pale, with substantially less vascular definition than that seen in the other genotypes (Figure 1D). No SLFN14K208N/K208N mice survived to weaning for genotyping; therefore, we can deduce that if SLFN14K208N/K208N pups do survive beyond the critical fetal liver stage at day 14.5, they die shortly after birth. Therefore, in parallel with K219N heterozygous patients, SLFN14 K208N heterozygotes were used in analyses.
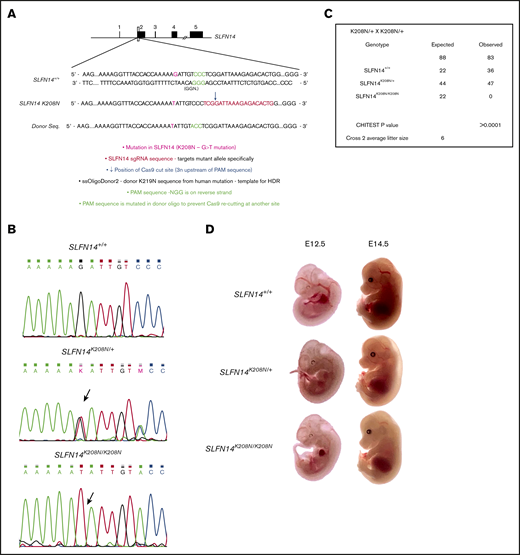
Generation of SLFN14 K208N mice using CRISPR-Cas9 gene editing and embryo development. (A) Schematic diagram of CRISPR-Cas9 gene-editing mechanism using human K219N donor oligonucleotide. (B) Wild-type, SLFN14K208N/+, and SLFN14K208N/K208N traces showing successful KI of G>T missense mutation (arrow). (C) Non-Mendelian inheritance pattern of SLFN14 K208N mice. χ2 square analysis shows significant deviation from Mendelian inheritance and prewean loss of homozygotes (P < .0001). Data are taken from 15 litters of heterozygote/heterozygote (cross 2) breeding pairs. (D) Representative images of backlit embryos taken at E12.5 and E14.5 (original magnification ×3). n = 3 to 9 embryos per genotype.
Generation of SLFN14 K208N mice using CRISPR-Cas9 gene editing and embryo development. (A) Schematic diagram of CRISPR-Cas9 gene-editing mechanism using human K219N donor oligonucleotide. (B) Wild-type, SLFN14K208N/+, and SLFN14K208N/K208N traces showing successful KI of G>T missense mutation (arrow). (C) Non-Mendelian inheritance pattern of SLFN14 K208N mice. χ2 square analysis shows significant deviation from Mendelian inheritance and prewean loss of homozygotes (P < .0001). Data are taken from 15 litters of heterozygote/heterozygote (cross 2) breeding pairs. (D) Representative images of backlit embryos taken at E12.5 and E14.5 (original magnification ×3). n = 3 to 9 embryos per genotype.
SLFN14K208N/+ mice have microcytic erythrocytosis, poikilocytosis, and anemia
SLFN14K219N/+ patients exhibit macrothrombocytopenia; however, we did not observe any difference in platelet count in homologous SLFN14K208N/+ mice, but we did detect an increase in size using a flow cytometry counting assay and single positive events of CD41 and Ter119–stained cells (Figure 2A,Bi-ii; P < .0001). Contrary to the patient mutation, for which no effect on erythrocyte production or function was reported, SLFN14K208N/+ mice exhibit microcytic erythrocytosis, an increase in erythrocyte count accompanied by a reduction in size (Figure 2Biii-iv). We did not observe any difference in leukocyte counts between genotypes (data not shown).
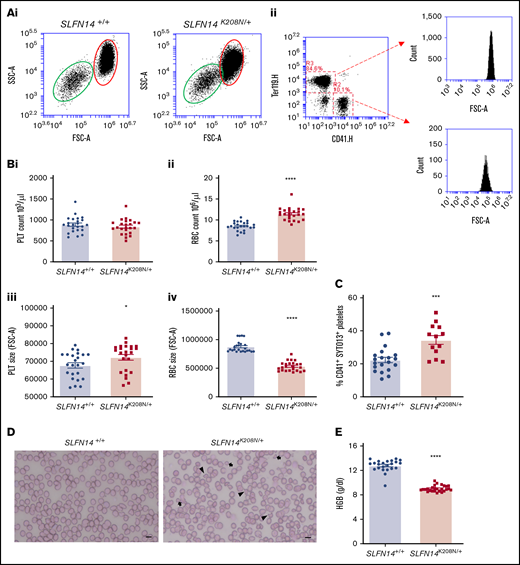
Hematological analysis of SLFN14K208N/+mice. (A) Flow cytometry–based counting of platelets and erythrocytes. (Ai) Flow cytometry forward scatter (FSC) and side scatter (SSC) plots showing size overlap of erythrocyte (red oval) and platelet (green oval) populations. (Aii) Gating method shown for double stain using CD41 (R2) and Ter119 (R3). Representative plots of n = 18 mice per genotype. (B) Platelet (PLT) (i) and erythrocyte (RBC) (ii) count and platelet (iii) and erythrocyte (iv) size from flow cytometry–based counting. Data are mean ± standard error of the mean (SEM); n = 18 mice per genotype. (C) Immature platelet fraction in SLFN14K208N/+ mice. CD41+ platelets were gated, and the immature platelet population was assessed by SYTO13 staining. Data are mean ± SEM; n = 13 to 20 mice per genotype. (D) Whole blood smears from wild-type and SLFN14K208N/+ mice. Blood smears were stained with H&E histological stain to view blood cell size and morphology. Poikilocytes (irregularly shaped cells; arrowheads) and microcytes (arrows) are shown. Representative images of n = 6 or 7 mice per genotype. Scale bar, 10 µm. (E) SLFN14K208N/+ mice are anemic. Hemoglobin levels were measured by an automated hematology analyzer in SLFN14K208N/+ mice and wild-type controls. Data are mean ± SEM; n = 23 to 26 mice per genotype. *P < .05, ***P < .001, ****P < .0001.
Hematological analysis of SLFN14K208N/+mice. (A) Flow cytometry–based counting of platelets and erythrocytes. (Ai) Flow cytometry forward scatter (FSC) and side scatter (SSC) plots showing size overlap of erythrocyte (red oval) and platelet (green oval) populations. (Aii) Gating method shown for double stain using CD41 (R2) and Ter119 (R3). Representative plots of n = 18 mice per genotype. (B) Platelet (PLT) (i) and erythrocyte (RBC) (ii) count and platelet (iii) and erythrocyte (iv) size from flow cytometry–based counting. Data are mean ± standard error of the mean (SEM); n = 18 mice per genotype. (C) Immature platelet fraction in SLFN14K208N/+ mice. CD41+ platelets were gated, and the immature platelet population was assessed by SYTO13 staining. Data are mean ± SEM; n = 13 to 20 mice per genotype. (D) Whole blood smears from wild-type and SLFN14K208N/+ mice. Blood smears were stained with H&E histological stain to view blood cell size and morphology. Poikilocytes (irregularly shaped cells; arrowheads) and microcytes (arrows) are shown. Representative images of n = 6 or 7 mice per genotype. Scale bar, 10 µm. (E) SLFN14K208N/+ mice are anemic. Hemoglobin levels were measured by an automated hematology analyzer in SLFN14K208N/+ mice and wild-type controls. Data are mean ± SEM; n = 23 to 26 mice per genotype. *P < .05, ***P < .001, ****P < .0001.
SLFN14K219N/+ patients have a high immature platelet fraction (IPF).7 We assessed IPF in SLFN14K208N/+ mice using a flow cytometry method and nucleic acid stain SYTO13, which was recently reported to be a more specific marker than its predecessor, Thiazole orange.22 A 15% increase in the proportion of CD41+SYTO13+ cells was observed in SLFN14K208N/+ mice compared with SLFN14+/+ controls (Figure 2C; P = .0003). Combined with the observed increase in platelet size, these data indicate an increase in the proportion of immature platelets in SLFN14K208N/+ mice.
Whole blood smears from SLFN14K208N/+ mice show irregularly shaped smaller erythrocytes (poikilocytes and microcytes) compared with the characteristic plump-shaped cells observed in wild-type controls (Figure 2D). This microcytosis is accompanied by lower hemoglobin levels in SLFN14K208N/+ mice (Figure 2E).
These results and previous work in T-cell lineage commitment studies identify SLFNs as key drivers in species-dependent hematopoietic lineage commitment. In this case, we observe SLFN14 mutations causing distinct differences in platelet and erythrocyte production and morphology.3,6
SLFN14K208N/+ mice exhibit normal platelet function in response to major agonists
No alteration in major glycoprotein receptor levels was observed in SLFN14K208N/+ platelets (Figure 3A). Platelet activation was assessed by flow cytometry, and both genotypes displayed similar α-granule secretion (P-selectin) and integrin αIIbβ3 activation (JON/A) in response to agonists at varying doses (Figure 3B). Platelet function in SLFN14K208N/+ mice was assessed using light transmission aggregometry. SLFN14K208N/+ mice display normal platelet function compared with their wild-type littermates in response to the agonists thrombin, collagen, and collagen-related peptide (Figure 3C-E), which are mediated by G protein–coupled receptors and ITAM/receptor tyrosine kinase, and are the 2 main types of activation receptors in platelets.
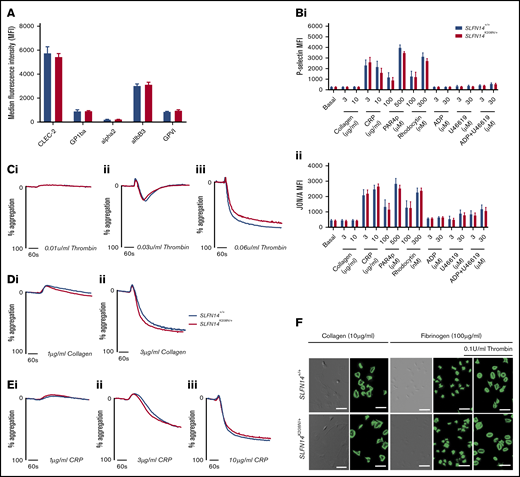
In vitro assessment of platelet function in SLFN14K208N/+mice. (A) Resting platelet surface glycoprotein expression levels. GP1ba+ platelets were costained for the indicated surface receptors in whole blood. Median fluorescence intensity (MFI) from 4 to 6 mice per genotype. Data are mean ± standard error of the mean (SEM); significance was assessed using Welch’s t test for multiple comparisons. (B) P-selectin (i) and activated αIIbβ3 (JON/A) (ii) expression on SLFN14K208N/+ mouse platelets in response to the indicated agonist stimulation. Data are MFI (mean ± SEM) for 9 mice per genotype per condition. Significance was assessed by Sidak’s 2-way analysis of variance. (C) Platelet reactivity in washed platelets in response to 0.01 U/mL (i), 0.03 u/mL (ii), or 0.06 U/mL (iii) thrombin. (D) Platelet reactivity in washed platelets in response to 1 µg/mL (i) or 3 µg/mL (ii) collagen. (E) Platelet reactivity in washed platelets in response 1 µg/mL (i), 3 µg/mL (ii), or 10 µg/mL (iii) collagen-related peptide. Representative traces of 3 to 6 mice per genotype per condition are shown. (F) Platelet spreading and adhesion in SLFN14K208N/+ mice. SLFN14K208N/+ platelets spread on collagen or fibrinogen under resting and thrombin-preactivated conditions (0.1 U/mL thrombin). Representative differential interference contrast and fluorescent phalloidin–stained images are shown from 3 mice per genotype/condition. Scale bar, 10 μm.
In vitro assessment of platelet function in SLFN14K208N/+mice. (A) Resting platelet surface glycoprotein expression levels. GP1ba+ platelets were costained for the indicated surface receptors in whole blood. Median fluorescence intensity (MFI) from 4 to 6 mice per genotype. Data are mean ± standard error of the mean (SEM); significance was assessed using Welch’s t test for multiple comparisons. (B) P-selectin (i) and activated αIIbβ3 (JON/A) (ii) expression on SLFN14K208N/+ mouse platelets in response to the indicated agonist stimulation. Data are MFI (mean ± SEM) for 9 mice per genotype per condition. Significance was assessed by Sidak’s 2-way analysis of variance. (C) Platelet reactivity in washed platelets in response to 0.01 U/mL (i), 0.03 u/mL (ii), or 0.06 U/mL (iii) thrombin. (D) Platelet reactivity in washed platelets in response to 1 µg/mL (i) or 3 µg/mL (ii) collagen. (E) Platelet reactivity in washed platelets in response 1 µg/mL (i), 3 µg/mL (ii), or 10 µg/mL (iii) collagen-related peptide. Representative traces of 3 to 6 mice per genotype per condition are shown. (F) Platelet spreading and adhesion in SLFN14K208N/+ mice. SLFN14K208N/+ platelets spread on collagen or fibrinogen under resting and thrombin-preactivated conditions (0.1 U/mL thrombin). Representative differential interference contrast and fluorescent phalloidin–stained images are shown from 3 mice per genotype/condition. Scale bar, 10 μm.
Hemostasis and thrombosis in SLFN14K208N mice
SLFN14 patients were recruited to studies based on their bleeding phenotypes. To establish whether SLFN14 transgenic mice had a bleeding phenotype, 2 to 3 mm of tail tip was excised, and time to bleeding cessation in prewarmed (37°C) saline was measured. No difference was observed in either genotype, indicating that platelets retain normal function, and abnormal erythrocytes do not impact hemostasis in this model (Figure 4A).
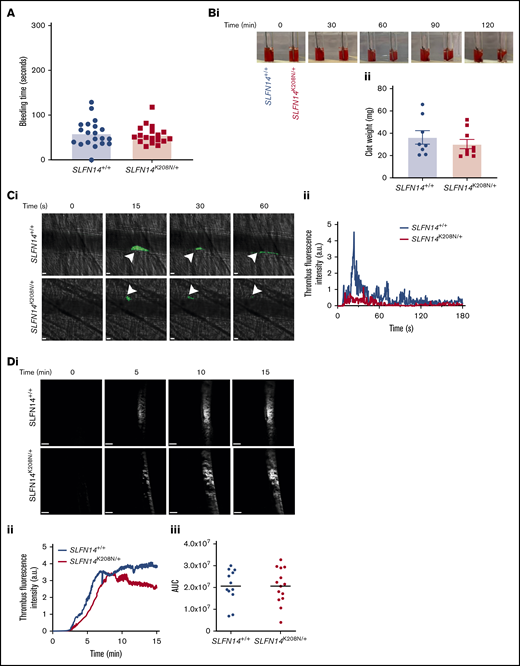
Functional role of SLFN14 in thrombosis. (A) Tail bleeding time assay. Two to 3 millimeters of tail was removed, and bleeding time until first stop was measured. Each data point represents 1 animal; n = 18 to 20 mice per genotype. (B) Clot retraction of SLFN14K208N/+ mouse platelets in PRP. Clots were formed by stimulating 2 × 10⁸ platelets per milliliter with 0.1 U/mL thrombin; monitoring took place for 2 hours. Representative images (Bi) and final clot weight (Bii). Data are mean ± SEM; n = 8 or 9 mice per genotype. (C) Laser-induced thrombus formation in vivo. (Ci) Representative composite brightfield and fluorescence images of thrombus formation. Mice were injected with anti-GPIbβ DyLight488 (0.1µg/g body weight). Arterioles of the cremaster muscle were subsequently injured by laser (arrowheads) and thrombi fluorescence was measured. Scale bars, 10 µm. (Cii) Graph showing median integrated thrombus formation fluorescence intensity in arbitrary units (a.u.) for 31 or 32 injuries in 4 mice per genotype. (D) FeCl3-induced thrombus formation. Mice were injected with DyLight488-conjugated anti-GPIbβ antibody (0.1 µg/g body weight), and the carotid artery was subsequently injured with 10% FeCl3 solution for 3 minutes. (Di) Representative fluorescence images of platelets (GPIbβ). Scale bars, 200 µm. (Dii) Graph showing median integrated thrombus fluorescence. (Diii) Area under the curve (AUC) of the integrated fluorescence density (in a.u). Data are mean; n = 11 or 12 mice per genotype. See supplemental Videos 3 and 4 for wild-type and mutants, respectively.
Functional role of SLFN14 in thrombosis. (A) Tail bleeding time assay. Two to 3 millimeters of tail was removed, and bleeding time until first stop was measured. Each data point represents 1 animal; n = 18 to 20 mice per genotype. (B) Clot retraction of SLFN14K208N/+ mouse platelets in PRP. Clots were formed by stimulating 2 × 10⁸ platelets per milliliter with 0.1 U/mL thrombin; monitoring took place for 2 hours. Representative images (Bi) and final clot weight (Bii). Data are mean ± SEM; n = 8 or 9 mice per genotype. (C) Laser-induced thrombus formation in vivo. (Ci) Representative composite brightfield and fluorescence images of thrombus formation. Mice were injected with anti-GPIbβ DyLight488 (0.1µg/g body weight). Arterioles of the cremaster muscle were subsequently injured by laser (arrowheads) and thrombi fluorescence was measured. Scale bars, 10 µm. (Cii) Graph showing median integrated thrombus formation fluorescence intensity in arbitrary units (a.u.) for 31 or 32 injuries in 4 mice per genotype. (D) FeCl3-induced thrombus formation. Mice were injected with DyLight488-conjugated anti-GPIbβ antibody (0.1 µg/g body weight), and the carotid artery was subsequently injured with 10% FeCl3 solution for 3 minutes. (Di) Representative fluorescence images of platelets (GPIbβ). Scale bars, 200 µm. (Dii) Graph showing median integrated thrombus fluorescence. (Diii) Area under the curve (AUC) of the integrated fluorescence density (in a.u). Data are mean; n = 11 or 12 mice per genotype. See supplemental Videos 3 and 4 for wild-type and mutants, respectively.
Clot retraction was also investigated in PRP to assess αIIbβ3-mediated platelet function. No visual difference was observed during the time course, and final mean clot weight of 36.0 mg and 30.0 mg for SLFN14+/+ and SLFN14K208N/+ mice, respectively, was not significantly different (Figure 4B). This supports our findings that platelet function is maintained and that the SLFN14 K208N mutation in mice does not lead to platelet function defects.
Thrombus formation was assessed in vivo by laser- and FeCl3-induced injury models. Following laser injury, SLFN14K208N/+ mice form thrombi at a similar rate to SLFN14+/+ controls, although they are smaller, with fewer platelets recruited, and embolize more quickly than do those in littermate controls (Figure 4C; supplemental Videos 1 and 2, respectively). FeCl3 injury to the carotid artery resulted in occlusive thrombus formation in both genotypes (Figure 4D; supplemental Videos 3 and 4). Monitoring the accumulation of fluorescently labeled platelets shows that SLFN14K208N/+ mice form thrombi at a slightly slower rate and have a tendency for reduced stability, although these were not statistically different from littermate controls (Figure 4Dii-iii). Ultimately, thrombus formation and stability defects in SLFN14K208N/+ mice are driven by the involvement of other blood cells; together with in vitro platelet function studies, these findings suggest that SLFN14 K208N has only a minor role in mouse platelets.
Splenomegaly in SLFN14K208N/+ mice is due to extramedullary erythropoiesis, the accumulation of mature erythrocytes, and hemolytic anemia
The spleen acts as a major site for filtering and clearance of blood from the circulation. In classical findings of clearance, platelets undergo phagocytosis controlled by their immunoglobulin G–coated surfaces, rendering Fc receptor–directed clearance by macrophages in the spleen.23 The spleen can also act as an additional site of hematopoiesis in the event of myelofibrosis or bone marrow scarring in certain pathologies.24 We investigated the spleen to assess differences in blood cell production and clearance. After controlling for body weight, spleens of SLFN14K208N/+ mice were significantly larger with regard to weight and size compared with those from SLFN14+/+ littermates (Figure 5A). MK counts from histology sections in the spleen were normal, and the proportion of MKs was unchanged between genotypes by flow cytometry analysis (Figure 5B-C).
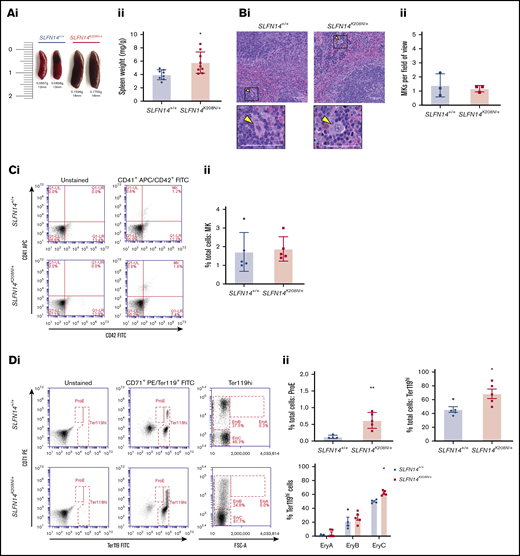
SLFN14K208N/+mice exhibit splenomegaly and extramedullary erythropoiesis. (Ai) Representative images of spleens from SLFN14K208N/+ and SLFN14+/+ mice. (Aii) Normalized spleen weight. Spleen weight/body weight (mg/g) from 8 or 9 mice per genotype. (Bi) Representative images of H&E-stained spleen sections from SLFN14K208N/+ and wild-type controls. Arrowheads indicate MKs. Scale bars, 50 µm. (Bii) Quantification of MK number per field of view. n = 3 mice per genotype, 10 or 11 fields of view per tissue sample. Analysis was conducted blind. (C) Quantification of MKs in spleen. (Ci) MK staining: MKs were identified by CD41 (αIIb) allophycocyanin (APC) and CD42 (GPIb) fluorescein isothiocyanate (FITC) double staining. (Cii) Proportion of MKs in spleen flow cytometry. (D) Quantification of erythroid progenitors in spleen. (Di) ProE staining: ProEs were identified as double-positive CD71 (transferrin receptor 1) phycoerythrin (PE) and Ter119 FITC cells (ProE gate). (Dii) Quantification of ProEs, increased Ter119+ cell population in SLFN14K208N/+ mice, and profile of Ter119hi cells by EryA, EryB, and EryC gates. (E) Quantification of MK-EB–primed MEPs in the spleen: MEPs were identified as a small population positive for CD71 (transferrin receptor 1) PE and CD41 (αIIb) APC (MEP). (Ei) Flow cytometry plots show a slight, but insignificant, increase in MEP cell numbers in SLFN14 K208N mice compared with wild-type. (Eii) MEP quantification. All spleen flow cytometry data and quantification are representative of 4 or 5 mice per genotype/staining condition. (F) Representative images of hemosiderin deposits in spleen sections of wild-type and SLFN14K208N/+ mice highlighted by Perls Prussian blue staining. Scale bars, 50 µm. n = 3 mice per genotype. *P < .05, **P < .01, Student t test.
SLFN14K208N/+mice exhibit splenomegaly and extramedullary erythropoiesis. (Ai) Representative images of spleens from SLFN14K208N/+ and SLFN14+/+ mice. (Aii) Normalized spleen weight. Spleen weight/body weight (mg/g) from 8 or 9 mice per genotype. (Bi) Representative images of H&E-stained spleen sections from SLFN14K208N/+ and wild-type controls. Arrowheads indicate MKs. Scale bars, 50 µm. (Bii) Quantification of MK number per field of view. n = 3 mice per genotype, 10 or 11 fields of view per tissue sample. Analysis was conducted blind. (C) Quantification of MKs in spleen. (Ci) MK staining: MKs were identified by CD41 (αIIb) allophycocyanin (APC) and CD42 (GPIb) fluorescein isothiocyanate (FITC) double staining. (Cii) Proportion of MKs in spleen flow cytometry. (D) Quantification of erythroid progenitors in spleen. (Di) ProE staining: ProEs were identified as double-positive CD71 (transferrin receptor 1) phycoerythrin (PE) and Ter119 FITC cells (ProE gate). (Dii) Quantification of ProEs, increased Ter119+ cell population in SLFN14K208N/+ mice, and profile of Ter119hi cells by EryA, EryB, and EryC gates. (E) Quantification of MK-EB–primed MEPs in the spleen: MEPs were identified as a small population positive for CD71 (transferrin receptor 1) PE and CD41 (αIIb) APC (MEP). (Ei) Flow cytometry plots show a slight, but insignificant, increase in MEP cell numbers in SLFN14 K208N mice compared with wild-type. (Eii) MEP quantification. All spleen flow cytometry data and quantification are representative of 4 or 5 mice per genotype/staining condition. (F) Representative images of hemosiderin deposits in spleen sections of wild-type and SLFN14K208N/+ mice highlighted by Perls Prussian blue staining. Scale bars, 50 µm. n = 3 mice per genotype. *P < .05, **P < .01, Student t test.
Using a similar gating strategy to Koulnis et al, we used CD71 (early erythroid progenitor marker) and Ter119 (mature erythroid marker) to detect erythroid cells and categorized Ter119hi cells according to size (Figure 5Di).25 There was a significant increase in the proportion of proerythroblasts (ProEs) in heterozygotes (CD71+/Ter119+; Figure 5Dii). In these spleens, we did not detect any EryA progenitors in either genotype (Figure 5D). However, despite fairly consistent proportions of Ter119hi cells between genotypes, we observed a difference in the distribution and greater spread of CD71+ cells within the EryB gate and an increase in EryCs (most mature erythroid cells) in heterozygotes that was suggestive of erythroid maturation from the intermediate progenitor within the spleen (Figure 5D). Gating strategy for spleen flow cytometry is detailed in supplemental Figure 1.
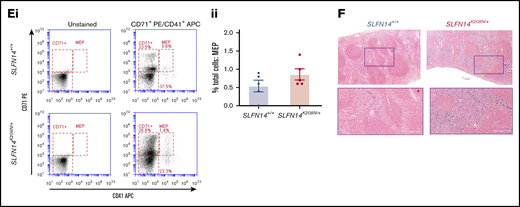
Our flow cytometry progenitor panel aimed to detect megakaryocyte-erythroid progenitors (MEPs). Consistent with previous findings by Psaila et al, we identified 2 subpopulations by differential expression of CD71 and a small MEP population by coexpression of CD41.26 CD71+/CD41+ cells were rare in these samples, consistent with previous findings, although we did detect an almost threefold increase in MEPs in SLFN14K208N/+ mice than in wild-types26 (Figure 5E). In addition, we observed a greater spread of cells within our CD71+ population in contrast to the more clustered appearance in controls.
We discovered substantial hemosiderin staining in lysed erythrocytes. These hemoglobin deposits occur naturally as a result of macrophage-mediated clearance of erythrocytes. Using Perls Prussian blue staining, we see a substantial increase in sites of free heme staining, as indicated by the blue areas in Figure 5F. Interestingly, we see staining in the red and white pulp of SLFN14K208N/+ mice but only red pulp where macrophage clearance occurs in controls. This is also supported by the color difference in heterozygous spleens, which appear significantly darker than SLFN14+/+ spleens (Figure 5Ai). Here, we hypothesize that erythropoiesis is accelerated to compensate for reduced hemoglobin levels. We suggest that SLFN14K208N/+ erythrocytes are more prone to hemolysis and that the spleen acts as a secondary site of hematopoiesis, specifically upregulating erythropoiesis. The spleen also acts in cell clearance; as such, it may be unable to recognize the need for these additional erythrocytes in oxygen transport which, in the case of SLFN14K208N/+ mice, may also be the cause of accelerated hemolysis.
Bone marrow profiles showed significant alterations in erythroid progenitors in SLFN14K208N/+ mice
The main site of hematopoiesis is the bone marrow; therefore, to assess discrepancies in hematopoiesis or altered progenitor levels leading to differences in platelet and erythrocyte counts, we examined bone marrow sections and flow cytometry panels, staining for progenitors. Double-blinded evaluation of bone marrow histology sections revealed that MKs were highly populated within the bone marrow, with morphology, including the characteristic polyploid nuclei, consistent across the 2 genotypes (Figure 6A). We analyzed progenitor levels in flushed whole bone marrow from mouse femurs and tibias by flow cytometry. Live single cells were selected based on size and forward scatter to detect progenitor cells and subsequent double-positive populations (determined by antibody staining) gated for analysis (supplemental Figure 2). MKs were highlighted by CD41+/CD42+ events (MK quadrant); no difference in the percentage of MKs was observed between genotypes (Figure 6B).
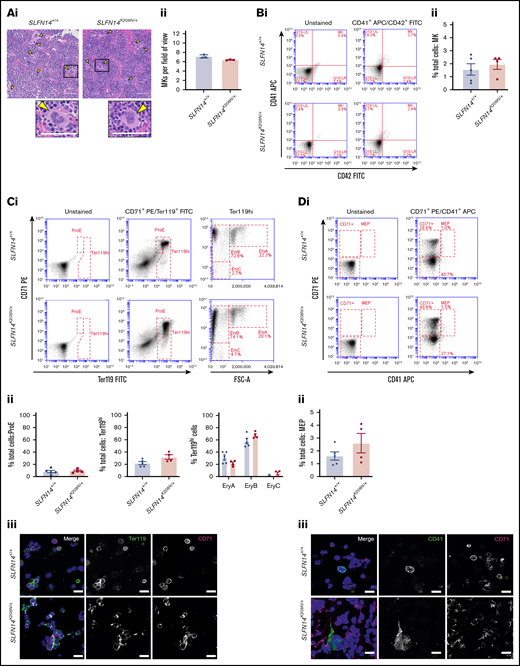
Bone marrow progenitor profile of SLFN14K208N/+mice. (Ai) Representative images of H&E-stained femur sections from SLFN14K208N/+ and SLFN14+/+ mice. Femurs were fixed in 4% formaldehyde and decalcified before sectioning, staining and quantification of MK number per field of view. MKs are indicated by arrowheads. Scale bars, 50 µm. (Aii) Quantification of MK number per field of view from 3 mice per genotype. Two femurs per mouse were sectioned, and 10 to 13 fields of view per section were quantified blind. Students t test was used to assess significance. (B) Quantification of MKs in bone marrow. (Bi) MK staining: MKs were identified by CD41 (αIIb) allophycocyanin (APC) and CD42 (GPIb) fluorescein isothiocyanate (FITC) double staining. (Bii) Quantification of MKs in whole bone marrow by flow cytometry. (C) Quantification of erythroid progenitors in bone marrow. (Ci) ProE staining: ProEs were identified as double-positive CD71 (transferrin receptor 1) phycoerythrin (PE) and Ter119 FITC cells (ProE gate). Maturation of ProEs to mature erythrocytes can be monitored by Ter119hi expression and loss of CD71 expression (EryB and EryC gates). Note the spread of intermediate cells in EryBs, supporting evidence for an altered EryB fate in heterozygotes. (Cii) Quantification of erythroid progenitors in the bone marrow. (Ciii) Confocal images of flow cytometry samples show a double-positive ProE population. Ter119 Alexa Fluor 488 and CD71 Alexa Fluor 647 and DAPI counterstain. Scale bars, 50 µm. (D) Quantification of MEPs in bone marrow. (Di) MK-EB–primed MEPs: MEPs were identified as a small population positive for CD71 (transferrin receptor 1) PE and CD41 (αIIb) APC (MEP). Flow cytometry plots show a slight, but insignificant, increase in MEP cell numbers in SLFN14 K208N mice compared with wild-types. (Dii) MEP quantification in the bone marrow. Staining for these markers highlights MEP cells preferential to the MK or EB lineage. (Diii) Representative images of CD41 Alexa Fluor 488 and CD71 Alexa Fluor 647 stained bone marrow cells imaged by confocal microscopy and using DAPI counterstain. Scale bars, 50 µm. All bone marrow flow cytometry data and quantifications are representative of 4 to 6 mice per genotype/staining condition.
Bone marrow progenitor profile of SLFN14K208N/+mice. (Ai) Representative images of H&E-stained femur sections from SLFN14K208N/+ and SLFN14+/+ mice. Femurs were fixed in 4% formaldehyde and decalcified before sectioning, staining and quantification of MK number per field of view. MKs are indicated by arrowheads. Scale bars, 50 µm. (Aii) Quantification of MK number per field of view from 3 mice per genotype. Two femurs per mouse were sectioned, and 10 to 13 fields of view per section were quantified blind. Students t test was used to assess significance. (B) Quantification of MKs in bone marrow. (Bi) MK staining: MKs were identified by CD41 (αIIb) allophycocyanin (APC) and CD42 (GPIb) fluorescein isothiocyanate (FITC) double staining. (Bii) Quantification of MKs in whole bone marrow by flow cytometry. (C) Quantification of erythroid progenitors in bone marrow. (Ci) ProE staining: ProEs were identified as double-positive CD71 (transferrin receptor 1) phycoerythrin (PE) and Ter119 FITC cells (ProE gate). Maturation of ProEs to mature erythrocytes can be monitored by Ter119hi expression and loss of CD71 expression (EryB and EryC gates). Note the spread of intermediate cells in EryBs, supporting evidence for an altered EryB fate in heterozygotes. (Cii) Quantification of erythroid progenitors in the bone marrow. (Ciii) Confocal images of flow cytometry samples show a double-positive ProE population. Ter119 Alexa Fluor 488 and CD71 Alexa Fluor 647 and DAPI counterstain. Scale bars, 50 µm. (D) Quantification of MEPs in bone marrow. (Di) MK-EB–primed MEPs: MEPs were identified as a small population positive for CD71 (transferrin receptor 1) PE and CD41 (αIIb) APC (MEP). Flow cytometry plots show a slight, but insignificant, increase in MEP cell numbers in SLFN14 K208N mice compared with wild-types. (Dii) MEP quantification in the bone marrow. Staining for these markers highlights MEP cells preferential to the MK or EB lineage. (Diii) Representative images of CD41 Alexa Fluor 488 and CD71 Alexa Fluor 647 stained bone marrow cells imaged by confocal microscopy and using DAPI counterstain. Scale bars, 50 µm. All bone marrow flow cytometry data and quantifications are representative of 4 to 6 mice per genotype/staining condition.
Using CD71 and Ter119 as before, there was no significant difference in the proportion of ProEs in the bone marrow (Figure 6Ci-ii). The percentage of Ter119hi cells was consistent between SLFN14K208N/+ and wild-type mice; within this population, EryA, EryB, and EryC populations were also unchanged between genotypes (Figure 6Ci-ii). As in spleens, we observed the similar “spread distribution” of variable CD71 expression within the EryB gate; however, in contrast, mature erythrocytes (EryC) were rare. Confocal imaging of this staining pattern is shown in Figure 6Cii.
The predecessor to MKs and ProEs is the MEP. Given the differences that we observed in erythroid cell distribution (Figure 6C) and evidence suggestive of a platelet defect in our patient data, we detected megakaryocyte-erythroblast (MK-EB)–primed MEPs using CD71 and CD41, as before. These double-positive primed MEPs are often difficult to detect in situ within the bone marrow (Figure 6Di).26 We did not observe any difference in the proportion of CD71+/CD41+ cells in SLFN14K208N/+ mice (Figure 6Dii). Confocal imaging supports an increase in cellular events in the double-positive channel of heterozygotes and more CD71+ single-stained events (Figure 6Diii). The reason for this shift in the MEP population is yet to be determined; however, we hypothesize that it results from SLFN14K208N/+ MK-EB MEPs being more primed in the erythroid direction, consistent with higher single CD71 positivity in this staining panel (CD71+; Figure 6Di). Increased CD71+ staining may be expansion of the MEP with preference towards the erythroid lineage, as well as due to increased erythroid progenitors after this stage.
SLFN14K208N reduces GATA1 and SLFN14 mRNA levels in hematopoietic cells
To examine whether the K208N mutation led to aberrant expression in hematopoietic cells of SLFN14K208N/+ mice, we measured the abundance of SLFN14 mRNA in whole bone marrow by real-time quantitative PCR. Compared with RNA from wild-type controls, SLFN14 mRNA levels were reduced significantly (by ∼50%) in SLFN14K208N/+ mice (P < .01; supplemental Figure 3).
Furthermore, we considered whether levels of the master transcription factor GATA1 were altered as a result of the K208N mutation. Real-time quantitative PCR was performed to measure GATA1 mRNA levels using cDNA-specific primers for GATA1 and GAPDH as the endogenous control housekeeping gene. GATA1 levels were reduced substantially in RNA from SLFN14K208N/+ mice compared with litter-matched controls (P < .05; supplemental Figure 3). All primers are given in supplemental Table 5.
Discussion
SLFN14 is a poorly studied endoribonuclease with suspected roles in cleaving RNA that may contribute to a reported thrombocytopenia and clinical bleeding in multiple unrelated patients/families. Here, we present a CRISPR KI mutation of K208N in mice and establish the role of SLFN14 as a key player in the lineage-commitment pathway, giving rise to species-specific phenotypes in hematopoiesis. In this study, we analyzed heterozygous mutants, because homozygous mutants did not survive to weaning and showed significant deviation from Mendelian inheritance patterns. This suggests that SLFN14 has a critical role in mouse embryogenesis and, particularly, erythropoiesis. SLFN14 K208N is likely to be particularly relevant in future studies of gene-expression profiling in erythrocytes and anemia. E12.5 and E14.5 homozygous embryos were paler than their littermates, showed less distinct vasculature, and did not survive to weaning. These are most likely due to homozygotes’ more severe anemia and hemolysis that results in death shortly after birth.27
The K208N mutation in mice presents with a different phenotype than in its homologous human version, suggesting that it plays a critical role at the MEP junction in lineage fate decisions. Previous studies found that endoribonuclease function is critical in RNA regulation in various bacterial species; however, to our knowledge, this is the first discovery of endoribonuclease-mediated species differences in mammals.28,29
SLFN14K219N patients have a high IPF, suggesting that thrombopoiesis is not sufficient to maintain steady levels of platelet production or that platelet clearance is accelerated. Platelets contain residual RNA from their predecessors, MKs, which form beaded extensions into the lumen of bone marrow sinusoids (proplatelets) and subsequent shear forces of the bloodstream that cause release of preplatelets and platelets into the blood.30 RNA content can be used to estimate the rate of thrombopoiesis and platelet turnover by measuring the proportion of reticulated platelets within the circulation. An elevated platelet RNA content signifies newer platelets in the circulation that was previously shown to increase platelet reactivity in cardiovascular events and mortality.31 In the case of SLFN14K208N/+ mice, we infer that the slight increase in platelet size is due to their immaturity (determined by SYTO13 staining), but this is not accompanied by increased platelet reactivity, as shown in our in vitro and in vivo experiments.
Although no platelet defects were observed in in vitro functional studies, SLFN14K208N/+ mice exhibited reduced thrombus formation in vivo. These defects in the formation and stability of in vivo thrombi are likely attributable to the abnormal erythrocytes in these mice. Erythrocytes are the primary determinant of blood rheology and promote platelet margination, increasing their concentration near endothelium to enable rapid formation of thrombi in response to vessel damage.32-34 Indeed, previous studies have shown reduced thrombus formation and extended bleeding times in anemic mice.35 Although we did not observe altered hemostasis in SLFN14K208N/+ mice, changes in the size and number of erythrocytes may explain thrombosis findings. Erythrocyte contribution to platelet activation and thrombin generation should also be taken into consideration, together with their unusual role supporting platelet adhesion in the FeCl3 model.35-37 Although SLFN14 patients display excessive bleeding phenotypes, we do not report these similarities in mice.7 Bleeding in SLFN14 patients has been characterized and explained by defects in platelet aggregation, but little to no effect on platelet function was found in SLFN14K208N/+ mice. We believe that this work precedes what is to become extensive research into platelet-erythrocyte interactions in health and disease and reveals potential novel mechanisms in hemolysis and anemia.
In SLFN14K208N/+ mice, we understand that the spleen acts as a secondary site for erythropoiesis. Here, intermediate progenitors (EryBs) differentiate into mature erythrocytes (EryCs), which are highly populated within the spleen. Loss of CD71 expression is indicative of erythrocyte maturation, and the “spread” appearance of EryB cells in heterozygotes clearly shows this maturation phase. This enhanced erythropoiesis is likely due to severe anemia and hemolysis in these mice attempting to compensate for lower hemoglobin levels. The following questions then arise: at what stage in hematopoiesis do SLFN14 and its mutations cause a shift in lineage commitment to platelet or erythroid directions and how, as an endoribonuclease, does SLFN14 mediate this transition? Our bone marrow flow cytometry data did not show any difference in bone marrow MK, ProE, or MEP numbers, but there are discrepancies within progenitors of the erythroid lineage suggesting that, in hematopoiesis, SLFN14K208N/+ leads to altered erythropoiesis and defects in erythroid cells. In the bone marrow, SLFN14K208N/+ Ter119hi cells expressing CD71 also showed variable expression within the EryB gate, whereas wild-type cells present a more clustered distribution. Platelets and erythrocytes originate from a common progenitor; therefore, pinpointing the exact location of this shift is notoriously difficult. However, we believe that using RNA-sequencing of SLFN14 progenitors (MKs, ProEs, and MK/EB-MEPs) will reveal discrepancies in RNA expression profiles to support our preliminary findings that a reduction in GATA1 mRNA is specifically involved in erythroid development. Future work will establish the mechanistic effects of these mutations on human and murine RNA signatures that are critical in lineage commitment. This will uncover novel insights into SLFN14’s ability to cleave RNAs which perturb RNA metabolism and protein synthesis in MK and erythroid lineages in a species-dependent manner.
Data sharing requests should be sent to Neil V. Morgan (n.v.morgan@bham.ac.uk).
Acknowledgments
The authors thank all technicians and staff at Biomedical Services Unit at the University of Birmingham for housing and husbandry of animals used in this study. They also acknowledge Pip Nicolson for expertise in whole blood smear analysis.
Work in the authors’ laboratories is supported by grants from the British Heart Foundation (PG/16/103/32650, FS/18/11/33443) (N.V.M.) and National Institutes of Health, National Institute of General Medical Sciences grant GM097014 (A.V.P.) and National Heart, Lung, and Blood Institute grant HL146544 (A.V.P. and N.V.M.).
Authorship
Contribution: R.J.S., C.W.S., A.O.K., and N.V.M. designed the study, designed and performed experiments, and wrote the manuscript; A.B. generated CRISPR mouse colonies; E.J.H. and S.L. contributed to mouse colony maintenance and experiments; V.P.P., A.V.P., and S.P.W contributed intellectually to the study; and all authors reviewed the manuscript.
Conflict-of-interest disclosure: The authors declare no competing financial interests.
Correspondence: Neil V. Morgan, Institute of Cardiovascular Sciences, College of Medical and Dental Sciences, University of Birmingham, Edgbaston B15 2TT, United Kingdom; e-mail: n.v.morgan@bham.ac.uk.

