

Key Points
Expression of CD200 on low-risk pediatric ALL cells is essential for engraftment and serial transplantation.
In vivo monoclonal antibody therapy against CD200 can reduce disease burden and extend survival in NSG mice.

Abstract
Treating refractory pediatric acute lymphoblastic leukemia (ALL) remains a challenge despite impressive remission rates (>90%) achieved in the last decade. The use of innovative immunotherapeutic approaches such as anti-CD19 chimeric antigen receptor T cells does not ensure durable remissions, because leukemia-propagating cells (LPCs) that lack expression of CD19 can cause relapse, which signifies the need to identify new markers of ALL. Here we investigated expression of CD58, CD97, and CD200, which were previously shown to be overexpressed in B-cell precursor ALL (BCP-ALL) in CD34+/CD19+, CD34+/CD19–, CD34–/CD19+, and CD34–/CD19– LPCs, to assess their potential as therapeutic targets. Whole-genome microarray and flow cytometric analyses showed significant overexpression of these molecules compared with normal controls. CD58 and CD97 were mainly co-expressed with CD19 and were not a prerequisite for leukemia engraftment in immune deficient mice. In contrast, expression of CD200 was essential for engraftment and serial transplantation of cells in measurable residual disease (MRD) low-risk patients. Moreover, these CD200+ LPCs could be targeted by using the monoclonal antibody TTI-CD200 in vitro and in vivo. Treating mice with established disease significantly reduced disease burden and extended survival. These findings demonstrate that CD200 could be an attractive target for treating low-risk ALL, with minimal off-tumor effects that beset current immunotherapeutic approaches.
Introduction
The risk of relapse remains high in pediatric acute lymphoblastic leukemia (ALL), particularly among teenagers and young adults.1,2 Despite the ongoing development of diagnostic and screening technologies, survival rates have remained largely unchanged using conventional therapies, with limited progress for children who do not respond to initial therapy.3 Assessment of measurable residual disease (MRD) levels is the most powerful means of predicting outcome in childhood ALL. Flow cytometry4,5 and, more recently, next-generation sequencing6-8 are increasingly replacing polymerase chain reaction (PCR) as methods of choice for MRD analyses. Next-generation sequencing is the most sensitive and has the advantage of providing more specific readouts of MRD than reverse transcriptase PCR (RT-PCR), and multiple rearrangements can be sequenced in a single run.9,10 Combining MRD analyses with genetic screening has further improved diagnosis, and risk stratification and can lead to better predictions of response.11 As a result of these advances, it has been possible to identify markers with altered expression in leukemia cells, which permits discrimination from normal hemopoietic cells.
Altered expression of certain cell surface antigens and genes in leukemia has been exploited for therapeutic targeting: blinatumomab,12,13 chimeric antigen receptor (CAR) T-cell antigens against CD19,14,15 epratuzumab, and inotuzumab (anti-CD22)16-18 BCL-2 inhibitors. However, a limitation of such therapies is that they affect all cells that express the target antigens, not just leukemia cells. In addition, several studies have shown that some populations of leukemia cells that can establish the disease in murine models, termed leukemia-propagating cells (LPCs), lack expression of CD10, CD19, and CD2219-22 and thus will be unaffected by such therapies. This may be one reason why escape of CD19– cells remains a problem after treatment with CD19 CAR T cells.15,23,24 Consequently, there remains a need to identify new markers that could be used to further define leukemia-associated immunophenotypes.
Genome-wide expression studies and phenotypic discovery platforms have helped to reveal markers related to leukemia-associated immunophenotypes that can be tracked during therapy and could be potential targets for therapy.25-27 Some markers that were overexpressed, such as CD34 and CD58,26,28 had been widely used in MRD analyses, but the addition of some new markers such as CD97 to flow cytometry MRD panels improved the discrimination of normal and leukemia cells.29 CD200 was identified as one of the top 10 differentially regulated genes.25 Interestingly, overexpression of CD200 has also been reported in acute myeloid leukemia (AML),26,28 chronic lymphocytic leukemia (CLL),29 and multiple myeloma.30 It has been associated with inferior outcomes in CLL and was identified as one of the most important therapeutic targets for this malignancy.27 In pediatric ALL, the relevance of these markers has not been investigated in a functional context, so their roles in leukemogenesis are not known. In this study, we explored whether expression of CD58, CD97, or CD200 was a characteristic of ALL cells with in vivo propagating ability and their potential as targets for therapy.
Methods
Samples
The use of human samples was approved by London Brent Research Ethics Committee (12/LO/1193). Animal studies were conducted under license from the United Kingdom Home Office. This study was conducted in accordance with the Declaration of Helsinki.
Bone marrow (BM) cells from children (median age, 4 years; range, 1-17 years) with B-cell precursor ALL (BCP-ALL) (n = 63) at diagnosis or relapse were collected with approval by University Hospitals Bristol and Weston National Health Service Foundation Trust. Patient characteristics are provided in Table 1. Patients from the UKALL 2003 trial were classed as low risk if leukemia cell levels were <0.01% and high risk if levels were ≥0.01% at day 29 of induction.31 In UKALL 2011, low risk represented <0.005% residual disease at day 29 and risk represented ≥0.005% residual disease.32 Patients with MLL rearrangements, near or low haploidy, iAMP21, or t(17;19) were classed as risk. Patients with post-consolidation levels ≥0.5% were deemed high risk and patients with <0.5% were classed as intermediate risk.
Characteristics of patient samples
| Patient ID | Subtype | Karyotype | Age at diagnosis (y) | Sex | Disease status at biopsy | MRD status |
|---|---|---|---|---|---|---|
| 1* | Pre-B | −1 | 2 | F | D | Low |
| 2* | c-ALL | t(12;21) | 7 | F | D | Low |
| 3* | Pre-B | t(1;19) | 4 | F | D | Low |
| 4* | c-ALL | t(9;22), −9 | 7 | M | D | Low |
| 5* | c-ALL | t(12;21) | 8 | F | D | Low |
| 6* | Pre-B | 46 XX | 3 | F | D | Low |
| 7* | c-ALL | t(12;21) | 4 | F | D | Low |
| 8* | c-ALL | Complex | 4 | M | D | Low |
| 9* | c-ALL | t(12;21) | 4 | M | D | Risk |
| 10* | Pre-B | +12,+21 | 2 | M | D | Low |
| 11* | Pre-B | t(9;22) | 15 | M | D | Low |
| 12* | Pre-B | 46 XY | 8 | M | D | Risk |
| 13* | c-ALL | 46 XX | 7 | F | D | Risk |
| 14* | Pre-B | t(12;21) | 4 | F | D | Low |
| 15* | Pre-B | Hyperdiploid | 5 | M | R | N/A |
| 16* | Pre-B | Hyperdiploid | 1 | M | D | Risk |
| 17* | c-ALL | Complex | 5 | M | D | Risk |
| 18* | Pre-B | 46 XY | 7 | F | D | Low |
| 19* | Pre-B | +21 | 2 | M | D | Low |
| 20* | Pre-B | 9p, -21 | 3 | F | D | Low |
| 21* | Pre-B | t(12;21), −12 | 14 | F | D | Low |
| 22 | Pre-B | −9, +10, -18 | 2 | F | D | Risk |
| 23* | c-ALL | t(12;21), −21 | 3 | M | D | Low |
| 24 | Pre-B | +21 | 2 | M | R | Risk |
| 25* | Pre-B | Hyperdiploid | 4 | M | D | Low |
| 26* | c-ALL | Hyperdiploid | 1 | M | D | Low |
| 27 | Pre-B | MLL | 15 | F | D | Risk |
| 28 | Pre-B | t(9;22) | 15 | M | D | Risk |
| 29 | Pre-B | Hyperdiploid | 9 | M | D | Risk |
| 30 | Pre-B | t(12;21) | 6 | F | D | Low |
| 31 | c-ALL | t(12;21) | 5 | F | D | Low |
| 32 | c-ALL | t(9;12) | 3 | F | D | Low |
| 33 | c-ALL | Ph+-like | 5 | F | D | Risk |
| 34 | Pre-B | 46 XX | 17 | F | D | Low |
| 35 | Pro-B | +5 | 16 | M | D | Low |
| 36 | Pre-B | +RUNX1 | 2 | M | D | Low |
| 37 | Pre-B | 46 XX | 16 | F | D | Low |
| 38 | Pre-B | dic(9;20) | 4 | F | D | Low |
| 39 | Pre-B | t(9;15), +6, −13 | 3 | F | D | Low |
| 40 | Pre-B | t(1;19), −13 | 1 | F | D | Low |
| 41 | Pre-B | 46 XX | 4 | F | D | Low |
| 42 | Pre-B | t(12;21) | 2 | M | D | Low |
| 43 | Pre-B | dic(7:9), t(9;14), −20, +21, +3mar | 2 | F | D | Low |
| 44 | Pre-B | iAMP21 | 11 | M | D | Int |
| 45 | Pre-B | t(12;21), −10, +12, −13, +21, +3mar | 5 | M | D | Int |
| 46 | Pre-B | 46 XY | 15 | M | D | Risk |
| 47 | Pro-B | −6 | 4 | M | D | Risk |
| 48 | Pre-B | +RUNX1 | 2 | F | D | Risk |
| 49 | Pre-B | PDGFTB/CSF IR rear, -ETV6 | 8 | F | D | Risk |
| 50 | Pre-B | N/A | 11 | M | D | Risk |
| 51 | Pre-B | t(12;21) | 3 | M | D | Low |
| 52 | Pre-B | -Y, +7, −9, +21, +mar | 3 | M | D | Low |
| 53 | Pre-B | 46 XY | 4 | M | D | Low |
| 54 | Pre-B | t(4;11) | 6 | M | D | Int |
| 55 | Pre-B | t(12;21) | 5 | M | D | Low |
| 56* | Pro-B | i9, −9 | 16 | M | D | Low |
| 57 | Pro-B | t(12;21) | 3 | M | D | Low |
| 58 | Pro-B | Complex | 8 | F | D | Low |
| 59* | Pre-B | t(12;21) | 2 | F | D | Low |
| 60 | Pro-B | N/A | 17 | F | D | Int |
| 61 | Pre-B | Hyperdiploid | 2 | M | D | Low |
| 62 | c-ALL | Hyperdiploid | 7 | M | D | Risk |
| 63 | Pre-B | t(1;19) | 12 | M | D | Low |
Patient IDs with an asterisk (*) indicates those treated on UKALL 2003. Patient IDs with no asterisk were treated on UKALL 2011. Low-risk (Low) and risk MRD status was defined at day 29, intermediate-risk (Int) was determined at week 14.
D, diagnosis; F, female; M, male; N/A, not available; R, relapse.
Normal BM (NBM) samples were obtained from healthy donors. Mononuclear cells (MNCs) were cryopreserved as previously described.33 CD133+- and CD34+-enriched cord blood (CB) samples were provided by Suzanne Watt, MD (University of Oxford). Mesenchymal stem cells (MSCs) were differentiated from NBM cells, as previously described.34 Cardiomyocytes (CMCs) were used in undifferentiated and differentiated forms (PromoCell, Heidelberg, Germany), in accordance with the supplier’s protocol.
Cell sorting
Thawed BCP-ALL cells (>70% viable) were stained with monoclonal antibodies (mAbs) against CD34 (clone 8G12), CD19 (clone 4G7), CD58 (clone 1C3), CD97 (clone VIM3b), or CD200 (clone MRC-OX104). NBM and CB samples were stained with anti-CD34 and anti-CD38 (clone HB7) (all BD Biosciences, Oxford, United Kingdom). Cells were stained with 7-amino-actinomyosin (7-AAD; Sigma-Aldrich, Gillingham, United Kingdom) to exclude dead cells. Live cells (2 × 10⁷ to 6 × 10⁷) were sorted using a Becton Dickinson Influx cell sorter with BD Sortware 1.2.0 (BD Biosciences; supplemental Figure 1).
Flow cytometry
Cells were stained with CD34-allophycocyanin (APC), anti-CD19-fluorescein isothiocyanate (FITC), propidium iodide (PI; Miltenyi Biotec, Bisley, United Kingdom), anti-CD58-phycoerythrin (PE), anti-CD97-PE, or anti-CD200-PE and were analyzed on a MACSQuant Analyzer 10 flow cytometer (Miltenyi Biotec). At least 10 000 events were acquired for determination of antigen expression. CD200 density was also calculated as the number of binding sites by using a fluorescence quantification kit (Quantibrite, BD Biosciences).
Microarray analysis
Gene expression analyses of 5 unsorted BCP-ALL and 5 NBM samples by Agilent Whole Human Genome Oligo Microarrays (Miltenyi Biotec, Bergisch Gladbach, Germany) were described previously.33 Normal CD34+/CD38– hemopoietic stem cells (HSCs) and CD34+/CD19+, CD34+/CD19–, CD34–/CD19+, and CD34–/CD19– BCP-ALL subpopulations were sorted from respective samples for analysis. Microarray data are available at accession number E-MTAB-4006 (www.ebi.ac.uk/arrayexpress).
Proliferation assay
Unsorted and sorted CD34/CD58 and CD34/CD97 BCP-ALL cells were seeded at up to 5 × 10⁵ cells per mL in Iscove modified Dulbecco medium (IMDM) with Glutamax (Invitrogen, Paisley, United Kingdom) supplemented with recombinant human interleukin-3 (rhIL-3; 20 ng/mL), rhIL-7 (20 ng/mL), stem cell factor (50 ng/mL) (all from R&D Systems, Abingdon, United Kingdom) and heparin‐induced thrombocytopenia serum substitute (20% v/v, human serum albumin, insulin, and transferrin; STEMCELL Technologies, Cambridge, United Kingdom). Cells were maintained for 6 weeks with half-media changes once per week. Absolute cell counts and viability were assessed by flow cytometry.
Immunoassays
MNCs were isolated by density gradient centrifugation from blood collected from healthy donors. Monocytes were isolated by positive selection using anti-CD14 magnetic beads (Miltenyi Biotec) and were cultured with RPMI-1640 medium supplemented with 50 ng/mL macrophage colony-stimulating factor (Miltenyi Biotec). At day 7, monocyte-derived macrophages were mixed with BCP-ALL cells in a mixed lymphocyte reaction (MLR) ± 50 µg/mL immunoglobulin G4 (IgG4) or anti-CD200 antibody TTI-CD200, (provided by Trillium Therapeutics, Inc., Mississauga, ON, Canada). CD4+ cells enriched from the same cell source using magnetic microbeads (Miltenyi Biotec) were also added in a 5:1:1 ratio (T cells:macrophages:BCP-ALL cells). MLR plates were left for 72 hours, and then supernatants were analyzed with an OptEIA enzyme-linked immunosorbent assay (ELISA) Kit II for detecting IL-2 (BD Biosciences). Cells were stained with PI (Miltenyi Biotec) to assess viability by flow cytometry or the LIVE/DEAD Cell Imaging kit (488/570, Thermo Fisher Scientific, Loughborough, United Kingdom) to evaluate cytotoxicity by imaging.
In vivo assays
NOD.Cg-PrkdcscidIl2rγtm1Wjl/SzJ (NSG) mice were bred and maintained at the University of Bristol Animal Service Unit. All experiments were conducted according to procedures licensed by the UK Home Office. Sorted and unsorted BCP-ALL subpopulations were resuspended in 300 μL IMDM, supplemented with 5% human serum albumin (Bio Products Laboratory, Elstree, United Kingdom), and injected into the lateral tail vein. If possible, equivalent cell numbers from sorted populations were inoculated. Human cell engraftment was assessed with peripheral blood (PB) aspirates obtained once per week, and animals were maintained for up to 20 weeks or until they showed symptoms of disease. On termination, femoral BM was assessed by flow cytometry for human cell engraftment using antibodies against human CD34, CD45, CD7, CD19, and CD200. In secondary transplantation experiments, engrafted cells were inoculated without resorting.
For in vivo evaluation of TTI-CD200, NSG mice were inoculated with BCP-ALL cells. Once >0.1% human cells were detected in PB, mice received TTI-CD200 (20 mg/kg intravenously) every 72 hours for a total of 4 doses. Control mice received IgG4 (20 mg/kg) over the same schedule. Engraftment was monitored once per week, as above.
Immunohistochemistry
Tissues removed from NSG mice treated with TTI-CD200 or IgG4 were fixed with 4% paraformaldehyde for 24 hours, then washed with phosphate-buffered saline supplemented with EDTA and stored in 70% ethanol. Immunohistochemistry was performed using the anti-goat cell and tissue staining kit (R&D Systems, Abingdon, United Kingdom) according to the manufacturer’s instructions. Goat polyclonal anti-human/anti-mouse CD200 (15 μg/mL) and rat anti-mouse F4/80 (2 μg/mL) primary antibodies were used, followed by secondary biotinylated anti-goat antibody (1:13) and streptavidin-horseradish peroxidase for CD200 and polyclonal anti-rat horseradish peroxidase (1:1000 dilution) for F4/80, respectively (all from R&D Systems). Sections were counterstained with hematoxylin and eosin.
Statistical analyses
One-way analysis of variance (ANOVA) followed by Tukey’s post hoc test was used to analyze differences in gene expression between groups of samples and to compare proliferation in sorted subpopulations. IL-2 production and effect on cell viability in different MLR conditions were compared using 2-way ANOVA and Tukey’s post hoc test. The effect of TTI-CD200 and IgG4 on leukemia burden was analyzed using paired Student t tests. Survival of NSG mice treated with TTI-CD200 or IgG4 was compared using the log-rank test.
Results
Investigating differentially expressed genes in LPCs
Whole-genome microarray analyses performed on unsorted cells from 5 patients showed significant upregulation of CD19 (P < .01), CD58 (P = .02), CD97 (P < .01), and CD200 (P = .03) compared with normal MNCs (Figure 1A). Subsequently, expression of CD58, CD97, and CD200 was assessed in known LPC subpopulations (CD34+/CD19+, CD34+/CD19–, CD34–/CD19+, and CD34–/CD19–; Figure 1B). Although there were subtle differences in expression of these markers among LPCs, overall, there were no significant differences. Expression of CD200 was the most consistent across the LPCs with median log2 intensity of 7.1 (range, 5.8-9.1).
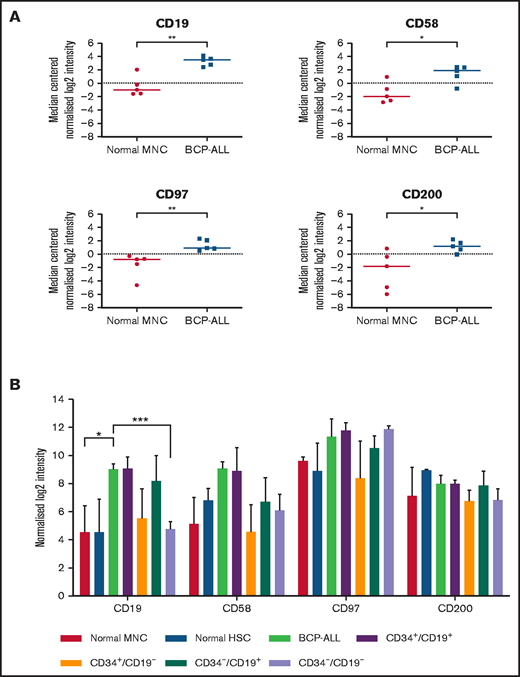
Gene expression in unsorted cells and LPCs. (A) Gene expression of CD19, CD58, CD97, and CD200 in BM samples from 5 BCP-ALL patients (1, 12, 23, 61, 62) and from 5 healthy donors were analyzed using Agilent Whole Genome Oligo microarrays. Data show side-by-side comparisons of median centered normalized log2 signal intensities. (B) BCP-ALL patients were sorted on the basis of expression or lack of expression of CD34 and CD19. CD34+/CD38– HSCs were sorted from normal BM MNCs before gene expression analyses. Bars represent median normalized log2 intensities of expression, and error bars represent the interquartile ranges. Results were analyzed by 2-way analysis of variance (ANOVA) with Tukey’s post hoc testing. *P ≤ .05; **P ≤ .01; ***P ≤ .001.
Gene expression in unsorted cells and LPCs. (A) Gene expression of CD19, CD58, CD97, and CD200 in BM samples from 5 BCP-ALL patients (1, 12, 23, 61, 62) and from 5 healthy donors were analyzed using Agilent Whole Genome Oligo microarrays. Data show side-by-side comparisons of median centered normalized log2 signal intensities. (B) BCP-ALL patients were sorted on the basis of expression or lack of expression of CD34 and CD19. CD34+/CD38– HSCs were sorted from normal BM MNCs before gene expression analyses. Bars represent median normalized log2 intensities of expression, and error bars represent the interquartile ranges. Results were analyzed by 2-way analysis of variance (ANOVA) with Tukey’s post hoc testing. *P ≤ .05; **P ≤ .01; ***P ≤ .001.
Flow cytometric detection of CD58 and CD97 in LPCs
To verify CD58 and CD97 gene expression, flow cytometric analyses were conducted in a larger patient cohort, including one of those used above (patient 12). CD58 expression varied widely in unsorted cells and LPCs (Figure 2Ai). Median levels were higher in unsorted cells (79%; range, 10%-99%), CD34+/CD19+ (80%; range, 18%-93%), and CD34–/CD19+ (66.5%; range, 12%-100%) LPCs than in normal MNCs and HSCs. The majority of ALL cells were CD34–/CD19+/CD58+ (43.1%; range, 0.2%-82%; Figure 2Aii). CD97 expression was lower than CD58 expression in unsorted cells (median, 21%; range, 0.4%-93%; Figure 2Bi). Highest levels were detected in CD34+/CD19+ cells (30%; range, 0%-99%). However, the CD34–/CD19+/CD97– subpopulation represented the majority of blasts (27.5%; range, 0.1%-84.2%; Figure 2Bii).
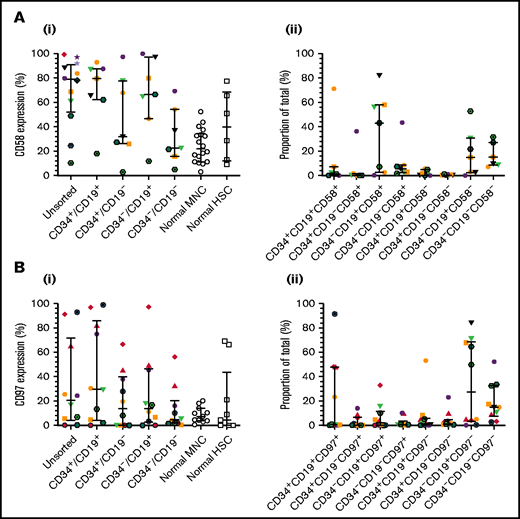
Expression of CD58 and CD97 in BCP-ALL. Cells from 14 BCP-ALL samples were stained for CD34 and CD19 and gated into CD34+/CD19+, CD34+/CD19–, CD34–/CD19+, and CD34–/CD19– subpopulations. CD58 expression (Ai) was assessed in 12 patients (1-12) and CD97 expression (Bi) was assessed in 10 patients (1-3, 5, 6, 8, 9, 11, 19, 25). CD58 and CD97 expression was compared with normal MNCs (n = 18 and n = 11, respectively) and HSCs (n = 6 and n = 9, respectively). The proportions of the triple-stained populations in these samples are shown in panels Aii and Bii. Horizontal lines represent medians, and error bars represent the interquartile ranges. Each symbol represents a different patient.
Expression of CD58 and CD97 in BCP-ALL. Cells from 14 BCP-ALL samples were stained for CD34 and CD19 and gated into CD34+/CD19+, CD34+/CD19–, CD34–/CD19+, and CD34–/CD19– subpopulations. CD58 expression (Ai) was assessed in 12 patients (1-12) and CD97 expression (Bi) was assessed in 10 patients (1-3, 5, 6, 8, 9, 11, 19, 25). CD58 and CD97 expression was compared with normal MNCs (n = 18 and n = 11, respectively) and HSCs (n = 6 and n = 9, respectively). The proportions of the triple-stained populations in these samples are shown in panels Aii and Bii. Horizontal lines represent medians, and error bars represent the interquartile ranges. Each symbol represents a different patient.
CD58 and CD97 are not essential for ALL proliferation and engraftment
Proliferation of sorted CD34/CD58 and CD34/CD97 subpopulations was examined over 6 weeks in vitro (supplemental Figure 2A-B). The CD34–/CD58– and CD34+/CD97+ subpopulations represented the majority of cells at sorting, but by week 6, most proliferating cells were derived from the CD34+/CD58–, CD34+/CD97–, and CD34–/CD97– cells.
Sorted subfractions were also inoculated into NSG mice to assess engraftment and self-renewal capacity. Unsorted, CD34+/CD58+, and CD34+/CD58– cells from 3 of 4 MRD low-risk patients engrafted primary recipients (0.22% to 99% human cells; Figure 3A). Very high engraftment (>97%) was observed using CD34–/CD58– cells from patients 3 and 11. All subpopulations of cells from patient 11 resulted in high leukemia engraftment (64%-99%). In risk patient 12, cells from all subpopulations engrafted, although engraftment was lower in CD34–/CD58– cells. Cells recovered from mice engrafted with all CD34/CD58 subpopulations were capable of engrafting secondary recipients in both low-risk and risk patients. Similar findings were observed using sorted CD34/CD97 cells (Figure 3B) with engraftment (0.5%-43%) achieved across all subpopulations in low-risk patients and higher levels of engraftment observed in 2° recipients (27%-73%). Higher leukemia burden was observed in 1° (1.4%-86%) and 2° (35%-86%) NSG mice inoculated with cells from risk patients. Engraftment was seen in at least 3 populations from all 3 patients in 1° recipients and in serial recipients of cells from 2 patients.
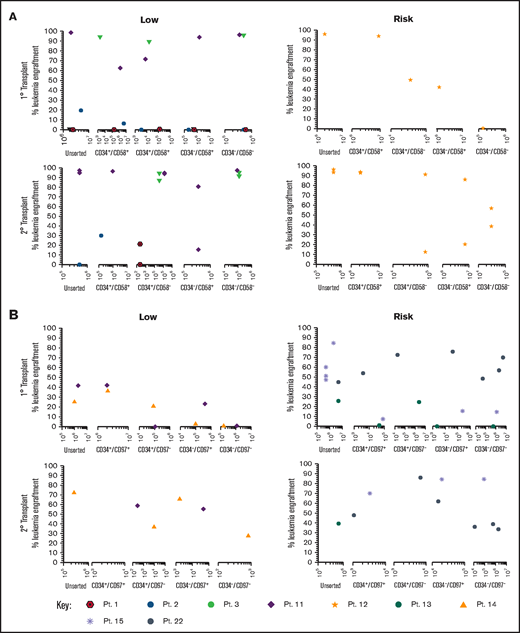
Repopulating capacity of ALL subpopulations in vivo. (A) Cells from MRD low-risk patients 1-3 and 11 and risk patient 12 were sorted based on CD34/CD58, and (B) cells from low-risk patients 11 and 14 and risk patients 13, 15, and 22 were sorted based on CD34/CD97. Unsorted cells and sorted subfractions were evaluated for their ability to engraft primary and secondary NSG mouse recipients. Each patient is represented by a specific symbol, and each symbol depicts the engraftment as measured by human cells present in the BM of NSG mice. Pt., patient.
Repopulating capacity of ALL subpopulations in vivo. (A) Cells from MRD low-risk patients 1-3 and 11 and risk patient 12 were sorted based on CD34/CD58, and (B) cells from low-risk patients 11 and 14 and risk patients 13, 15, and 22 were sorted based on CD34/CD97. Unsorted cells and sorted subfractions were evaluated for their ability to engraft primary and secondary NSG mouse recipients. Each patient is represented by a specific symbol, and each symbol depicts the engraftment as measured by human cells present in the BM of NSG mice. Pt., patient.
CD200 is overexpressed in low-risk and risk patients
Expression of CD200 was evaluated in 25 low-risk patients and 17 risk patients (Figure 4Ai-ii; supplemental Figure 3). In low-risk patients, median expression of CD200 (66%; range, 0.3%-90%) was significantly higher than normal MNCs (0.06%; 0%-0.3%; P < .0001). Likewise, CD200 expression was significantly higher in CD34+/CD19+ (95%; range, 3%-100%), CD34+/CD19– (62%; range, 0%-96%), and CD34–/CD19+ (75%; 4%-99%) LPCs compared with normal HSCs (1.2%; range, 0%-7%; P < .0001). Levels were significantly lower in CD34–/CD19– cells (9%; range, 0%-58%; P ≤ .002) compared with the other subpopulations. In risk patients (Figure 4Aii), CD200 expression was lower (54%; range, 1%-95%), although it remained significantly higher than normal cells (P < .0001). As before, expression in CD34+/CD19+ (76.3%; range, 0.6%-99%), CD34+/CD19– (40%; range, 0%-92%), and CD34–/CD19+ (54%; 0.7%-77%) LPCs was significantly higher than HSCs (P ≤ .04).
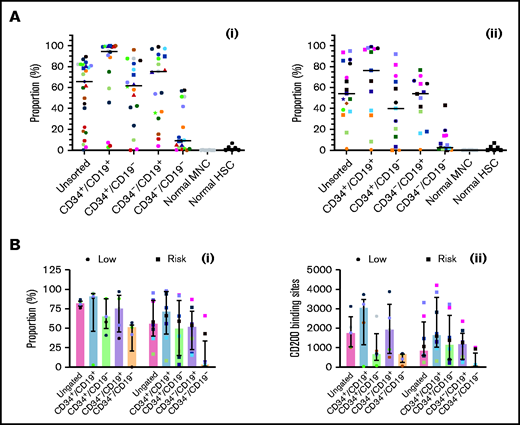
Comparing CD200 expression in low-risk and risk ALL. (A) Cells from 25 MRD low-risk ALL patients (1-3, 5, 6, 8, 14, 23, 25, 30-32, 34-43, 51, 59) (panel Ai) and 17 risk ALL patients (9, 12, 13, 22, 24, 27-29, 33, 44-50, 60) (panel Aii) were stained for CD34 and CD19 and gated into CD34+/CD19+, CD34+/CD19–, CD34–/CD19+ and CD34–/CD19– populations; the proportion of CD200 was then determined. Each symbol represents a different patient, and horizontal lines represent the median. (B) In a subset of patients with 5 MRD low-risk patients (34, 42, 43, 51, 59) and 8 MRD risk patients (28, 33, 44-47, 50, 60), both CD200 expression (Bi) and number of binding sites (Bii) were calculated. Bars represent median expression, and error bars represent the interquartile range.
Comparing CD200 expression in low-risk and risk ALL. (A) Cells from 25 MRD low-risk ALL patients (1-3, 5, 6, 8, 14, 23, 25, 30-32, 34-43, 51, 59) (panel Ai) and 17 risk ALL patients (9, 12, 13, 22, 24, 27-29, 33, 44-50, 60) (panel Aii) were stained for CD34 and CD19 and gated into CD34+/CD19+, CD34+/CD19–, CD34–/CD19+ and CD34–/CD19– populations; the proportion of CD200 was then determined. Each symbol represents a different patient, and horizontal lines represent the median. (B) In a subset of patients with 5 MRD low-risk patients (34, 42, 43, 51, 59) and 8 MRD risk patients (28, 33, 44-47, 50, 60), both CD200 expression (Bi) and number of binding sites (Bii) were calculated. Bars represent median expression, and error bars represent the interquartile range.
In a subset of patients (5 low-risk and 8 risk), we examined both CD200 expression and the number of antigen binding sites (Figure 4Bi-ii). In low-risk patients, the higher proportion of CD200+ cells correlated with a higher number of CD200 binding sites across LPC subpopulations (r = 0.7; P = .0001). However, there was no correlation in risk patients (r = 0.09; P = .6).
Only CD200+ cells have NSG engrafting capacity in low-risk ALL
To evaluate the functional ability of CD200+ populations, samples were sorted on the basis of CD34/CD200 and inoculated into NSG mice (Figure 5A; supplemental Table 1). In low-risk patients, ALL engraftment was achieved (within 7 to 12 weeks) with unsorted cells (0.4%-55%), CD34+/CD200+ (1.5%-66%), and CD34–/CD200+ (10%-71%) subpopulations using 1 × 10⁴ to 5 × 10⁶ cells. There was no engraftment in any patient with CD200– cells. The self-renewal capacity of CD200+ populations was confirmed by serial transplantation in 3 of 5 patients (Figure 5B; supplemental Table 2). In contrast, sorted cells from risk patients rapidly engrafted 1° and 2° recipients (2 to 6 weeks), regardless of CD34 or CD200 expression (Figure 5A-B). Engraftment ranged from 2% to 94% in primary transplants, using 1 × 10³ to 5 × 10⁶ cells and 0.3% to 98% in secondary transplants. Interestingly, BM cells harvested from mice engrafted with risk patient 24 cells that had a CD200+ immunophenotype, regardless of the subpopulation inoculated (supplemental Table 2).
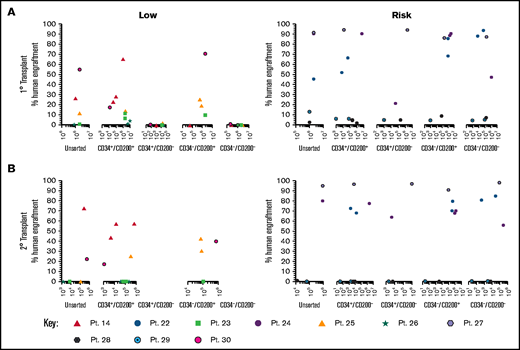
Only CD200+ cells can engraft NSG mice in low-risk ALL. Cells from MRD low-risk patients 14, 23, 25, 26, and 30 and risk patients 22, 24, and 27-29 were sorted for expression of CD34 and CD200. Unsorted cells and the sorted subfractions were evaluated for their ability to engraft primary (A) and secondary (B) NSG mouse recipients. Each patient is represented by a specific symbol, and each symbol depicts the engraftment as measured by human cells present in the BM of the NSG mice .
Only CD200+ cells can engraft NSG mice in low-risk ALL. Cells from MRD low-risk patients 14, 23, 25, 26, and 30 and risk patients 22, 24, and 27-29 were sorted for expression of CD34 and CD200. Unsorted cells and the sorted subfractions were evaluated for their ability to engraft primary (A) and secondary (B) NSG mouse recipients. Each patient is represented by a specific symbol, and each symbol depicts the engraftment as measured by human cells present in the BM of the NSG mice .
CD200+ ALL cells can be targeted using TTI-CD200
Because only CD200+ cells from low-risk patients were capable of engrafting mice, we sought to determine whether this was a viable target for therapy. Anti-CD200 mAb TTI-CD200 was incubated with low-risk ALL samples together with macrophages and CD4+ T cells from healthy individuals to investigate effects on IL-2 production and viability (Figure 6). Addition of TTI-CD200 to ALL cells with high CD200 expression (CD200high; 87%-93.4%) triggered a 19-fold increase in IL-2 (from 16.7 ± 12.8 to 316 ± 178.8 pg/mL; P = .04; Figure 6A). In contrast, no significant increase in IL-2 was observed in samples with very low CD200 expression (CD200low; <1%; P = .26). The effect of TTI-CD200 on viability (as measured by flow cytometry) was negligible with a maximum 6.2% decrease in patients with high CD200 expression and 3.6% in patients with low CD200 expression (P > .8; Figure 6A).
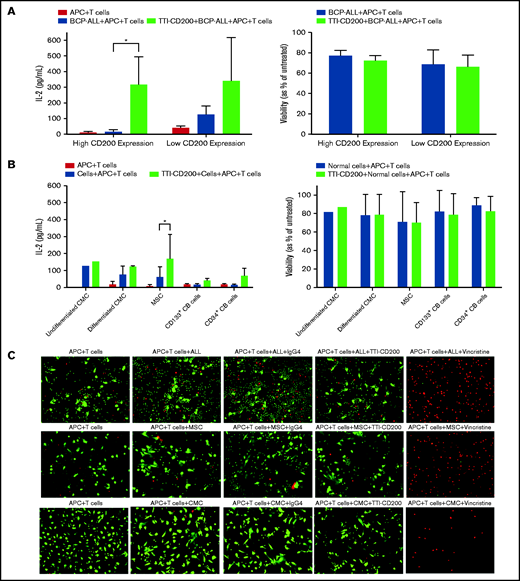
TTI-CD200 can trigger an IL-2 response against CD200+ ALL. (A) Cells from 3 ALL patients (55-57) with high CD200 expression and 2 (6, 58) with low CD200 expression were set up with CD4+ T cells and monocyte-derived macrophages from normal blood donors in a 72-hour mixed lymphocyte reaction with or without the addition of TTI-CD200. Production of IL-2 was assessed by enzyme-linked immunosorbent assay (ELISA), and cell viability was determined by flow cytometry using annexin V and propidium iodide. (B) The effect of TTI-CD200 on normal cells was determined in undifferentiated and differentiated CMCs, MSCs, and normal CB–derived CD133+ and CD34+ cells. Data are shown as mean ± standard deviation (SD) of triplicate measurements from each cell source. (C) The viability of ALL cells, MSCs, and CMCs after treatment with TTI-CD200 was assessed using fluorescence microscopy and live/dead staining (Calcein dye, green, live cells; ethidium, red, dead cells). Vincristine (Sigma-Aldrich), a cardiotoxic drug, was used as a positive control.
TTI-CD200 can trigger an IL-2 response against CD200+ ALL. (A) Cells from 3 ALL patients (55-57) with high CD200 expression and 2 (6, 58) with low CD200 expression were set up with CD4+ T cells and monocyte-derived macrophages from normal blood donors in a 72-hour mixed lymphocyte reaction with or without the addition of TTI-CD200. Production of IL-2 was assessed by enzyme-linked immunosorbent assay (ELISA), and cell viability was determined by flow cytometry using annexin V and propidium iodide. (B) The effect of TTI-CD200 on normal cells was determined in undifferentiated and differentiated CMCs, MSCs, and normal CB–derived CD133+ and CD34+ cells. Data are shown as mean ± standard deviation (SD) of triplicate measurements from each cell source. (C) The viability of ALL cells, MSCs, and CMCs after treatment with TTI-CD200 was assessed using fluorescence microscopy and live/dead staining (Calcein dye, green, live cells; ethidium, red, dead cells). Vincristine (Sigma-Aldrich), a cardiotoxic drug, was used as a positive control.
The effect of TTI-CD200 was also investigated on normal cells that express CD200, including undifferentiated and differentiated CMCs, MSCs, CD133+, and CD34+ CB cells to assess potential off-tumor effects (Figure 6B). Median CD200 mean fluorescence intensity values were 105 (range, 65-537) in CMCs, 3813 in MSCs (range, 3531-4095), 195 in CD133+ cells (range, 173-217), and 170 in CD34+ CB cells (range, 168-172; supplemental Figure 4). There was only a modest increase in IL-2 production (1.2-fold to 4.5-fold) across the different cell types, despite very high expression in MSCs. Viabilities of normal cells were largely unaffected (<7% decrease; Figure 6B). Live cell imaging demonstrated that there was no evidence of reduced viability in CMCs and MSCs treated with anti-CD200 in contrast to ALL cells (Figure 6C).
TTI-CD200 therapy reduces CD200+ ALL in vivo
To assess the effects of TTI-CD200 in vivo, NSG recipients were inoculated with cells from MRD low-risk patients (Figure 7) and treated with TTI-CD200 or IgG4 when engraftment was established. Disease progression was delayed by up to 43 days in mice treated with TTI-CD200 engrafted with low-risk samples compared with levels at the start of treatment. From day 46 onward, mice treated with TTI-CD200 that were inoculated with cells from patient 53 had significantly lower disease burden than isotype-treated mice (P ≤ .003), and survival was significantly extended by 21 days (P = .02). The effects of the antibody on CD200+ cells were more pronounced in patients 52 and 53. CD200+ levels were maintained at 0.6% ± 0.2% from cessation of treatment until day 36, significantly lower than levels in isotype-treated mice (12.4% ± 4.5%; P < .0001) for patient 52, whereas CD200+ burden was significantly lower than control mice for patient 53 from day 35 onward (P ≤ .01). Immunophenotypic analyses of BM showed a significant decrease in human cells in most treated mice (P = .03), with the proportion of CD200+ cells reduced by up to 52%. BM histology showed no difference in morphology between isotype control and mice treated with TTI-CD200, but the latter group had fewer CD200+ cells and higher numbers of macrophages (supplemental Figure 5). TTI-CD200 had no effect on other tissues examined.
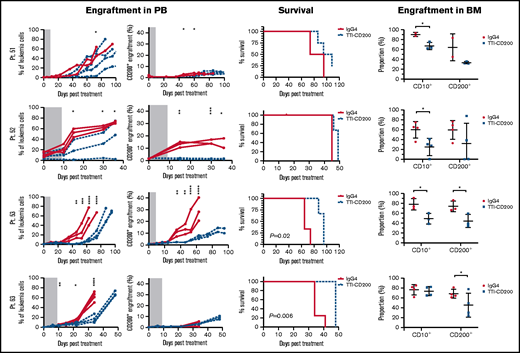
TTI-CD200 delays disease progression in low-risk ALL. Cells from 4 MRD low-risk ALL patients (51-53, 63) were inoculated into NSG mice. Once engraftment reached >0.1%, mice received 4 doses of isotype control IgG4 or TTI-CD200 (50 mg/kg) intravenously at 72-hour intervals (gray boxes represent treatment duration). Human cell levels (CD45, CD10, and CD200) were measured in PB once per week and in bone marrow (BM) at termination. Patients 51 and 53 had low levels of CD45, so CD10 was used for measuring engraftment. Lines in PB graphs represent individual mice. Data in BM graphs represent mean ± SD. *P ≤ .05; **P ≤ .01; ***P ≤ .001; ****P ≤ .0001.
TTI-CD200 delays disease progression in low-risk ALL. Cells from 4 MRD low-risk ALL patients (51-53, 63) were inoculated into NSG mice. Once engraftment reached >0.1%, mice received 4 doses of isotype control IgG4 or TTI-CD200 (50 mg/kg) intravenously at 72-hour intervals (gray boxes represent treatment duration). Human cell levels (CD45, CD10, and CD200) were measured in PB once per week and in bone marrow (BM) at termination. Patients 51 and 53 had low levels of CD45, so CD10 was used for measuring engraftment. Lines in PB graphs represent individual mice. Data in BM graphs represent mean ± SD. *P ≤ .05; **P ≤ .01; ***P ≤ .001; ****P ≤ .0001.
Treatment with TTI-CD200 had no effect on disease burden or survival of NSG mice engrafted with cells from intermediate-risk or high-risk patients (supplemental Figure 6). However, in 2 of 4 patients (patients 22 and 27), the proportion of CD200+ cells was significantly reduced from 6.7% ± 0.2% to <0.02% (P ≤ .007).
Discussion
Despite advances in the treatment of ALL and high remission rates, relapse is still a major cause of treatment failure.35 CD34+/CD19– and CD34–/CD19– LPCs have been described by several groups.19-22,36 Importantly, these subpopulations have been shown to be resistant to therapeutic drugs, including parthenolide and BCL-2 inhibitors,21,37 and CD19– relapse remains a problem after treatment with CAR T cells and blinatumomab.38-40 Therefore, identifying targets and developing agents that could complement the use of anti-CD19 and anti-CD20 therapies is desirable.40 The discovery of additional markers to characterize and target LPCs may allow the elimination of these populations, which would minimize the risk of relapse. In this study, we investigated the functional relevance of CD58, CD97, and CD200 overexpression in pediatric ALL and their potential as targets.
Whole-genome amplification analyses showed that CD58, CD97, and CD200 were all differentially expressed when compared with normal MNCs. This was in accordance with a larger whole-genome amplification study in ALL in which CD58, CD97, and CD200 were among 30 genes that were at least more than threefold differentially expressed in 25% of patients.25 In addition, flow cytometry analyses indicated that CD97 and CD200 were overexpressed in 22% and 41% of patients, respectively, most of which had hyperdiploid or t(12;21) karyotypes.25 In our cohort, CD58 was overexpressed in 75% of patients, CD97 in 50%, and CD200 in 98%. Only 4 of 10 patients tested for CD97 expression and 12 of 42 patients tested for CD200 expression had hyperdiploid or t(12;21) karyotypes. Our findings concur with those of Tembhare et al41 who found no association of CD200 expression and genetic subtypes in 90 childhood BCP-ALL patients studied.
The presence of CD58, CD97, and CD200 was subsequently determined in known LPCs,20,21,37 and the role of these antigens in proliferation in vitro and disease propagation in vivo was investigated. CD58– and CD97– subpopulations had greater proliferative ability than CD58+ and CD97+ populations in vitro. Furthermore, engraftment of primary and secondary NSG mice occurred with all sorted subpopulations, irrespective of the presence of CD34, CD58, or CD97. CD58 was used in the EuroFlow MRD panels for BCP-ALL until 20175 and is still used in the United States.42 CD97 has been investigated as a potential biomarker for childhood ALL43-45 and has been shown to have a critical role in initiation and self-renewal in AML.46 However, our data demonstrate that neither CD58 nor CD97 were present on all LPCs, and therefore lack of cells expressing these markers does not mean absence of residual disease. Consequently, these antigens were not investigated further as potential therapeutic targets.
CD200 is considered to be a potential biomarker and prognostic factor in AML, with high CD200 expression (≥20%) associated with poor prognosis in cytogenetically normal AML.47,48 CD200 overexpression has also been associated with poor prognosis in pediatric BCP-ALL.49 In our cohort of 42 patients, 67% of MRD low-risk patients and 88% of risk patients had high (≥20%) CD200 expression. CD200 was also overexpressed in most LPCs compared with normal HSCs; higher levels were observed in low-risk patients. Using fluorescence intensity to measure CD200 density does not permit meaningful comparisons between studies, so the number of binding sites was quantified instead. In low-risk patients, there was a direct correlation with the number of binding sites and the proportion of CD200+ in all LPC subpopulations. There were no specific karyotypic aberrations associated with this high CD200 frequency and density across the entire cohort.
In vivo experiments revealed a major functional difference in CD200+ cells from low-risk and risk patients. Engraftment in NSG mice was seen using all sorted populations in samples from risk patients, irrespective of the presence of CD34 or CD200. Engraftment was highest in patients who subsequently relapsed. In contrast, in low-risk patients, only CD200+ cells could engraft primary and secondary recipients, which demonstrated self-renewal ability. This indicates that CD200 could be a specific marker of LPCs in low-risk ALL that could be used for therapeutic targeting. Although these patients are considered low risk, a number of them relapse, so reducing this risk is crucial. These findings concur with a recent description of CD200 as a novel marker for LPCs in adult AML.50
The interaction of CD200 with its receptor (CD200-CD200R) triggers immunosuppressive signaling that results in macrophage inhibition, induction of regulatory T cells, inhibition of natural killer (NK) cells, a switch in cytokine profile from Th1 to Th2, and ultimately a suppression of antitumor immunity.51-54 mAbs against CD200 have been used to interrupt the CD200-CD200R axis in AML, CLL, and myeloma.54-56 A clinical trial using anti-CD200 mAb samalizumab (ALXN6000) reported a good safety profile and reduced tumor burden in a majority of patients with advanced CLL.55 Here, TTI-CD200 mAb was used to target CD200+ cells in MRD low-risk patients. Production of IL-2 was suppressed by ALL cells with high CD200 expression, but a 19-fold increase in IL-2 was observed upon addition of TTI-CD200. Rastogi et al54 also reported an increase in the release of interferon-γ (IFN-γ) by NK cells in response to incubating CD200high AML cells with TTI-CD200. In ALL patients with low CD200 expression, a small (less than threefold) increase in IL-2 was observed after treatment. There was limited evidence of immunostimulation or impact on viability of normal hemopoietic cells and cardiac cells using TTI-CD200, which is encouraging despite the limitations of the MLR assay. In addition, treating MSCs that overexpress CD200 and have immunosuppressive abilities57 caused only a modest increase in IL-2, which demonstrates limited off-tumor effects. However, there are a range of complex interactions between MSCs and the immune system that take place simultaneously, which might explain the lack of IL-2 production.58
To assess the effect of TTI-CD200 in vivo, NSG mice were engrafted with cells from MRD low-risk patients and were then treated with the antibody without the addition of PB mononuclear cells. Other studies have used PB mononuclear cells to provide a more functional immune system,56,59 but such approaches do not mimic the clinical setting in which patients have limited immune activity. Absence of T or NK cells in NSG mice means an immune response would have to be mediated by macrophages, which normally express CD200R and are downregulated by binding to the CD200 molecule.60,61 The addition of TTI-CD200 can interrupt the CD200-CD200R interaction and reverse macrophage downregulation. After treatment with TTI-CD200, there was a clear reduction in the engraftment rate of CD200+ cells paralleled by reduced overall engraftment, which was prolonged after treatment stopped. Immunohistochemical analyses demonstrated macrophages in the BM of mice treated with anti-CD200 antibody but not in control mice, which confirms a macrophage-mediated response. No morphologic changes or immunostimulatory responses were observed in other tissues after treatment. Disease progression was delayed by up to 43 days and survival improved in mice treated with TTI-CD200. These results are in accordance with a study using Burkitt lymphoma cell lines with shorter follow-up.56 When mice engrafted with intermediate-risk or high-risk samples were treated with TTI-CD200, the effect on the leukemia cells was insignificant and the disease progressed rapidly. This substantiated the initial in vivo data showing that CD200 expression was not a requirement for LPC activity in intermediate-risk and risk patients.
Leukemia cells use a range of strategies to trick the host immune system, such as aberrant antigen expression, secretion of immunosuppressive cytokines and inhibitory enzymes, expansion of immunoregulatory cells, and activation of immune checkpoint pathways.62 Identifying molecules that not only define LPCs but also play a role in inhibiting the immune system allows development of a unique dual targeting approach. Here, CD200 was shown to be an important marker of LPCs in low-risk patients, and these cells could be targeted using an anti-CD200 mAb. This is the first description of a biomarker that is essential for LPC activity in ALL; therefore, relapse with CD200– cells would not be expected. Moreover, there were minimal off-target effects. Such an approach has the potential to improve outcomes in low-risk ALL patients, reduce toxic adverse effects, and prevent relapse in these children.
Acknowledgments
The authors thank Paul Archer (Bristol Genetics Laboratory), the Oncology staff at Bristol Royal Hospital for Children, Andrew Herman, MD, and Lorena Sueiro Ballesteros (Flow Cytometry Facility), Debbie Martin and Carol Berry (Histology Facility in Faculty of Life Sciences, University of Bristol), and Suzanne Watt, MD (University of Oxford). The authors also thank the patients and their families who gave permission for their cells to be used for research.
This work was supported by grants from the National Institute for Health Research (NIHR) under its Programme Grants scheme (RP-PG-0310-1003) and the NIHR Blood and Transplant Research Unit in Stem Cells and Immunotherapies (167097).
The views expressed in this article are those of the authors and are not necessarily those of the National Health Service, the NIHR, or the Department of Health.
Authorship
Contribution: P.D. and A.B. conceived the study, designed and performed experiments, and wrote the report; C.V.C conceived the study, designed and performed experiments, and commented on the report; B.C.E. processed samples, performed experiments, and commented on the report; R.A.U. provided TTI-CD200, advised on the experimental design, and commented on the report; and J.P.M. facilitated sample collection, collated the clinical data information, and commented on the report.
Conflict-of-interest disclosure: R.A.U. is an employee of Trillium Therapeutics Inc. The remaining authors declare no competing financial interests.
Correspondence: Allison Blair, School of Cellular and Molecular Medicine, University Walk, University of Bristol, Bristol BS8 1TD, United Kingdom; e-mail: allison.blair@bristol.ac.uk.

