

Key Points
Susceptibility to NETosis is enhanced in MPN patients; those with calreticulin- and JAK2-mutated MPNs have increased NET formation.
NETosis is not linked to either thrombosis or to classical risk factors for thromboembolic complications.

Abstract
Morbidity and mortality of Philadelphia chromosome–negative myeloproliferative neoplasms (MPNs) are mainly determined by thromboembolic complications. Thrombus formation is facilitated by a neutrophil-specific form of cell death linked to neutrophil extracellular trap (NET) formation (NETosis). Preclinical and clinical data suggested a potential link between NETosis and thrombosis in MPNs. In this study, we aimed to define the impact of NETosis on clinical end points in a large MPN cohort. NETosis was induced in vitro by ionomycin and quantified by enzyme-linked immunosorbent assay–based nucleosome release assays as well as fluorescent staining of free DNA in samples from 103 MPN patients and 28 healthy donors. NETosis rate was correlated with a broad set of clinical data, such as MPN subtype, mutational status, laboratory variables, history of thrombotic events, and treatment types. Triggered NETosis levels were clearly higher in MPN patients than in healthy donors. Positivity for JAK2 V617F or exon 12 as well as CALR mutations correlate with increased NET formation. However, neither JAK2 allelic burden nor history of thromboembolic complication nor the presence of other risk factors for thrombosis (eg, leukocytosis) were associated with the rate of NETosis. In addition, none of the analyzed laboratory parameters nor the type of treatment significantly impacted the rate of NETosis formation. The biology of MPNs has an impact on NET formation because genetic driver mutations favor induction of NETosis, but this does not seems to translate into important clinical end points such as thromboembolic complications. Therefore, NETosis may play a role in facilitating thrombosis, but it is not a sole causative determinant in MPN-associated thrombophilia.
Introduction
Polycythemia vera (PV), essential thrombocythemia (ET), and primary myelofibrosis (PMF) are classified among the 2016 World Health Organization–defined myeloproliferative neoplasms1 (MPNs) and are referred to as Philadelphia chromosome–negative MPNs. They are clonal stem cell diseases2,3 that share a set of mutually exclusive somatic mutations4 in the JAK2, MPL, and CALR genes. In 45% of patients, these driver gene mutations are the sole mutations.5 They all result in the constitutive activation of JAK2, which in turn phosphorylates STAT transcription factors.5–9 Additionally acquired mutations, such as TET2, DNMT3A, ASLX1, EZH2, IDH1/2, SRSF2, SF3B1, RUNX1, and TP53 may modify the disease phenotype and in part are associated with a higher risk of disease progression (reviewed in Shammo and Stein10 ). The gene expression pattern which leads to JAK-STAT activation contributes to clonal proliferation 6,11,12 and comprises inflammatory pathways13,14 that link MPN disease biology to inflammation-associated coagulopathy.
Thromboembolic or bleeding events represent the main causes of morbidity and mortality in MPNs.15 Thrombosis occurs in approximately one-third of all MPN patients, is more abundant in PV than in ET and PMF, and was shown to be linked to JAK2 mutational status and allelic burden.16–18 The 10-year probability that MPN patients will develop a fatal cardiovascular event is higher than the probability of dying from transformation to MPN blast crisis. This also translates into an excess mortality compared with that for the general population and predominantly affects patients younger than age 50 years (hazard ratio for fatal cardiovascular events is 8.8 vs 1.5 in patients older than age 70 years).19 Thus, recommendations for treating MPNs aim to prevent thromboembolic and bleeding complications by applying a risk-adapted antiplatelet or anticoagulation strategy, controlling hematocrit levels by phlebotomy, and reducing hyperproliferation by cytoreductive drugs.
The molecular mechanisms that drive thrombus formation in MPNs are not completely understood. They might differ between MPN subgroups, depending on additional patient-inherent factors or anatomical and vascular conditions, which would explain the high prevalence of MPNs in thrombotic events at unusual vascular sites.20–22 Established risk factors of thrombotic events in MPNs are age older than 60 years and history of thrombosis in ET and leukocytosis in PV >15 G/L,23 >11 G/L in ET,24 and >11 G/L in PMF.25 The International Prognostic Score for Thrombosis in Essential Thrombocythemia (IPSET)26 has been validated for predicting thrombosis in ET and accounts for JAK2 mutational status and cardiovascular risk factors.27 Kroll et al28 proposed a model for thrombogenesis in PV that combines risk factors such as leukocytosis, JAK2 mutational status, and hematocrit with pathogenetic processes such as rheologic changes that facilitate leukocyte-platelet interactions and endothelial damage, which results in a procoagulant state. The observation that increased leukocyte counts are a risk factor for thrombosis and recent data on the role of β2-integrin–mediated leukocyte attachment suggest that leukocyte-neutrophil–triggered factors are essential inflammatory drivers of MPNs.29
NETosis is a form of programmed necrosis of neutrophils,30,31 which was first described as an innate immune mechanism to eliminate pathogens.32,33 A phenotypic hallmark of this process is the release of neutrophil extracellular traps (NETs), which are extracellular net-like structures composed of modified DNA and associated enzymes such as myeloperoxidase (MPO) and neutrophil elastase among other proteases and lysozymes. NETs have been identified in bacterial,34,35 fungal, and viral36–38 infections, and their antimicrobial effects have been attributed to binding and enzymatic killing of pathogens.33,39,40 More recently, NETosis has been implicated in a variety of diseases such as autoimmunity,41–43 cardiovascular disease,44,45 cerebrovascular disease,46,47 and cancer.48–50 In the majority of these diseases, NETs are involved in inflammatory processes42,51 and thrombogenesis.52,53 They contribute to thrombus formation in many ways: NETs provide a scaffold for thrombus formation, activate factor XII, and bind von Willebrand factor and tissue factor, and NET-bound histones trigger platelet activation.29,54 Moreover, neutrophil elastase cleaves and inactivates tissue factor inhibitor and thrombomodulin and thereby further promotes a procoagulant state. This concept of cooperation among innate immune cells by NETosis and components of coagulation and complement system has been termed “immunothrombosis".55
So far, only 2 studies have focused on NETosis in MPNs.56,57 Data from those 2 studies are in part conflicting, and their sample sizes were rather small. We aimed to better characterize NETosis in a larger MPN patient cohort to compare NETosis rates of patients with those of healthy donors. Within the MPN patient cohort, we correlated the amount of NETosis with a set of relevant clinical and biochemical variables.58
Methods
Patient and control cohort
A total of 103 MPN patients (ET, n = 47; PV, n = 30; PMF and secondary myelofibrosis patients, n = 28) and 28 healthy donors were enrolled in this “all comer” study. Histology-proven MPN diagnosis was required, but we did not predefine any other specific inclusion or exclusion criteria. Because the majority of patients were diagnosed before 2016, diagnoses have to be considered according to World Health Organization 2008 criteria. In 2 patients, the histologic diagnoses were re-evaluated during the disease course by additional bone marrow biopsies, and NETosis assays for those 2 patients were repeated. Therefore, the total number of patients (n = 103) and the sum of the patients in subgroups (n = 105) differ. The cohort contained both treated and untreated patients (Table 1). Patients were included after written informed consent was obtained. The study was approved by the local ethical committee of the Medical University of Innsbruck (AN2016-0254 368/4.17).
Patient characteristics and treatment information according to disease type (n = 103)
| Variable | ET | PV | MF | PMF | post ET-MF | post PV-MF |
|---|---|---|---|---|---|---|
| No. of patients per subgroup | 47 | 30 | 28 | 18 | 9 | 1 |
| Sex | ||||||
| Female | 28 | 14 | 17 | |||
| Male | 19 | 16 | 11 | |||
| Median age, y | 64.6 | 65.3 | 67.7 | 60.6 | 66.1 | 76.5 |
| Median duration of disease, y | 11.5 | 6.2 | 11 | 5.1 | 22.0 | 4.8 |
| Median MPN Symptom Assessment Form total symptom score | 11.0 | 15.5 | 8.0 | |||
| ECOG PS | ||||||
| 0 | 39 | 27 | 24 | |||
| 1 | 4 | 3 | 2 | |||
| 2 | 4 | 0 | 1 | |||
| Mutational status* | ||||||
| JAK2V617F and exon 12 | 31 | 30 | 19 | 12 | 6 | 1 |
| Type I and II CALR | 10 | 0 | 7 | 5 | 2 | 0 |
| MPL | 0 | 0 | 2 | 2 | 0 | 0 |
| Triple negative | 6 | 0 | 1 | 0 | 1 | 0 |
| No. of patients with vascular events | 11 (23.4) | 9 (30) | 8 (28.6) | 5 | 3 | 0 |
| Arterial | 9 | 7 | 7 | 2 | 2 | 0 |
| Venous | 11 | 7 | 7 | 5 | 2 | 0 |
| Splanchnic | 3 | 2 | 2 | 2 | 0 | 0 |
| Bleeding | 1 | 0 | 0 | |||
| Risk scores | ||||||
| IPSET-T | NA | NA | ||||
| Low | 10 | |||||
| Intermediate | 11 | |||||
| High | 26 | |||||
| ELN | NA | |||||
| Low | 10 | 7 | ||||
| High | 37 | 23 | ||||
| IPSET | NA | NA | ||||
| Low | 10 | |||||
| Intermediate | 30 | |||||
| High | 7 | |||||
| IPSS | NA | (unknown 4) | ||||
| Low | 10 | 16 | ||||
| Intermediate-1 | 5 | 5 | ||||
| Intermediate-2 | 11 | 6 | ||||
| High | 0 | |||||
| DIPSS | NA | NA | ||||
| Low | 13 | |||||
| Intermediate-1 | 8 | |||||
| Intermediate-2 | 7 | |||||
| High | 0 | |||||
| DIPSS Plus | NA | NA | ||||
| Low | 12 | |||||
| Intermediate-1 | 6 | |||||
| Intermediate-2 | 8 | |||||
| High | 1 | |||||
| Treatment | ||||||
| Hydroxyurea | 18 | 7 | 6 | 5 | 1 | 0 |
| Anagrelide | 20 | 4 | 8 | 4 | 4 | 0 |
| Ruxolitinib | 0 | 9 | 10 | 5 | 4 | 1 |
| Interferon | 4 | 5 | 4 | 2 | 1 | 1 |
| Anticoagulation | 6 | 5 | 6 | 5 | 1 | 0 |
| Antiplatelet | 35 | 26 | 19 | 11 | 7 | 1 |
All data are n (%) unless otherwise stated. In 2 patients, diagnosis was re-evaluated; because of the change in diagnosis, assays were replicated.
DIPSS, Dynamic International Prognostic Scoring System; DIPSS Plus, a refined DIPSS for primary myelofibrosis that incorporates prognostic information from karyotype, platelet count, and transfusion status; ECOG PS, Eastern Cooperative Oncology Group performance score; ELN, European LeukemiaNet; IPSET, International Prognostic Score of Thrombosis for Essential Thrombocythemia; IPSET-T, IPSET-Thrombosis; IPSS, International Prognostic Scoring System; MF, myelofibrosis;
One patient carried both an MPL and a CALR mutation; 2 patients were analyzed twice.
Neutrophil isolation
To begin, 30 mL of peripheral whole blood was collected in EDTA-coated tubes. Primary neutrophils were isolated by a 2-step density gradient centrifugation. Aliquots of whole blood samples were layered on top of a prepared layer of 2 density solutions: the bottom layer was 15 mL of polysucrose-sodium diatrizoate solution (density, 1.119 g/mL) Granulosep (Himedia) or Histopaque-1119 (Sigma); the top layer was 6 mL of Biocoll (Biochrom) (density, 1.077 g/mL). For density separation, the solutions were centrifuged at 800g for 20 minutes at room temperature with no breaks. After centrifugation, the granulocyte-enriched mid-layer was harvested and washed in phosphate-buffered saline (PBS). Cells were resuspended in Dulbecco’s PBS (Corning) before being layered on top of a prepared discontinuous second density gradient composed of Percoll plus solutions ranging from 85% to 65%. Density centrifugation was repeated, and granulocytes were harvested from the middle layers and washed with PBS before centrifugation at 300g for 10 minutes at room temperature. Neutrophils were then resuspended in 1640 RPMI (Lonza) phenol red-free, and cells were counted by using flow cytometry with BD trucount tubes (BD Biosciences).
Detection of released nucleosomes in serum samples
Serum samples were withdrawn from 83 MPN patients and 27 healthy donors. After consecutive centrifugation at 3000g, the supernatant was retrieved and nucleosome release was quantified using a Roche cell death enzyme-linked immunosorbent assay (ELISA) kit strictly following the manufacturer’s instructions (see section on “Quantification of NETosis”). Because this assay was designed for relative analyses, we calculated the obtained measurements relative to the positive control.
Induction and inhibition of NETosis
Neutrophils were seeded into 96-well plates at a concentration of 1 × 10⁵ cells per well, and NETosis was triggered by using final concentrations of 4 µM ionomycin for 4 hours at 37°C in the presence of 10% human serum (Sigma Aldrich) and 5% CO2. When indicated, NETosis was inhibited by pre-incubating cells for 30 minutes with 200 µM Cl-amidine (N-α-benzoyl-N5-[2-chloro-1-iminoethyl]-L-ornithine amide) before NETosis induction.
To define the impact of JAK2 inhibition on induced NETosis of isolated primary neutrophils in vitro, the cells were pre-incubated with ruxolitinib 300 nM or vehicle for 2.5 hours (as described in Wolach et al56 ) before NETosis was triggered by exposure to 4 µM ionomycin for 2.5 hours.
Quantification of NETosis
Quantification by immunofluorescent microscopy.
Neutrophils were stimulated as described above in chamber slides at 1 × 10⁵ cells per 200 µL. After cells were exposed to NETosis-inducing agents for 4 hours, they were fixed with paraformaldehyde 4% for 30 minutes at room temperature before slide chambers were washed with PBS. The fixed neutrophils were permeabilized by adding 0.1% Triton X-100 and 0.1% sodium citrate for 10 minutes at 4°C. The supernatant was discarded, slide chambers were washed with PBS, and cells were blocked with 3% bovine serum albumin at 37°C for 90 minutes before primary staining with rabbit anti-human histone H3 (Abcam 5103) or mouse anti-human MPO (Abcam 25989) at 4°C overnight. For secondary antibody staining, donkey-anti-rabbit-tetramethylrhodamine (TRITC) (Abcam 6799) and goat-anti-mouse-fluorescein isothiocyanate (FITC) Alexa 488, A11029 were used. DNA was counterstained with 4′,6-diamidino-2-phenylindole (DAPI).
Quantification by ELISA.
A cell death ELISA kit (Roche) was used strictly according to the manufacturer’s recommendations for quantification of released nucleosomes as surrogate markers of NETosis. In brief, after NETosis induction, 96-well plates were centrifuged at 200g for 10 minutes at room temperature, and 20 µL of supernatant per well was collected and transferred to a streptavidin-coated 96-well plate. After incubation with a mixture of biotin-labeled anti-histone antibodies and peroxidase-coupled anti-DNA antibodies for 2 hours at room temperature, the reaction was discarded and the amount of antibody-bound nucleosomes was detected photometrically after stopping the peroxidase-substrate reaction. NETosis rates were determined as the ratio of ionomycin-stimulated to solvent-treated wells.
Quantification by free DNA quantification assay.
We used the Quant-it double-stranded DNA assay (Thermo Fisher Scientific) to determine the amount of free DNA in the supernatant of cell cultures after NETosis induction by ionomycin 4 µM for 4 hours. Assays were performed according to the manufacturer’s instructions. In brief, 200 µL of reagent solution and 10 µL of samples or double-stranded DNA standards were loaded into each 96-well microplates. Fluorescence was detected at 502/523 nm. Absolute DNA amounts were calculated by using a standard curve.
Statistical analysis
Data were tested for normal distribution by using quantile-quantile plots. A nonparametric Kruskal-Wallis test was used for group comparison of non-normally distributed data. Dunn’s test was used for pairwise multiple comparisons with Benjamin-Hochberg correction for multiple testing. Analyses were conducted by using R statistical software (https://www.gbif.org/tool/81287/r-a-language-and-environment-for-statistical-computing), and figures were created by using the ggplot2 package (https://ggplot2.tidyverse.org/).
Results
Patient and control cohorts
A total of 103 unselected MPN patients (ET, n = 47; PV, n = 30; PMF and secondary myelofibrosis patients, n = 28) treated in our outpatient clinic were included in this study. In 2 patients, diagnoses were re-evaluated, and assays for NETosis were repeated. One patient had progressed to secondary myelofibrosis. The diagnosis was changed from ET to PV for the other patient. The majority of patients carried a JAK2 mutation (either V617F or exon 12) (n = 80), 17 patients had a CALR mutation, and 2 patients carried the MPL W515L mutation. Seven patients had triple-negative mutations. One patient was positive for MPL and CALR mutations. The mean duration of disease was 6.5 years (range, 0-36.9 years). Patients were treated according to the current German Society for Hematology and Medical Oncology/Austrian Society of Hematology and Medical Oncology/Swiss Society of Hematology guidelines. Patient features and treatment information are summarized in Table 1. The control cohort was composed of 15 female and 13 male healthy donors with a median age of 59.7 years (main characteristics are provided in supplemental Table 1).
NET formation is increased in MPNs
Immunofluorescent staining of co-localized citrullinated histone H3 (FITC), DNA (DAPI) and MPO (TRITC) demonstrated formation of NETs with 4 hours of exposure to ionomycin 4 µM (Figure 1A). To calculate the amount of NET formation, we quantified extracellular nucleosome release. Induction of NETosis was dose-dependent and could be attenuated by the PAD4 inhibitor Cl-amidine (supplemental Figures 1 and 2). NETosis rates observed in the group of all MPN patients combined were significantly higher when compared with those of healthy donors (Figure 1B). The amount of free DNA in cell culture supernatants also reflects NETosis induction. In line with the ELISA data, free DNA release upon ionomycin activation in isolated granulocytes from 46 MPN patients vs 12 healthy controls corroborated increased NET formation in MPNs (Figure 1C).
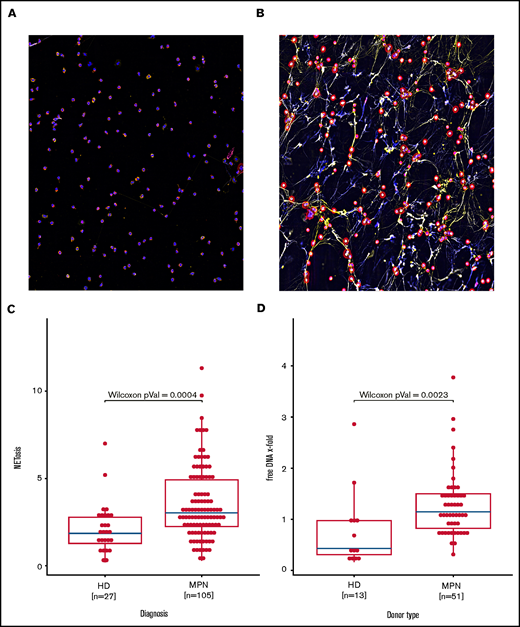
Increased NETosis in patients with MPN vs healthy donors. (A-B) Representative fluorescent imaging of NETs confirming NETosis in primary human neutrophils after 4 hours of exposure to (A) dimethyl sulfoxide and (B) ionomycin 4 µM (original magnification ×40). Antibody staining labeled citrullinated histone H3 red (Cy5, red) and human MPO green (Cy3, yellow); DNA was counterstained with diamidino-2-phenylindole (DAPI) (blue). (C) Induced NETosis rates measured in primary neutrophils from 103 individual MPN patients and 27 healthy donors (HD) by ELISA. (D) Quantification of free DNA in cell culture supernatant from NETosis induction by 4 μM ionomycin demonstrated increased DNA levels in MPN patient samples compared with those from healthy donors. Data are presented as x-fold of vehicle controls. Boxplots show the 25% and 75% quartiles and the median; overlayed dot plots indicate individual measurements.
Increased NETosis in patients with MPN vs healthy donors. (A-B) Representative fluorescent imaging of NETs confirming NETosis in primary human neutrophils after 4 hours of exposure to (A) dimethyl sulfoxide and (B) ionomycin 4 µM (original magnification ×40). Antibody staining labeled citrullinated histone H3 red (Cy5, red) and human MPO green (Cy3, yellow); DNA was counterstained with diamidino-2-phenylindole (DAPI) (blue). (C) Induced NETosis rates measured in primary neutrophils from 103 individual MPN patients and 27 healthy donors (HD) by ELISA. (D) Quantification of free DNA in cell culture supernatant from NETosis induction by 4 μM ionomycin demonstrated increased DNA levels in MPN patient samples compared with those from healthy donors. Data are presented as x-fold of vehicle controls. Boxplots show the 25% and 75% quartiles and the median; overlayed dot plots indicate individual measurements.
This difference in NETosis rates maintains statistical significance for both the ET and PMF subgroups when compared with healthy donor samples. In patients with PV or secondary myelofibrosis, the differences do not reach statistical significance, even though the median NETosis rates in these groups are clearly higher compared with those of healthy donors. Lack of significance in some subgroups is probably because the subgroup was small (eg, the secondary myelofibrosis group consisted of only 10 patients) (Figure 2A).
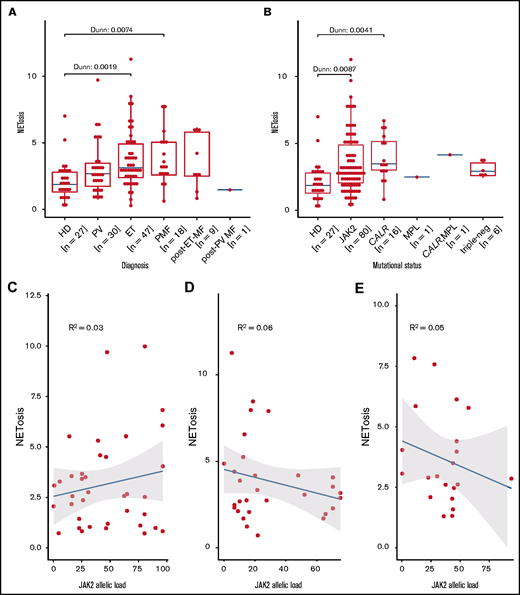
Induced NETosis rates in neutrophils from patients with MPN and healthy donors. (A) NETosis rates in MPN subgroups compared with those in healthy donors quantified by ELISA, and (B) driver gene mutations. Data are presented as x-fold of vehicle controls. Boxplots show the 25% and 75% quartiles and the median; overlayed dot plots indicate individual measurements. P values were Benjamin-Hochberg (BH) corrected. Correlation of NETosis rates with JAK2 allelic burden according to MPN subgroup for (C) PV, (D) ET, and (E) MF. Dots represent single measurements, allelic load is shown as a percentage, and NETosis is shown as x-fold of vehicle controls.
Induced NETosis rates in neutrophils from patients with MPN and healthy donors. (A) NETosis rates in MPN subgroups compared with those in healthy donors quantified by ELISA, and (B) driver gene mutations. Data are presented as x-fold of vehicle controls. Boxplots show the 25% and 75% quartiles and the median; overlayed dot plots indicate individual measurements. P values were Benjamin-Hochberg (BH) corrected. Correlation of NETosis rates with JAK2 allelic burden according to MPN subgroup for (C) PV, (D) ET, and (E) MF. Dots represent single measurements, allelic load is shown as a percentage, and NETosis is shown as x-fold of vehicle controls.
We next analyzed the association between NETosis induction and mutational subtype. Despite clearly increased NETosis rates in all mutational MPN subtypes (when compared with healthy donors), these differences reached statistical significance only in patients with CALR and JAK2 mutations. Again, this might be the result of the small sample sizes of the rarer mutational subtypes (there were 7 patients with triple-negative mutations in total) (Figure 2B). Because MPN subtypes differ with respect to their JAK2 allelic burden, we wondered whether JAK2 allelic load correlates with NETosis induction, but we were not able to determine a significant association between them (Figure 2C-E). When focusing on potential differences between the MPN phenotypes within the largest subgroup of JAK2-mutated patients (n = 80), we did not observe any relevant differences in induced NETosis rates between them (Figure 3).
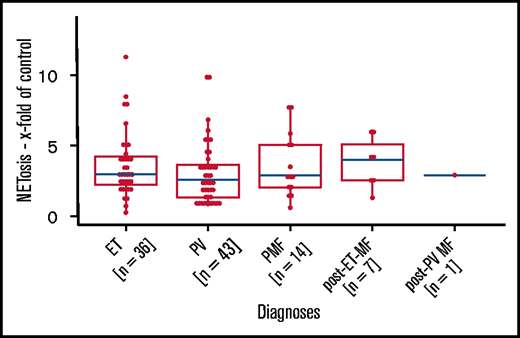
Induced NETosis rates in JAK2-mutated patients from all MPN subtypes. NETosis rates between MPN subgroups of JAK2-mutated patients were quantified by ELISA. Data are presented as x-fold of vehicle controls. P values were determined by a Dunn test and were BH corrected. Boxplots show the 25% and 75% quartiles and the median; overlayed dot plots indicate individual measurements.
Induced NETosis rates in JAK2-mutated patients from all MPN subtypes. NETosis rates between MPN subgroups of JAK2-mutated patients were quantified by ELISA. Data are presented as x-fold of vehicle controls. P values were determined by a Dunn test and were BH corrected. Boxplots show the 25% and 75% quartiles and the median; overlayed dot plots indicate individual measurements.
Considering previous results for the NETosis-inhibiting activity of the JAK2 inhibitor in NETosis in vitro, we next applied the experimental conditions described by Wolach et al.56 In contrast to the data in our previous reports, we were not able to detect relevant differences in the rate of induced NETosis in samples (from a total of 17 MPN patients) that were exposed to either a combination of ionomycin and ruxolitinib or a combination of ionomycin and vehicle (supplemental Figure 3).
Quantification of free nucleosomes in serum samples
To complement our in vitro data for induced NETosis, we next analyzed serum samples from 83 MPN patients and 27 healthy donors using the same cell death ELISA as the one we used for NETosis quantification (Figure 4A). In line with our in vitro data, free nucleosomes in serum samples from MPN patients were significantly higher when compared with those of healthy donors. When focusing on MPN subgroups, the difference was significant only in the PV subgroup, even though free nucleosomes were increased in most subgroup samples compared with those from healthy donors (Figure 4B).
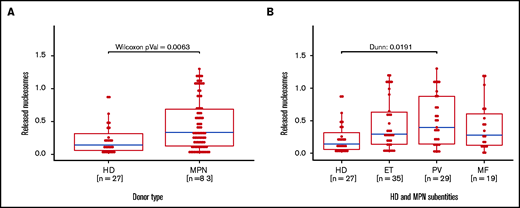
Increased free nucleosomes in serum samples from MPN patients and healthy donors. Free nucleosomes were quantified by ELISA in serum samples from (A) MPN patients and healthy donors and (B) healthy donors and MPN patients (n = 83) according to MPN subtype. Data are presented as x-fold referring to positive control. Boxplots show the 25% and 75% quartiles and the median; overlayed dot plots indicate individual measurements. MF, myelofibrosis.
Increased free nucleosomes in serum samples from MPN patients and healthy donors. Free nucleosomes were quantified by ELISA in serum samples from (A) MPN patients and healthy donors and (B) healthy donors and MPN patients (n = 83) according to MPN subtype. Data are presented as x-fold referring to positive control. Boxplots show the 25% and 75% quartiles and the median; overlayed dot plots indicate individual measurements. MF, myelofibrosis.
The influence of MPN therapy on NETosis induction
NETosis rates were lowest in the group of untreated patients followed by patients treated with ruxolitinib, anagrelide, interferon, or hydroxyurea (in order of increasing NETosis induction). Overall, these differences between the various treatment modalities did not reach statistical significance; in particular, no relevant reduction in NETosis rates was observed (according to the in vitro data provided above) in patients receiving anti-inflammatory JAK1/2 inhibitor therapy (supplemental Figures 4-6).
NETosis induction is not correlated with thromboembolic complications
Preclinical data linked JAK2 mutation to NETosis and thrombosis formation, but they could not be confirmed in this large real-life MPN patient cohort, because the levels of NETosis were similar in MPN patients with and without thrombosis. Even when we analyzed the thrombosis subtypes, MPN entities, and mutational status, we found no relevant differences (Figure 5A-D). Although treatment did not affect overall NETosis rates in the whole MPN cohort, lower NETosis levels were seen in those patients with a history of thrombosis who were untreated or were exposed to anagrelide or hydroxyurea, whereas patients with thrombosis who were treated with ruxolinitib and interferon had even higher NETosis levels (supplemental Figures 7-9).
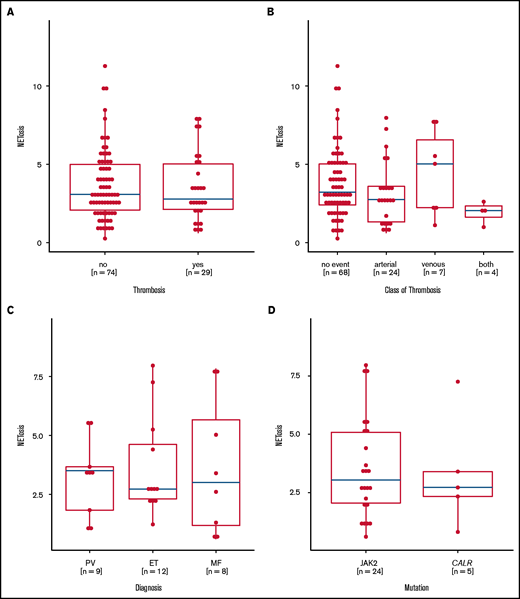
Induced NETosis rates according to history of thrombotic events. (A) NETosis rates in patients with (yes) and without (no) a history of thrombosis. (B) NETosis rates in patients with no thrombotic events or in patients with arterial and/or venous thrombotic events. (C) NETosis rates in patients with thrombotic events according to MPN subtype. (D) NETosis rates in patients with JAK2 or CALR mutations who had thrombotic events. Data are presented as x-fold of vehicle controls. Boxplots show the 25% and 75% quartiles and the median; overlayed dot plots indicate individual measurements.
Induced NETosis rates according to history of thrombotic events. (A) NETosis rates in patients with (yes) and without (no) a history of thrombosis. (B) NETosis rates in patients with no thrombotic events or in patients with arterial and/or venous thrombotic events. (C) NETosis rates in patients with thrombotic events according to MPN subtype. (D) NETosis rates in patients with JAK2 or CALR mutations who had thrombotic events. Data are presented as x-fold of vehicle controls. Boxplots show the 25% and 75% quartiles and the median; overlayed dot plots indicate individual measurements.
Correlation of MPN risk scores and clinical end points with NETosis
The majority of ET patients were assigned a high-risk state according to the European LeukemiaNet (ELN) prognostic risk score and IPSET thrombosis scores. Similarly, most PV patients were assigned to ELN-PV and International Prognostic Scoring System (IPSS) high-risk groups, whereas MF patients were distributed among the lower-risk groups according to IPPS, Dynamic International Prognostic Scoring System (DIPSS), or DIPPS Plus. Comparing NETosis rates between the different risk groups did not reveal any significant differences in any of the MPN subgroups (supplemental Figure 10). Moreover, NETosis rates did not correlate with leukocyte, neutrophil, or platelet counts or with hemoglobin, C-reactive protein, ferritin, transferrin, lactate dehydrogenase (LDH) or β2-microglobulin levels. This may in part be the result of well-controlled peripheral cell counts in most treated patients with only 4 patients presenting with leukocyte counts above 20 G/L. These variables did not correlate with NETosis, probably because of the optimized cell counts in most patients. Similarly, parameters associated with inflammation (eg, C-reactive protein, RP, ferritin, and fibrinogen) or with cell turnover (eg, LDH) did not reveal any significant correlation with NETosis rates (Figure 6).
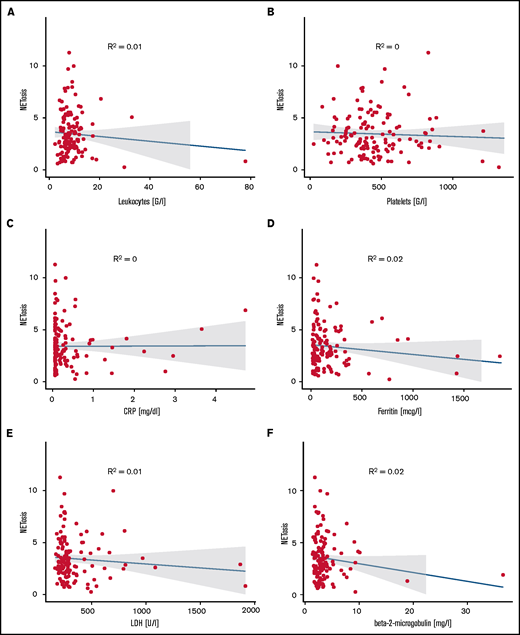
Correlation of NETosis with clinical variables. Panels show correlations of (A) leukocyte counts, (B) platelet counts, (C) C-reactive protein, (D) ferritin, (E) LDH, and (F) β2-microglobulin for MPN patients with measured induced NETosis. Dot plots indicate individual measurements. NETosis is shown as x-fold referring to vehicle-exposed controls.
Correlation of NETosis with clinical variables. Panels show correlations of (A) leukocyte counts, (B) platelet counts, (C) C-reactive protein, (D) ferritin, (E) LDH, and (F) β2-microglobulin for MPN patients with measured induced NETosis. Dot plots indicate individual measurements. NETosis is shown as x-fold referring to vehicle-exposed controls.
Discussion
NETosis has been observed in a large variety of diseases and has also been linked to thrombosis formation.59,60 Although the association between MPN and increased risk of thrombotic complications is well documented, the underlying patho-mechanisms remain elusive. It is tempting to speculate that clonal leukocytes are an important source of NET generation, thereby contributing to increased thrombosis risk in MPN. Thus, we aimed to better characterize the role NETosis has in MPNs, and we addressed 3 key questions in a clinical setting.
The first question is , Are MPN neutrophils more susceptible to NETosis than those of healthy donors? We provide clear evidence that neutrophils isolated from MPN patients compared with those from healthy donors release larger amounts of NETs upon stimulation. This is in contrast with the reduced NETosis rates described in the study by Oyarzún et al.57 In line with our study, Wolach et al56 have shown an increased rate of triggered NETosis in MPNs. However, these earlier studies were too limited in sample size to allow subgroup analysis. In the larger cohort presented here, NETosis rates in all subgroups were elevated, but this difference reached significance only in the ET and PMF subtypes. To better understand the relevance of increased NETosis rates in PV patients, for example, we compared NETosis in subgroups with homogeneous driver mutations. But the MPN subtypes did not significantly impact NETosis rates. In light of our initial hypothesis (ie, there is a link between NETosis and thrombosis), we were puzzled because it is well known that patients with PV show the highest thrombosis rates in MPN and other cohorts.61
As a next step, we aimed to define spontaneous NETosis abundance in patients’ blood. Therefore, we quantified free nucleosomes from serum samples as a surrogate marker for cell death (and a rough NETosis estimate), and we confirmed significantly increased levels in MPN patients compared with those in healthy donors.57 However, without immunofluorescent staining to corroborate the presence of NETs, which are usually quickly degraded by serum nucleases,62 these results cannot be interpreted unambiguously as NETosis. They might rather be evidence of elevated cell turnover (also reflected by increased LDH in many MPN patients).
The second question is, Does JAK-STAT signaling affect NETosis? We assume that induced NETosis rates from neutrophils derived from healthy donors represent the background levels of NET generation under normal JAK-STAT signaling. In MPNs, NETosis rates are significantly increased, suggesting a potential impact of JAK-STAT signaling on NETosis induction. This is corroborated by the increased NETosis levels seen in all mutational subgroups (including the triple-negative group) that have activated JAK-STAT signaling.58 The strength of JAK-STAT signaling however, which is at least in part reflected by the allelic burden, has no impact on NETosis rates.
Moreover, we did not observe any effect of ruxolitinib pretreatment on NETosis induction in vitro; ruxolitinib treatment in vivo in MPN patients also had no impact on NETosis induction in vitro. These results contradict data from Wolach et al56 who demonstrated reduced NETosis rates in neutrophils treated with ruxolitinib. Although experimental conditions for pretreatment with ruxolitinib were identical in both studies, some subtle technical aspects varied: NETosis was induced in vitro with ionomycin at 4 µM in neutrophils from ruxolitinib-treated patients with MPNs in both studies; however, samples sizes, MPN subgroups, and quantification methods differed. Our cohort was larger (n = 19), it contained samples from patients with PV or PMF, and NETosis was quantified by ELISA compared with semiquantitative morphologic quantification by independent reviewers in the Wolach et al study. In experiments with in vitro ruxolitinib pretreatment, Wolach et al used phorbol 12-myristate 13-acetate at 10 nM to induce NETosis in neutrophils derived from 4 healthy donors, whereas our data were taken from analysis of neutrophils triggered with 4 µM ionomycin that were derived from 17 MPN patients from all subgroups.
Beyond technical differences between the studies, the role of ruxolitinib as a means of evaluating the function of JAK-STAT signaling in NETosis needs to be considered in detail. The massive transcriptional activity observed during NETosis seems to be part the process itself whereas no translational activity is required to execute NETosis because it relies on preformed components.63 Taking into account the time required for translation and achieving critical protein amounts, we assume that 2.5 hours of pretreatment with ruxolitinib is a rather short time for observing any impact on the preformed NETosis machinery through transcriptional regulation. Therefore, this experimental setup might not be ideal for assessing the potential impact of JAK-STAT signaling on NETosis. Unfortunately, longer preincubation time leads to a continuous increase in dying granulocytes, which precludes proper quantification of NETosis induction.
The third question is, Does increased NETosis translate into a thrombotic phenotype? In our cohort, NET formation did not correlate with a recent thromboembolic complication nor did it correlate with known thrombosis risk factors and scores. We were not able to corroborate the preclinical data from a murine JAK2-driven MPN model that linked NET formation with thrombosis risk in clinical practice.56 In addition, we did not detect any impact of treatment with JAK inhibitors on NET formation, which contrasts our results with effects seen by Wolach et al56 in a murine venous ligation model for thrombosis. However, that model might not reflect the clinical reality in MPN patients. In addition, the role of ruxolitinib in reducing thrombosis rates was not supported by a recent meta-analysis.64 Moreover, there was no correlation between NETosis and other disease-relevant laboratory or clinical variables.
Thus, NETosis might facilitate the process of thrombus formation by providing the basis for the observed increased rates of thrombotic events in MPNs. NETosis rates were lowest in patients who did not require cytoreductive therapy and who, in general, could be considered to have a more benign disease phenotype. This observation of low NETosis background levels in patients with low levels of disease activity may support the role of NETosis as a facilitator of thrombogenesis. The individual thrombotic event, however, is probably triggered by additional still partially unknown factors. Provided that susceptibility to NETosis is an upstream player in the cascade of MPN-related thrombosis and that it is succeeded by another trigger, which determines the vascular event, NETosis would not be considered to correlate with clinical end points (as shown in our study). However, we would expect such correlation in a study of thrombosis patients that compared thrombosis related to MPNs with thrombosis not related to MPNs. To our knowledge, no such data are available.
Our study has some limitations. We used an all-comer outpatient MPN cohort, which is typically heterogeneous and includes MPN patients with different diseases, varying treatment schedules and sequences, as well as different disease stages. Thus, some subgroups presented here were probably too small for drawing definite conclusions. It is important to prospectively analyze the generation of NETosis in vitro and to define whether NETosis is already increased in patients before the onset of a thromboembolic complication. In general, the model of in vitro induced NETosis is an artificial setting because the endogenous trigger of NETosis is not known and therefore may not sufficiently reflect the process of NET formation in vivo . Many studies (including this one), studied ex vivo triggered NETosis in a standardized but highly unphysiologic manner. Thus, all currently available data on NETosis in MPNs and its potential clinical impact have to be interpreted with caution.
Acknowledgments
The authors thank Annabella Pittl and Kornelia Heiss for technical assistance.
This work was funded by unrestricted research grants from AOP Orphan, Swedish Orphan Biovitrum, and Incyte Corporation, and in part by a grant from the Deutsche Jose Carreras Leukämie Stiftung (DJCLS 16 R/2018).
Authorship
Contribution: S.S. and C.F. wrote the manuscript, planned the experimental layout, and were involved in conducting part of the experiments; D.W. and E.G. revised the manuscript; D.D. and E.H. conducted most of experiments; and S.S. performed the statistical analysis.
Conflict-of-interest disclosure: D.W. received research support and speakers honoraria from Novartis, AOP Orphan, and Bristol Myers Squibb/Celgene. S.S. received research support and speakers honoraria from Incyte. The remaining authors declare no competing financial interests.
Correspondence: Clemens Feistritzer, Department of Internal Medicine V (Hematology and Oncology), Medical University of Innsbruck, Anichstrasse 35, 6020 Innsbruck, Austria; e-mail: clemens.feistritzer@i-med.ac.at.

