

Key Points
Dermatopontin increases in response to radiation and slows migration of hematopoietic cells into the niche.
Excess dermatopontin may reduce hematopoietic cell interaction with the endothelium.

Abstract
Hematopoietic cell homing after hematopoietic cell transplant (HCT) is governed by several pathways involving marrow niche cells that are evoked after pre-HCT conditioning. To understand the factors that play a role in homing, we performed expression analysis on zebrafish marrow niche cells following conditioning. We determined that the noncollagenous protein extracellular matrix related protein dermatopontin (Dpt) was upregulated sevenfold in response to irradiation. Studies in mice revealed DPT induction with radiation and lipopolysaccharide exposure. Interestingly, we found that coincubation of zebrafish or murine hematopoietic cells with recombinant DPT impedes hematopoietic stem and progenitor cell homing by 50% and 86%, respectively. Similarly, this translated into a 24% reduction in long-term engraftment (vs control; P = .01). We found DPT to interact with VLA-4 and block hematopoietic cell–endothelial cell adhesion and transendothelial migration. Finally, a DPT-knockout mouse displayed a 60% increase in the homing of hematopoietic cells vs wild-type mice (P = .03) with a slight improvement in long-term lin−SCA1+cKIT+-SLAM cell engraftment (twofold; P = .04). These data show that the extracellular matrix–related protein DPT increases with radiation and transiently impedes the transendothelial migration of hematopoietic cells to the marrow.
Introduction
The hematopoietic cell microenvironment, or niche, contains a rich variety of cell types, including endothelial, stromal, perivascular, osteocyte, and neural lineages.1-5 These cells work in concert to orchestrate maintenance of hematopoiesis, regulating quiescence, division, longevity, movement, and differentiation. Niche cells perform their actions through paracrine signaling involving a variety of secreted proteins, such as stroma-derived factor-1 (SDF1), stem cell factor, adiponectin, and others.6-8 Many of these same cell maintenance pathways are also responsible for the recruitment of hematopoietic stem and progenitor cells (HSPCs) after hematopoietic cell transplant (HCT). One well-characterized pathway governing HSPC homing to the marrow niche is SDF1-CXCR4. Pre-HCT conditioning (often consisting of radiation or chemotherapy) drives up the concentration of SDF1 secreted by marrow niche cells. HSPCs (along with other cell types) express CXCR4, a cell surface receptor for SDF1, which facilitates cell migration (or “homing”) toward the established SDF1 concentration gradient, with an ultimate destination of the marrow proper.9 Advancements in our understanding of how HSPCs are recruited to the marrow have led to a number of preclinical and clinical studies to modify HSPC-recruiting factors, with the goal of improving HSPC marrow homing and decreasing the time of immune reconstitution.10-12 The outcomes of these studies have had mixed success, calling for a better understanding of the factors that mediate HSPC migration. Conversely, but related to the HSPC-homing process, there is a need to improve the mobilization of highly purified peripheral blood HSPCs, which is governed by overlapping mechanisms.13
To investigate additional novel niche-secreted factors that can modulate HSPC homing during HCT, we used the zebrafish (Danio rerio) model of HCT. The zebrafish has been a robust model of hematopoietic cell development and HCT because of the similarity in the hematopoietic genetic programs between mammals and zebrafish.14-16 We have previously shown that successful HCT in the zebrafish relies, in part, on an intact SDF1-CXCR4 pathway that mediates HSPC homing to the marrow niche and is analogous to mammals.17,18 Our goal in this study was to determine microenvironmental niche–related factors that modulate HSPC behavior during HCT. We analyzed the gene expression signature of isolated zebrafish marrow niche (ie, nonhematopoietic) cells before and after conditioning (radiation) and found increased expression of a small noncollagenous protein, dermatopontin (Dpt), that negatively impacted HSPC homing to the niche when delivered exogenously in zebrafish and mice. In vitro studies indicated a deficiency in HSPC adhesion and transmigration through endothelial cells upon DPT exposure. Further studies indicated that DPT may directly block VLA-4, which is required for efficient HSPC homing. This observation was confirmed by HCT in DPT-knockout mice, which showed improved HSPC homing and long-term engraftment after sublethal conditioning.
Methods
Zebrafish husbandry
Zebrafish were bred and maintained at the University of Minnesota Zebrafish Core Facility according to standard guidelines and with the approval of the Institutional Animal Care and Use Committee, University of Minnesota.19 The following lines were used: Segrest wild-type (WT), ubi:luciferase,20 and bactin2:EGFP.
Zebrafish niche cell isolation
Whole kidney marrow from 3-month-old zebrafish (n = 12-13) was surgically excised. In irradiation experiments, zebrafish were exposed to 30 Gy x-ray irradiation 24 hours earlier. Marrow was titurated with a P1000 pipette in 1 mL of PBS to create a single-cell suspension. The cells were filtered through a 40-μm mesh filter, and the cells from the retentate and filtrate were centrifuged at 1000g for 5 minutes to pellet the cells.
RNA preparation and expression array
Protocols are available in supplemental Methods.
Immunofluorescence and western blot.
Protocols are available in supplemental Methods.
HSPC homing in zebrafish.
A total of 250 000 ubi:luciferase or bactin2:EGFP donor cells was injected via the intracardiac route into recipient animals 2 days after 25-Gy irradiation. Luciferase-positive cells that homed to the marrow were assessed 48 hours after HCT, as previously described.20 To assess the numbers of homed bactin:EGFP donor cells, recipients underwent marrow harvest 16 hours after HCT, and EGFP+ cells were enumerated by flow cytometry on a BD FACSCanto flow cytometer using counting beads.
DPT enzyme-linked immunosorbent assay.
Plasma levels or marrow of murine DPT was assessed using a Mouse Dermatopontin/DPT ELISA Kit (Sandwich ELISA, #LS-F53048; LSBio, Seattle, WA), following the manufacturer’s instructions.
Murine homing assays
Recipient C57BL/6NCr CD45.2 or DPT-knockout (KO) mice were subjected to 9 Gy of myeloablative radiation, at a dose rate of 83 rad/min, 24 hours prior to transplant. Donor marrow was prepared from animals constitutively expressing EGFP under control of a chicken β-actin promoter21 (cell homing) or from B6.SJL-PtprcaPepcb/BoyCrl (CD45.1) mice (colony-forming unit [CFU] experiments) at a concentration of 2.5 × 10⁷ cells per milliliter in Hank’s balanced salt solution. A total of 2 × 10⁶ cells was delivered via tail vein injection. Marrow was harvested from recipients 16 hours posttransplant. Mice were first perfused with 10 mL of phosphate-buffered saline (PBS). Femurs and tibia were crushed using a mortar and pestle, followed by incubation in Accutase (Sigma-Aldrich, St. Louis, MO) at 37°C for 15 minutes while shaking to isolate hematopoietic cells. Cells were passed through a 40-μm filter and washed twice in PBS prior to enumeration of donor cells by flow cytometry (see antibodies by specificity). In some experiments, 2 µg of recombinant DPT (rDPT; #5749-DP; R&D Systems, Minneapolis, MN) was given exactly 30 minutes prior to adoptive transfer in the right lateral tail vein. The donor cells were delivered in the left lateral tail vein to avoid any physical effects from the prior injection.
CFU-spleen assay
Wild-type, rDPT-treated, or DPT-KO animals received 9-Gy radiation 24 hours prior to tail vein injection of 500 000 whole bone marrow (WBM) cells from congenic donor animals. Initial experiments in DPT-KO animals revealed colonies too numerous to count; therefore, the cell dose was decreased to 100 000 donor cells and later normalized. Eight days after HCT, spleens were harvested and fixed overnight in Bouin’s fixative (#7831; EMD Millipore, Billerica, MA), and colonies were enumerated under a dissection microscope.
CFU-C assay
Recipient mice received 9-Gy radiation 24 hours prior to the transfer of 500 000 WBM cells from donor animals. Marrow and spleens were harvested 8 days after HCT (for peripheral blood, the time point was 12 hours). CFU-cell (CFU-C) assays were performed with MethoCult M3434 (STEMCELL Technologies, Vancouver, BC, Canada), according to the manufacturer’s protocol, and colonies were analyzed on a Leica DM6000 microscope with a 5× objective after 10 to 14 days of incubation at 37°C and 5% CO2.
Murine cell isolation and transplantation.
Protocols are available in supplemental Methods.
Murine cell migration, adhesion, release, and flow assays.
Protocols are available in supplemental Methods.
Far-western blot
Seven micrograms of rDPT was run on a 4% to 12% Tris-Bis gel (Invitrogen) and electro-transferred to a polyvinylidene difluoride membrane. The blot was blocked with 5% blocking buffer (Bio-Rad, Hercules, CA) for 1 hour at room temperature, followed by cutting into strips. TIME endothelial cell lysate was prepared by solubilizing whole cells in lysis buffer (1% NP-40, 10 mM CHAPS, 150 mM NaCl, 10 mM sodium phosphate, 2 mM EDTA, plus cOmplete Protease Inhibitor [Sigma], pH 7.2, in blocking buffer). DPT-containing membrane strips were incuatred with the TIME lysate overnight at 4°C. Membrane strips were washed 3 times in Tris-buffered saline (TBS) and 0.1% Polysorbate 20. Primary antibodies were rabbit anti-ITGA3 (#ab190731), rabbit anti-ITGA4 (#ab81280), rabbit anti-ITGA5 (#ab150361), and rabbit anti-ITGB1 (#ab179471; all from Abcam); they were diluted 1:1000 in TBS for 4 hours at room temperature. Membranes were washed 3 times in TBS and 0.1% Polysorbate 20. The secondary antibody was peroxidase AffiniPure Goat Anti-Rabbit IgG (H+L) (#111-035-045; Jackson ImmunoResearch, West Grove, PA). diluted 1:5000 in TBS. Detection was performed using Amersham ECL Western Blotting Detection Reagent, according to the manufacturer’s instructions (GE Healthcare Life Science, Pittsburg, PA). Lane quantification was performed after image scanning and post hoc analysis using ImageJ.
Results
To achieve our goal of evaluating niche-related genes that play a role in HSPC activity after transplant, we sought to compare the gene expression of irradiated niche cells with that of nonirradiated niche cells. We chose the zebrafish for our initial screen based on its conservation of the hematopoietic system,15 our prior experience in characterizing HSPC homing in the zebrafish,17,22 and the relative ease of isolation of marrow niche cells vs that of mice.
Zebrafish marrow is a center-body organ that can be quickly isolated by dissection. In contrast, murine marrow is housed within a mineralized bone cavity that is rich in adherent dense connective tissues and often requires enzymatic digestion for ideal cellular isolation. We capitalized on the fact that many of the marrow niche cells are larger in size compared with HSPCs, a phenomenon that is conserved across species. Estimates for HSPCs are 5 to 13 μm, which can be isolated in a single-cell suspension.23 In contrast, fibroblasts, endothelial cells, mesenchymal stromal cells, and other niche cells are often much larger (40-100 μm) and frequently are densely connected.24,25 Zebrafish marrow is located within the kidney and contains a few additional cell types not normally found in mammalian marrow, such as renal tubules and duct cells that are also much larger than the surrounding HSPCs.26 Although these renal cells’ role in hematopoiesis is not completely clear, they have been shown to be a source of SDF1 and play a role in HSPC homing.18 Therefore, we used a simple filtering technique to separate niche-related cells from HSPCs based on cell size (Figure 1A). We isolated adult zebrafish whole kidney marrow (WKM) by dissection, followed by filtering through a 40-μm mesh filter to allow for niche cell enrichment (the retentate).
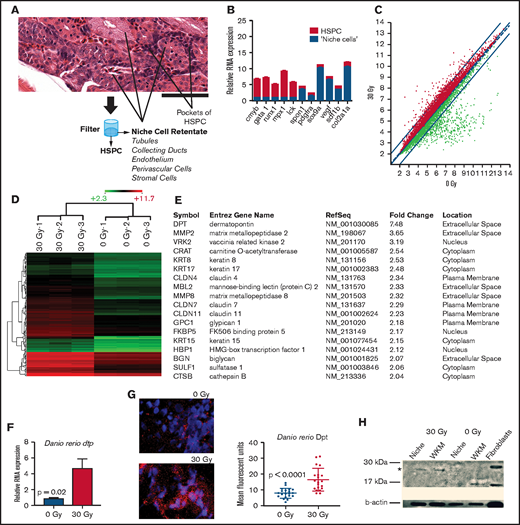
Gene expression analysis in zebrafish marrow niche cells reveals dpt as a modulator of hematopoietic cell homing. (A) Strategy for enriching marrow niche cells. The zebrafish marrow compartment contains hematopoietic cells, endothelial cells, renal tubules, and other supportive niche cells shown by hematoxylin and eosin staining. Tituration and filtration through a 40-μm filter allows for smaller HSPCs to be separated from larger niche cells. See supplemental Figure 1 for full image. Scale bar, 50 μm. (B) qRT-PCR of hematopoietic (red) and niche-related (blue) factors in marrow cells that were separated using a filter into 2 cell fractions. n = 3 to 6 animals per group (technical triplicates) in 2 independent experiments. P < .01 for each gene (niche vs hematopoietic). (C) Scatter plot of Affymetrix RNA array expression data from niche cells isolated 24 hours after zebrafish received 0-Gy or 30-Gy radiation. Axes give expression in log2. The thin red lines demark a twofold change in gene expression; radiation-induced increased gene expression is indicated by red dots and decreased expression is indicated by green dots (n = 3 per condition). (D) Unsupervised cluster analysis of 144 niche-related genes induced after radiation. Red indicates genes that were expressed more highly (more than twofold) after 30 Gy. Green indicates genes with a lower expression level in irradiated animals (more than twofold). Scale bar indicates absolute log2 expression scale (2.3-11.7). (E) Ingenuity Pathway Analysis showing the highest ranked network (score of 41) and its composition of 18 proteins. (F) qRT-PCR of Dpt expression in the marrow after 30-Gy radiation (n = 6 per group). (G) Immunofluorescence of Dpt in zebrafish 24 hours after radiation. Quantitation was performed using ImageJ; 24 images were quantified across 3 biologic replicates per condition. (H) Western blot of zebrafish WKM for Dpt (*) 24 hours after radiation. A human fibroblast line served as a positive control.
Gene expression analysis in zebrafish marrow niche cells reveals dpt as a modulator of hematopoietic cell homing. (A) Strategy for enriching marrow niche cells. The zebrafish marrow compartment contains hematopoietic cells, endothelial cells, renal tubules, and other supportive niche cells shown by hematoxylin and eosin staining. Tituration and filtration through a 40-μm filter allows for smaller HSPCs to be separated from larger niche cells. See supplemental Figure 1 for full image. Scale bar, 50 μm. (B) qRT-PCR of hematopoietic (red) and niche-related (blue) factors in marrow cells that were separated using a filter into 2 cell fractions. n = 3 to 6 animals per group (technical triplicates) in 2 independent experiments. P < .01 for each gene (niche vs hematopoietic). (C) Scatter plot of Affymetrix RNA array expression data from niche cells isolated 24 hours after zebrafish received 0-Gy or 30-Gy radiation. Axes give expression in log2. The thin red lines demark a twofold change in gene expression; radiation-induced increased gene expression is indicated by red dots and decreased expression is indicated by green dots (n = 3 per condition). (D) Unsupervised cluster analysis of 144 niche-related genes induced after radiation. Red indicates genes that were expressed more highly (more than twofold) after 30 Gy. Green indicates genes with a lower expression level in irradiated animals (more than twofold). Scale bar indicates absolute log2 expression scale (2.3-11.7). (E) Ingenuity Pathway Analysis showing the highest ranked network (score of 41) and its composition of 18 proteins. (F) qRT-PCR of Dpt expression in the marrow after 30-Gy radiation (n = 6 per group). (G) Immunofluorescence of Dpt in zebrafish 24 hours after radiation. Quantitation was performed using ImageJ; 24 images were quantified across 3 biologic replicates per condition. (H) Western blot of zebrafish WKM for Dpt (*) 24 hours after radiation. A human fibroblast line served as a positive control.
To show that this simple method could enrich for niche cells, we performed quantitative reverse transcription polymerase chain reaction (qRT-PCR) for genes expressed in HSPCs vs niche cells. Figure 1B shows that niche-associated gene expression (spon1, pdgfra, sox9a, vegf, sdf1b, col12a1) was significantly increased (up to 10-fold) in the retentate portion of the cell isolation. HSPC-related genes (cmyb, gata1, mpx1, lck) were more highly expressed (up to 10-fold) in the flow-through fraction, suggesting that we could achieve enrichment of niche-related cell types that would benefit our downstream studies.15
Following marrow pre-HCT conditioning, such as radiation, numerous cytokines that govern HSPC homing are increased in concentration prior to HCT.27 To determine niche gene expression changes induced by conditioning in the zebrafish, we performed expression analysis on RNA prepared from filter-enriched zebrafish WKM niche cells after myeloablative radiation compared with nonirradiated controls. We found 194 upregulated (at least twofold) genes and 439 downregulated (at least twofold) genes in irradiated niche cells (Figure 1C-D). Gene network analysis was performed using Ingenuity Pathways Analysis; the top-ranked network is shown in Figure 1E. We focused on genes that are expressed at the cell membrane or are extracellularly secreted vs the transcription factors, because the former would be more likely to modulate intrinsic HSPC activity. One particular gene that was found to be elevated in irradiated niche cells was dermatopontin (dpt), a small (23-kDa) noncollagenous extracellular matrix (ECM) protein that we previously described in the murine marrow ECM.28 Other work has shown that murine DPT can play a positive role in ex vivo culture expansion of HSPCs,29 although we have shown that DPT-KO mice do not have any steady-state hematopoietic deficits and do have increased peripheral HSPC mobilization capacity, suggesting a role in cell trafficking.28 DPT has been described as being present in the skin, bone, fibroblasts, and plasma.30-32 Interestingly, DPT has deep evolutionary origins, and its protein ancestors can be found in the ECM that makes up the shells of early sea creatures, such as mollusks.33
We verified the microarray gene expression results using qRT-PCR and found that zebrafish WKM dpt was induced 4.6-fold after radiation (P = .02; Figure 1F). Immunofluorescence for Dpt in zebrafish WKM showed a non–cell-associated staining pattern as expected for an ECM-related protein (Figure 1G), and there was a 2.1-fold increase in Dpt protein in WKM 24 hours after radiation (P < .0001), which was verified by western blot (Figure 1H).
To understand the potential role for Dpt in HSPC homing, we used a previously characterized zebrafish adoptive transfer model (Figure 2A).34 We initially used a bioluminescence (BLI)-based system to evaluate donor marrow cell homing to the recipient marrow.20 Donor WKM cells harboring luciferase under the control of the constitutive ubiquitin promoter (ubi:luciferase) were coincubated with murine rDPT prior to adoptive transfer into irradiated recipients via intracardiac injection. Homed cells were assessed via BLI of the recipient WKM region 2 days after transplant, as previously described.20 We found a significant decrease in the amount of donor cells homed after rDPT exposure (Figure 2B; P = .03). To allow for more precise quantification of the number of homed donor cells using flow cytometry, we performed a similar experiment using GFP+ donor marrow from bactin2:EGFP zebrafish and found a 50% reduction in WKM-homed donor cells with rDPT exposure (Figure 2C; P = .02). These data gave the first indication that DPT may hinder the ability of HSPCs to migrate to the marrow niche after adoptive transfer.
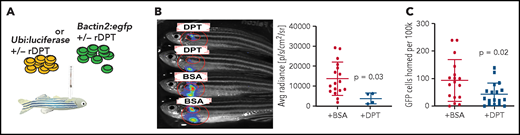
DPT reduces HSPC homing in the zebrafish. (A) Schema of zebrafish homing assays. Zebrafish received 25-Gy radiation and 2 days later underwent HCT via intracardiac injection of 250 000 ubi:luciferase or bactin2:EGFP donor WKM cells. (B) Representative BLI 48 hours after transplantation of ubi:luciferase marrow cells pretreated with rDPT (or bovine serum albumin) (left panel). BLI was determined using an IVIS Spectrum in vivo imaging system. The recipient WKM region of interest is circled in red. Bar graph indicating BLI signal quantification is shown (right panel). (C) Flow cytometry quantification of homed of bactin2:EGFP donor marrow cells 16 hours after HCT. n = 20 or 21 animals per group in 3 independent experiments. All data are means with standard deviations. The P values were derived using the Student t test. BSA, bovine serum albumen; +/−, with or without.
DPT reduces HSPC homing in the zebrafish. (A) Schema of zebrafish homing assays. Zebrafish received 25-Gy radiation and 2 days later underwent HCT via intracardiac injection of 250 000 ubi:luciferase or bactin2:EGFP donor WKM cells. (B) Representative BLI 48 hours after transplantation of ubi:luciferase marrow cells pretreated with rDPT (or bovine serum albumin) (left panel). BLI was determined using an IVIS Spectrum in vivo imaging system. The recipient WKM region of interest is circled in red. Bar graph indicating BLI signal quantification is shown (right panel). (C) Flow cytometry quantification of homed of bactin2:EGFP donor marrow cells 16 hours after HCT. n = 20 or 21 animals per group in 3 independent experiments. All data are means with standard deviations. The P values were derived using the Student t test. BSA, bovine serum albumen; +/−, with or without.
To determine whether dermatopontin biology was similar in the mouse and zebrafish, we next evaluated murine bone marrow Dpt expression in response to radiation exposure; like in the zebrafish, we found an 8.4-fold increase in expression (P = .005; Figure 3A). Similarly, murine spleen exhibited a 3.6-fold increase in Dpt expression after irradiation (P = .005; Figure 3A). DPT has also been identified in the human serum as a possible factor that aids in wound healing.35 We measured circulating levels of plasma DPT by enzyme-linked immunosorbent assay (ELISA) and immunoblot that showed an increase in circulating DPT in mice postradiation exposure (Figure 3B-C). We observed a significant increase at 24 and 48 hours (499 pg/mL vs 1047 pg/mL; P < .01) after radiation and a return to baseline levels starting at 72 hours. Finally, we found that mice exposed to lipopolysaccharide (LPS) can generate increased levels of circulating DPT (approximately twofold), suggesting that plasma DPT levels are responsive to an inflammatory trigger other than radiation (Figure 3D). As an additional measure of radiation-induced inflammation, we measured the response of C-reactive protein and found a 27% increase in its concentration over baseline (supplemental Figure 2).
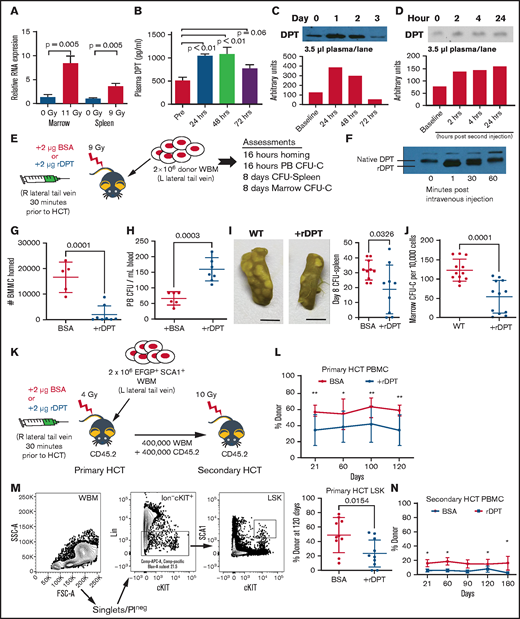
Murine DPT is induced by conditioning, and supranormal levels of DPT affect the homing and engraftment. (A) qRT-PCR of Dpt expression in marrow (11-Gy radiation; n = 6 animals per group) and spleen (9-Gy radiation; n = 5 animals per group). (B) ELISA of plasma DPT expression in mice after 9-Gy radiation (n = 4-6 animals per time point). (C) Western blot of murine plasma DPT after 11-Gy radiation, with band semiquantification shown below. (D) Western blot of murine plasma DPT after treatment with LPS to induce inflammation, with band semiquantification shown below. (E) Schema for (F-I). CD45.2 animals were injected IV via the lateral tail vein with 2 μg of murine rDPT 24 hours after receiving 9-Gy radiation. Following rDPT delivery, 2 million EGFP+ WBMs were injected in the contralateral tail vein. (F) Western blot of plasma DPT (native) and rDPT following IV injection of rDPT. The rDPT is slightly smaller than native DPT, as shown by a shift in molecular weight. (G) Number of donor cells homed to the marrow, as determined by flow cytometry 16 hours after transplant (n = 5-8 animals per group). Gating strategy is shown in supplemental Figure 3. (H) Peripheral blood (PB) CFU-C assessed 16 hours after transplant (n = 6 animals per group). (I) CFU-spleen assessed 8 days after transplant. Photographs show examples of harvested spleens after fixation with Bouin’s solution (left and middle panels). Scale bars, 5 mm. Each dot represents an individual animal (right panel). (J) The number of donor hematopoietic CFU-C in the marrow was assessed 8 days after transplant. (K) Schema for primary and secondary HCT. CD45.2 mice were injected IV via the lateral tail vein with 2 μg of murine rDPT 24 hours after sublethal (4-Gy) radiation. Within 30 minutes following rDPT delivery, 2 million CD45.1 donor WBM cells were injected in the contralateral tail vein. (L) Peripheral CD45.1 donor engraftment after the primary transplant (n = 10-12 animals per group). (M) Flow cytometry gating strategy for evaluation of donor LSK engraftment at 4 months after primary HCT. (N) Peripheral donor engraftment after secondary transplant (n = 9-10 animals per group). All data are shown as means and standard deviation, unless otherwise noted. *P < .05, **P < .01, Student t test. BMMC, bone marrow mononuclear cell; BSA, bovine serum albumin; FSC, forward scatter; L, left; PBMC, peripheral blood mononuclear cell; PI, propidium iodide; Pre, pretreatment; R, right; SSC, side scatter.
Murine DPT is induced by conditioning, and supranormal levels of DPT affect the homing and engraftment. (A) qRT-PCR of Dpt expression in marrow (11-Gy radiation; n = 6 animals per group) and spleen (9-Gy radiation; n = 5 animals per group). (B) ELISA of plasma DPT expression in mice after 9-Gy radiation (n = 4-6 animals per time point). (C) Western blot of murine plasma DPT after 11-Gy radiation, with band semiquantification shown below. (D) Western blot of murine plasma DPT after treatment with LPS to induce inflammation, with band semiquantification shown below. (E) Schema for (F-I). CD45.2 animals were injected IV via the lateral tail vein with 2 μg of murine rDPT 24 hours after receiving 9-Gy radiation. Following rDPT delivery, 2 million EGFP+ WBMs were injected in the contralateral tail vein. (F) Western blot of plasma DPT (native) and rDPT following IV injection of rDPT. The rDPT is slightly smaller than native DPT, as shown by a shift in molecular weight. (G) Number of donor cells homed to the marrow, as determined by flow cytometry 16 hours after transplant (n = 5-8 animals per group). Gating strategy is shown in supplemental Figure 3. (H) Peripheral blood (PB) CFU-C assessed 16 hours after transplant (n = 6 animals per group). (I) CFU-spleen assessed 8 days after transplant. Photographs show examples of harvested spleens after fixation with Bouin’s solution (left and middle panels). Scale bars, 5 mm. Each dot represents an individual animal (right panel). (J) The number of donor hematopoietic CFU-C in the marrow was assessed 8 days after transplant. (K) Schema for primary and secondary HCT. CD45.2 mice were injected IV via the lateral tail vein with 2 μg of murine rDPT 24 hours after sublethal (4-Gy) radiation. Within 30 minutes following rDPT delivery, 2 million CD45.1 donor WBM cells were injected in the contralateral tail vein. (L) Peripheral CD45.1 donor engraftment after the primary transplant (n = 10-12 animals per group). (M) Flow cytometry gating strategy for evaluation of donor LSK engraftment at 4 months after primary HCT. (N) Peripheral donor engraftment after secondary transplant (n = 9-10 animals per group). All data are shown as means and standard deviation, unless otherwise noted. *P < .05, **P < .01, Student t test. BMMC, bone marrow mononuclear cell; BSA, bovine serum albumin; FSC, forward scatter; L, left; PBMC, peripheral blood mononuclear cell; PI, propidium iodide; Pre, pretreatment; R, right; SSC, side scatter.
To understand whether increasing plasma levels of DPT could alter HSPC marrow homing in a murine model of adoptive transfer, we treated animals with 2 µg of rDPT just prior to HCT (see schema in Figure 3E). To assure that DPT levels were supranormal, we performed western blot immediately after rDPT injection and found bolstered levels of DPT within minutes in the circulation that lasted for ≥30 minutes (Figure 3F). Therefore, all subsequent transplants were performed within 30 minutes of rDPT delivery. Initial homing experiments demonstrated that rDPT pretreatment led to an 86% decrease in bone marrow mononuclear cell homing to the marrow (Figure 3G; P = .001). Not unexpectedly, the CFU-Cs that were in the peripheral circulation were elevated in the rDPT group by almost twofold compared with control animals (Figure 3H; P = .003). CFU-spleen Day 8, a measure of committed progenitors, was 63% lower after rDPT pretreatment (33 colonies vs 19 colonies; P = .03; Figure 3I). Similarly, we also found that homed CFU-C in the marrow was decreased 50% in rDPT-pretreated animals after adoptive transfer (117 CFU vs 61 CFU per 100 000 cells; P = .0001; Figure 3J). The primary amino acid sequence on DPT contains a putative heparan binding domain, and heparin has been shown to inhibit DPT activity in vitro.36,37 We evaluated homing following rDPT combined with heparin administration and found that heparin reversed the rDPT-mediated inhibition of cellular homing (P = .0013; supplemental Figure 4).
To understand whether rDPT-mediated depressed homing resulted in a long-term deficit in engraftment, we performed congenic transplant experiments using sublethal conditioning with or without rDPT. Sublethal conditioning (4 Gy) was intentionally chosen because the potential loss of hematopoietic homing in a lethally irradiated animal would likely result in graft failure and no evaluable outcome (schema shown in Figure 3K). Figure 3L shows that DPT exposure prior to HCT led to a significantly lower peripheral CD45+ donor engraftment of 33% compared with control animals (57%) at 4 months posttransplant (P < .01). Evaluation of donor lin−SCA1+cKIT+ (LSK) cells at 6 months showed donor LSK cell engraftment of 21% in the rDPT-treated group vs 50% in the control group (P = .01), consistent with a suppressive effect of DPT on HSPC engraftment (Figure 3M). Finally, secondary HCT reflected further suppressed peripheral engraftment that was observed in the primary transplant recipients (Figure 3N).
Adhesion and transmigration through the vascular endothelial wall are the initial steps in HSPC homing to the marrow. To learn whether hematopoietic-endothelial interactions were affected by the presence of DPT, we measured in vitro hematopoietic cell adhesion to human umbilical vein endothelial cells (HUVECs). We determined that the addition of rDPT led to a 50% reduction in hematopoietic cell adhesion to HUVECs (Figure 4A; P = .0003). We next performed hematopoietic cell migration assays through Transwell permeable support membranes and found that exogenous DPT did not affect migration of cells alone (Figure 4B; P = .38). Contrary to this, exogenous DPT did negatively affect hematopoietic cell migration across an endothelial monolayer of HUVECs by nearly 50% (Figure 4C; P = .02). We next tested an additional endothelial cell line, human dermal microvascular cells (HDMECs), in adhesion assays. We found that rDPT mediated a decrease in hematopoietic cell adhesion, but it was significantly enhanced upon activation of the endothelium with tumor necrosis factor-α (TNF-α; Figure 4D; P = .03). We subsequently developed a “cell release” assay to determine whether previously adhered hematopoietic cells could be liberated from an HDMEC monolayer after exposure to rDPT. The release assay (Figure 4E) showed that previously adhered hematopoietic cells were liberated from the endothelial monolayer into the supernatant upon exposure to increasing doses of DPT; this effect was more pronounced when lin− cells were used compared with lin+ cells (Figure 4D-E; P = .0003).
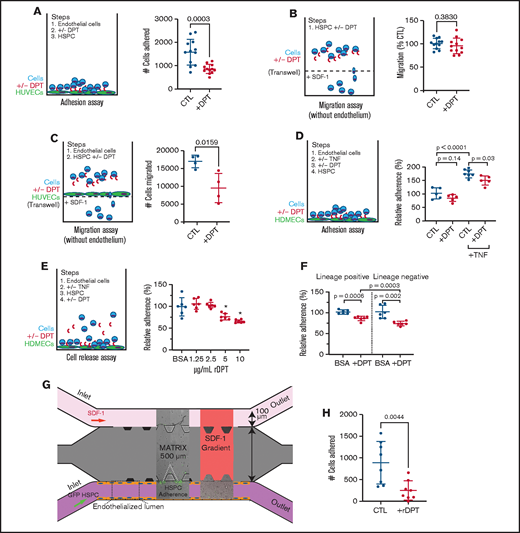
DPT alters the hematopoietic-endothelial cell interaction. (A) Adhesion to HUVECS. Cells were grown to confluency in a 96-well plate. Murine WBM cells were incubated with 2 µg/mL rDPT prior to transfer to endothelial-coated wells. Adhesion occurred over 2 hours, followed by washing and quantification of adhered cells by flow cytometry and counting beads. (B) Cell migration assay; 100 000 murine WBM cells were incubated in the presence of rDPT for 4 hours. The bottom chamber contained SDF1 (0, 1, 10, 50, or 100 ng/mL). The numbers of cells that migrated to the bottom chamber were enumerated by flow cytometry, normalized, and compiled. See supplemental Figure 5 for detailed data about each group. (C) Cell migration assay across endothelial cells; 500 000 SCA1+ cells were incubated with HUVEC-coated Transwells in the presence of rDPT for 4 hours. The numbers of cells that migrated to the bottom chamber were enumerated by flow cytometry. (D) Adhesion to HDMECs. HDMECs were grown to confluency in a 96-well plate and activated with 2 ng/mL TNF-α overnight. Murine WBM cells were labeled with CellTracker Green and incubated with rDPT prior to transfer to endothelial coated wells. Adhesion occurred over 1 hour followed by washing and quantification of adhered cells by fluorometry. (E) Release assay. HDMECs were grown to confluency in a 96-well plate and activated 2 ng/mL TNF-α overnight. Murine WBM cells were labeled with CellTracker Green and incubated with rDPT prior to transfer to HDMEC -containing wells. Adhesion occurred overnight, followed by gentle washing. Increasing amounts of rDPT were added in media for 1 hour at 37°C, followed by gentle washing. Quantification of adhered cells was done by fluorometry. (F) Release assay of lineage separated cells. Experiment was performed as in (E), with the exception that WBM cells underwent separation into lin+ and lin− fractions, prior to use, using magnetic bead isolation. rDPT was used at 5 µg/mL. Raw data for (D-F) are shown in supplemental Figure 6. (G) Schema for microfluidic device to assess HSPC-endothelial adherence under flow; 500 000 lin− cells per milliliter from a ubiquitously expressing EGFP+ mouse were flowed through an endothelialized lumen previously activated with TNF-α. Cell adherence was captured in real-time using fluorescent image capture. (H) Enumeration of cells that adhered to the endothelial wall during flow with and without the addition of 1 µg/mL rDPT (data are pooled from 2 independent experiments). Representative experiments (n = 3-6 wells per condition) of 2 or 3 biologic replicates are shown. All data are means and standard deviations, unless otherwise noted. *P < .05, Student t test. CTL, cytotoxic T lymphocyte; +/−, with or without.
DPT alters the hematopoietic-endothelial cell interaction. (A) Adhesion to HUVECS. Cells were grown to confluency in a 96-well plate. Murine WBM cells were incubated with 2 µg/mL rDPT prior to transfer to endothelial-coated wells. Adhesion occurred over 2 hours, followed by washing and quantification of adhered cells by flow cytometry and counting beads. (B) Cell migration assay; 100 000 murine WBM cells were incubated in the presence of rDPT for 4 hours. The bottom chamber contained SDF1 (0, 1, 10, 50, or 100 ng/mL). The numbers of cells that migrated to the bottom chamber were enumerated by flow cytometry, normalized, and compiled. See supplemental Figure 5 for detailed data about each group. (C) Cell migration assay across endothelial cells; 500 000 SCA1+ cells were incubated with HUVEC-coated Transwells in the presence of rDPT for 4 hours. The numbers of cells that migrated to the bottom chamber were enumerated by flow cytometry. (D) Adhesion to HDMECs. HDMECs were grown to confluency in a 96-well plate and activated with 2 ng/mL TNF-α overnight. Murine WBM cells were labeled with CellTracker Green and incubated with rDPT prior to transfer to endothelial coated wells. Adhesion occurred over 1 hour followed by washing and quantification of adhered cells by fluorometry. (E) Release assay. HDMECs were grown to confluency in a 96-well plate and activated 2 ng/mL TNF-α overnight. Murine WBM cells were labeled with CellTracker Green and incubated with rDPT prior to transfer to HDMEC -containing wells. Adhesion occurred overnight, followed by gentle washing. Increasing amounts of rDPT were added in media for 1 hour at 37°C, followed by gentle washing. Quantification of adhered cells was done by fluorometry. (F) Release assay of lineage separated cells. Experiment was performed as in (E), with the exception that WBM cells underwent separation into lin+ and lin− fractions, prior to use, using magnetic bead isolation. rDPT was used at 5 µg/mL. Raw data for (D-F) are shown in supplemental Figure 6. (G) Schema for microfluidic device to assess HSPC-endothelial adherence under flow; 500 000 lin− cells per milliliter from a ubiquitously expressing EGFP+ mouse were flowed through an endothelialized lumen previously activated with TNF-α. Cell adherence was captured in real-time using fluorescent image capture. (H) Enumeration of cells that adhered to the endothelial wall during flow with and without the addition of 1 µg/mL rDPT (data are pooled from 2 independent experiments). Representative experiments (n = 3-6 wells per condition) of 2 or 3 biologic replicates are shown. All data are means and standard deviations, unless otherwise noted. *P < .05, Student t test. CTL, cytotoxic T lymphocyte; +/−, with or without.
Finally, we used a microfluidic model of hematopoietic cell-endothelial cell interactions in which the hematopoietic cells were in a state of flow through an “artificial vessel,” which would better mimic the microenvironment compared with traditional Transwell experiments.38 We produced an HDMEC-endothelialized lumen on a microscaffold through which GFP+lin− hematopoietic cells were flowed, and direct live-cell imaging of the cells binding to the artificial vascular wall was performed (Figure 4G). We found that 72% fewer cells adhered in the presence of rDPT (890 cells vs 250 cells, respectively; P = .004; Figure 4H). Taken together, these data suggest that elevated levels of DPT may disrupt the hematopoietic-endothelial interaction and help to explain the previously observed effects on homing.
Thus far, 2 receptors have been shown to be important for DPT and were established using human epidermal keratinocytes: the integrin α-3/β-1 and a heparan sulfate proteoglycan-type receptor.36 To characterize additional potential integrin receptors for DPT in our studies, we performed far western blots using endothelial cell membrane–enriched lysate as a source of cellular receptors. We found that DPT could specifically bind to integrin α-3 (ITGA-3) and ITGA4 (aka VLA-4). We found weak binding to ITGB1 and little to no binding to ITGA5 (Figure 5A-C). It is well described that HSPC-endothelial interactions rely on integrin family members; the most characterized pathway is the interaction between VLA-4 (on HSPCs) and VCAM1 (on endothelial cells). This pathway has been shown to be critically important for HSPC adhesion,5 and blockade of VLA-4 results in a significant loss of marrow homing/lodging of HSPCs.39,40 We next tested the effect of rDPT on hematopoietic cell adherence to VCAM1-coated plates and noted that rDPT could decrease adherence by 50% (Figure 5D-E; P = .002), which was comparable to the decrease with coincubation of anti–VLA-4 antibody (a 36% reduction in adherence; P = .02). A short peptide sequence, DP-4, (PHGQVVVAVRS) from DPT has been shown to compete with the full-length protein in fibroblast adhesion assays.36 Testing DP-4’s effect on cell adherence to VCAM1-coated plates showed that DP-4 could decrease adherence by 52% (Figure 5F-G; P = .01) compared with a scrambled control peptide (DP-S).
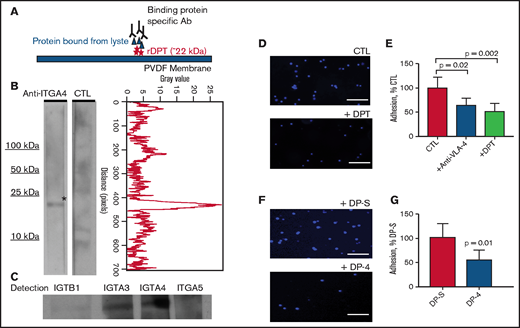
DPT binds to ITGA4 and reduces hematopoietic cell adhesion to VCAM1. (A) Schema of the far western blot strategy. Recombinant dermatopontin (rDPT) was separated by electrophoresis and transferred to PVDF membrane, followed by incubation with endothelial cell whole cell lysate. A binding partner specific antibody (Ab) was used for detection of potential binding partner. (B) Far western blotting shows ITGA4 binding to immobilized rDPT (left panel). The control (CTL) lane incubated without any primary antibody. Quantification of the anti-ITGA4 lane pixel values after scanning densitometry, using ImageJ and the plot profiler function (right panel). (C) Far western blotting using several integrin family antibodies to determine their potential interaction with rDPT. (D) 4′,6-diamidino-2-phenylindole (DAPI)-stained lin− bone marrow cells binding to VCAM1-coated wells, with or without 1 µg/mL DPT. (E) Quantification of lin− cells bound to VCAM1-coated wells was performed using ImageJ. Included are experiments in which anti–VLA-4 was used to inhibit cell adhesion as a control. (F) DAPI-stained lin− bone marrow cell binding to VCAM1-coated wells in the presence of 4 µg/mL DP-4 or DP-S (scrambled) peptide. (G) Quantification of images shown in (F). The bar graphs show the results of 3 independent experiments. Scale bars indicate 100 μm. All data are shown as means with standard deviations. The P values were derived using a Student's t-test. PVDF, polyvinylidene difluoride.
DPT binds to ITGA4 and reduces hematopoietic cell adhesion to VCAM1. (A) Schema of the far western blot strategy. Recombinant dermatopontin (rDPT) was separated by electrophoresis and transferred to PVDF membrane, followed by incubation with endothelial cell whole cell lysate. A binding partner specific antibody (Ab) was used for detection of potential binding partner. (B) Far western blotting shows ITGA4 binding to immobilized rDPT (left panel). The control (CTL) lane incubated without any primary antibody. Quantification of the anti-ITGA4 lane pixel values after scanning densitometry, using ImageJ and the plot profiler function (right panel). (C) Far western blotting using several integrin family antibodies to determine their potential interaction with rDPT. (D) 4′,6-diamidino-2-phenylindole (DAPI)-stained lin− bone marrow cells binding to VCAM1-coated wells, with or without 1 µg/mL DPT. (E) Quantification of lin− cells bound to VCAM1-coated wells was performed using ImageJ. Included are experiments in which anti–VLA-4 was used to inhibit cell adhesion as a control. (F) DAPI-stained lin− bone marrow cell binding to VCAM1-coated wells in the presence of 4 µg/mL DP-4 or DP-S (scrambled) peptide. (G) Quantification of images shown in (F). The bar graphs show the results of 3 independent experiments. Scale bars indicate 100 μm. All data are shown as means with standard deviations. The P values were derived using a Student's t-test. PVDF, polyvinylidene difluoride.
Collectively, these data indicate that DPT potentially interacts with VLA-4 and blocks cellular adhesion and transmigration. We created a DPT-KO mouse to more precisely define the role of DPT in hematopoietic cell biology. Mice were viable and did not have obvious deficits in lifespan or fertility or intrinsic hematopoietic defects.28 Homing experiments in DPT-KO mice revealed that bone marrow mononuclear cells migrated 60% more efficiently to the marrow in DPT-KO mice compared with WT mice, as assessed 16 hours after adoptive transfer, and donor LSK cells migrated 50% more efficiently (Figure 6A; P = .029 and P = .038, respectively). The administration of rDPT to DPT-KO mice prior to adoptive transfer experiments led to a 46% reduction in homing (Figure 6B; P = .0006). CFU-spleen Day 8 were also increased significantly in DPT-KO mice after adoptive transfer compared with WT mice (Figure 6C; P < .0001). These data suggest that DPT is involved in the reduction of hematopoietic cell trafficking, and its absence allows for more accelerated homing to occur after adoptive transfer.
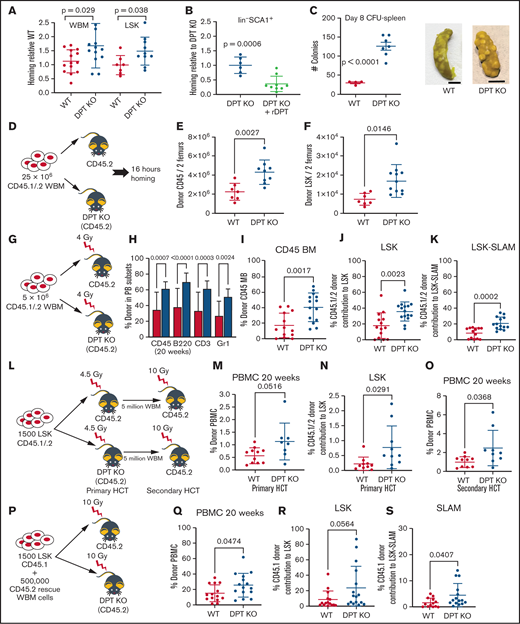
A DPT-KO mouse displays improved homing and long-term engraftment. (A) Homing of donor cells in DPT-KO mice was assessed 16 hours after transplant of 2 million CD45.1 donor WBM cells (n = 12-14 animals per group). (B) Homing in DPT-KO animals, with or without 2 µg/mL rDPT delivery 30 minutes prior to adoptive transfer. Homing after HCT was assessed as in (A). (C) Spleen CFU assay. Two million donor cells were adoptively transferred to irradiated recipients. Eight days after the transplant, spleens were harvested and fixed in Bouin’s solution (middle and right panels), and CFU were enumerated (left panel). Scale bar, 5 mm. (D) Nonradiation transplant paradigm for (R-S). Enumeration of homed donor CD45+ marrow cells (E) and LSK marrow cells (F) in 2 leg bones measured 16 hours after transplant. (G) Sublethal transplant paradigm for (E-H). (H) Peripheral blood (PB) donor engraftment measured 20 weeks after transplant (n = 9 or 10 animals per group). (I) Donor bone marrow (BM) engraftment measured 20 weeks after transplant. (J) Donor LSK cells measured 20 weeks after transplant. (K) Donor LSK-SLAM HSPCs measured 20 weeks after transplant. The flow cytometry gating strategy for (G-H) is shown in supplemental Figure 7A. (L) Sublethal transplant paradigm for panels (N-P). LSK HSPCs were isolated by fluorescence-activated cell sorting (FACS) prior to adoptive transfer into irradiated recipients. (M) Peripheral blood mononuclear cell (PBMC) donor engraftment measured 20 weeks after transplant. (N) Percentage of donor marrow LSK cells in transplanted animals. Four leg bones were harvested for assessment 20 weeks after HCT. (O) Secondary HCT was performed with the primary HCT recipients as donors. Peripheral blood donor engraftment was measured 20 weeks after the secondary transplant. (P) Lethal transplant paradigm for (J-L). LSK HSPCs were isolated by FACS prior to mixture with rescue cells and adoptive transfer into irradiated recipients. (Q) Peripheral blood donor engraftment measured 20 weeks after transplant. (R) Percentage of donor marrow LSK cells in transplanted animals. Four leg bones were harvested for assessment 20 weeks after HCT. (S) Percentage of donor LSK-SLAM HSPCs in transplanted animals. Four leg bones were harvested for assessment 20 weeks after HCT. All data are means and SD. The P values were derived using a Student's t test.
A DPT-KO mouse displays improved homing and long-term engraftment. (A) Homing of donor cells in DPT-KO mice was assessed 16 hours after transplant of 2 million CD45.1 donor WBM cells (n = 12-14 animals per group). (B) Homing in DPT-KO animals, with or without 2 µg/mL rDPT delivery 30 minutes prior to adoptive transfer. Homing after HCT was assessed as in (A). (C) Spleen CFU assay. Two million donor cells were adoptively transferred to irradiated recipients. Eight days after the transplant, spleens were harvested and fixed in Bouin’s solution (middle and right panels), and CFU were enumerated (left panel). Scale bar, 5 mm. (D) Nonradiation transplant paradigm for (R-S). Enumeration of homed donor CD45+ marrow cells (E) and LSK marrow cells (F) in 2 leg bones measured 16 hours after transplant. (G) Sublethal transplant paradigm for (E-H). (H) Peripheral blood (PB) donor engraftment measured 20 weeks after transplant (n = 9 or 10 animals per group). (I) Donor bone marrow (BM) engraftment measured 20 weeks after transplant. (J) Donor LSK cells measured 20 weeks after transplant. (K) Donor LSK-SLAM HSPCs measured 20 weeks after transplant. The flow cytometry gating strategy for (G-H) is shown in supplemental Figure 7A. (L) Sublethal transplant paradigm for panels (N-P). LSK HSPCs were isolated by fluorescence-activated cell sorting (FACS) prior to adoptive transfer into irradiated recipients. (M) Peripheral blood mononuclear cell (PBMC) donor engraftment measured 20 weeks after transplant. (N) Percentage of donor marrow LSK cells in transplanted animals. Four leg bones were harvested for assessment 20 weeks after HCT. (O) Secondary HCT was performed with the primary HCT recipients as donors. Peripheral blood donor engraftment was measured 20 weeks after the secondary transplant. (P) Lethal transplant paradigm for (J-L). LSK HSPCs were isolated by FACS prior to mixture with rescue cells and adoptive transfer into irradiated recipients. (Q) Peripheral blood donor engraftment measured 20 weeks after transplant. (R) Percentage of donor marrow LSK cells in transplanted animals. Four leg bones were harvested for assessment 20 weeks after HCT. (S) Percentage of donor LSK-SLAM HSPCs in transplanted animals. Four leg bones were harvested for assessment 20 weeks after HCT. All data are means and SD. The P values were derived using a Student's t test.
To understand whether DPT affected cell homing in the absence of radiation, we performed adoptive transfer in DPT-KO animals without preconditioning. We found a twofold increase in CD45 donor cell homing to marrow and a 2.3-fold increase in homing of donor LSK cells to the marrow in DPT-KO animals (P = .0027 and P = .0146, respectively; Figure 6D-F). These data suggest that donor cells are more efficient at entering the marrow space, even in the absence of radiation.
Therefore, we next performed experiments in sublethally conditioned animals (Figure 6G). Primary HCT in sublethally irradiated recipients demonstrated significantly enhanced multilineage peripheral immune reconstitution in DPT-KO mice at 20 weeks post-HCT (Figure 6H). Bone marrow from DPT-KO recipients exhibited a mean donor engraftment of 48% compared with 23% in WT animals (Figure 6I-K; P = .002). Donor LSK and LSK-SLAM cells were found at higher numbers in DPT-KO mice 20 weeks after adoptive transfer (Figure 6J-K; P = .0023 and P = .0049, respectively). Some WT animals experienced graft failure, which is known to occur with nonablative conditioning (although this did not occur in DPT-KO mice). Analyses of the data excluding graft failure also showed a significant advantage to engraftment in DPT-KO mice (supplemental Figure 7B).
We performed adoptive transfer of LSK cells in a sublethal irradiation setting in which we expected lower engraftment but were interested in confirming our prior studies (Figure 6L). We found that mean donor peripheral engraftment in DPT-KO mice was higher at 20 weeks post-HCT compared with in WT mice (1.1% vs 0.56%, respectively; P = .052; Figure 6M). Mean donor LSK cells in the marrow were increased 3.7-fold in DPT-KO mice compared with WT mice (0.77% vs 0.21%, respectively; P = .03; Figure 6N). Finally, mean donor peripheral engraftment after secondary HCT was higher in DPT-KO mice vs WT mice (2.5% vs 1.0%, respectively; P = .04; Figure 6O).
We next tested the effect of DPT’s absence in the setting of lethal irradiation. Immune recovery after WBM cells were transplanted into lethally irradiated DPT-KO animals indicated greater total white cell counts and lymphocyte counts 2 weeks after transplant compared with WT animals (P = .02 and P = .007, respectively; supplemental Figure 8A-D). Peripheral engraftment was found to be similar between DPT-KO and WT animals, as was primary engraftment of donor marrow LSK cells at 6 months posttransplant at levels > 90% (supplemental Figure 8E-F).
We evaluated the adoptive transfer of congenic LSK cells into lethally irradiated DPT-KO recipients, with the addition of rescue marrow to avoid lethality resulting from slow recovery (Figure 6P). We determined that DPT-KO mice had higher average peripheral donor chimerism at 20 weeks after transplant compared with WT animals (26% vs 15%; P = .047; Figure 6Q). Mean donor chimerism in LSK cells was also higher in DPT-KO mice than in WT animals at 20 weeks post-HCT (24% vs 8%, respectively), although the Student t test yielded P = .056 (Figure 6R). Mean donor chimerism in LSK-SLAM cells was increased more than twofold in DPT-KO mice vs WT mice (4.5% vs 1.6%, respectively) after primary HCT (Figure 6S; P = .04).
Discussion
DPT is produced and/or released after irradiation, suggesting involvement in an inflammatory response. When elevated, we show that DPT can attenuate cellular migration across an endothelial barrier, as well as reduce cellular homing and engraftment after HCT. Mice with a ubiquitous deletion of DPT show a measurable increase in hematopoietic cell homing. Under sublethal irradiation conditions, we found the greatest effect on long-term engraftment compared with lethal irradiation in DPT-KO mice. This is likely due to the milieu that lethal conditioning creates, resulting in remarkable tissue damage. This leads to tremendous pressure on the donor cells to engraft to allow the animal to survive long term (ie, an “all-or-nothing” phenomenon in terms of engraftment). Host-derived factors that modulate homing/engraftment can then only be revealed in the sublethal setting.
Whether DPT is an inflammation driver or a responder is unknown. Irradiation and chemotherapy are known to produce an inflammatory milieu that affects all cellular compartments/tissues, and the damage-response system becomes activated, not unlike that following LPS exposure.41-43 This response contributes, in part, to the establishment of chemokine gradients that are necessary for HSPCs to successfully home to the marrow after HCT,44 as is the case with SDF1, which increases in the marrow after radiation and recruits HSPCs to the marrow via CXCR4 receptors.1,2,8 SDF1 is also a well-established mediator of lymphocyte migration and adhesion in several models of inflammation.45,46 Although preliminary, we were able to demonstrate higher plasma levels of DPT in patients after chemotherapy compared with plasma levels in patients prechemotherapy, suggesting that DPT may behave in a similar manner in the human host as in these studies (supplemental Figure 9).
One mechanism via which DPT may operate is through blockade of VLA-4 and reduced hematopoietic cell adhesion to endothelial cells. Hematopoietic loss of VLA-4 produces HSPCs that have a markedly reduced capacity for marrow homing, increased presence in the peripheral circulation, and loss of short-term engraftment after transplant, which are similar to our experimental observations with DPT.47 One unique difference is that VLA-4–deficient HSPCs retain the ability to home to the spleen, whereas DPT-treated animals show a reduction in CFU-spleen.47 This observation may indicate a broader inhibition of homing processes by DPT beyond VLA-4.
We show that DPT binds VLA-4, a well-characterized receptor on many cell types and not exclusive to HSPCs. Receptors for DPT on other cell types (eg, stromal cells) are unknown but likely include other integrins and cooperating factors, perhaps other ECM-related proteins. Interestingly, it has been demonstrated that mesenchymal stem cells (MSCs) from placenta and marrow express VLA-4, with placental MSCs expressing greater amounts of VLA-448 ; however, only placental MSCs bind VCAM1, suggesting that VLA-4 receptor density is a factor in target interactions.48 This observation could explain how the same protein acts differently depending on the microenvironment. We hypothesize that DPT is sterically hindering VLA-4 activity, although the exact binding site on VLA-4 is not known. Our observations do not exclude other mechanisms, such as the potential of DPT to decrease receptor expression via increased turnover or induce a change in transcription.
Recently, it has been demonstrated that DPT can function in the ex vivo murine stromal AFT024-mediated culture expansion of murine hematopoietic stem cells (HSCs), in so far that AFT024 expressing lower levels of DPT was shown to have less HSC growth-promoting potential.29 It was hypothesized that DPT was acting to help tether HSCs to the stromal layer and perhaps allow for improved contact between HSCs and growth factors produced by stroma-augmenting paracrine signals. We also observed previously that DPT can directly bind HSPCs and modulate their adherence to OP9 murine stroma cells.28 Conversely, in the context of HSPC adherence to endothelial cells, we found the reverse effect: the presence of DPT led to reduced adherence. Furthermore, when exogenous DPT was added to endothelial cells with adhered HSPCs, the cells detached. This suggests that DPT can have different roles depending on the environment in which it is functioning and what receptors it encounters (and at what expression level). One can speculate that although circulating DPT attenuates HSPC-endothelial adherence, intraniche levels of DPT may aid in HSPC adherence to stromal cells after diapedesis through the endothelial barrier has occurred, promoting lodgment and support to reestablish hematopoietic homeostasis of the donor cells.
The ECM is fundamentally important as a modulator of HSPC passage into, and for maintenance within, the marrow; there are examples of ECM-related proteins having positive and negative effects on HSPC activity. Fibronectin and collagen, making up a large component of the ECM, have been shown to have positive effects on adherent cell expansion in long-term human bone marrow cultures.49 The ECM component Tenascin C (TN-C) has been shown to be upregulated after myeloablation, and TN-C−/− mice fail to reconstitute after marrow ablation, although they did not display any abnormalities in steady-state hematopoiesis.50 Furthermore, expansion of HSPCs on TN-C as a substrate was integrin α9 dependent, providing an important example of an HSPC integrin–ECM interaction.
Conversely, galectin-1 (Gal-1), a secreted endothelial ECM-associated protein structurally related to the lectin family, has been shown to inhibit lymphocyte adhesion to endothelial cells under flow.51 Furthermore, Gal-1–KO mice show increases in lymphocyte homing to lymph nodes.51 Such observations suggest that Gal-1 is a negative regulator of cellular binding and homing, which is similar in function to what we observed with DPT. Overall, Gal-1 is believed to have anti-inflammatory and immune modulatory properties for many cell types, including B cells, T cells, and MSCs,52 but it is unknown whether DPT possesses such a role.
It is worth mentioning that DPT may play a role in the migration/metastases of cancer cells. Is has been demonstrated that loss of DPT expression was associated with hepatocellular carcinoma (HCC) and leiomyoma.53,54 Specially, DPT was significantly downregulated in 202 HCC clinical samples, and its expression level was closely correlated with cancer metastasis and patient prognosis.55 Overexpression of DPT dramatically suppressed HCC cell migration in vitro and intrahepatic metastasis in vivo.55 Yamatoji et al further showed that human oral squamous cell carcinoma–derived cells also showed downregulation of DPT messenger RNA and protein compared with normal oral keratinocytes.56 DPT overexpression led to increased adhesion and decreased invasiveness in in vitro assays. Oral squamous cell carcinoma cells from patients (n = 97) with regional lymph node metastasis expressed significantly lower levels of DPT than did cells from patients without spread.56 DPT interacts with ECM components, such as collagen species, and may alter the metastatic microenvironment. We found a slight decrease in circulating collagen I in DPT-KO mice compared with WT (supplemental Figure 10; P = .10), but a robust analysis of ECM components has yet to be done. Although specific mechanisms are being investigated, these data suggest a broader role for DPT in mitigating the migration of cancer cells.
In summary, we show that the small noncollagenous protein DPT is upregulated after a radiation-induced inflammatory insult in zebrafish and mice. Exposure to elevated levels of DPT reduced hematopoietic cell homing, as well as short- and long-term engraftment. DPT-KO mice displayed enhanced hematopoietic cell homing and engraftment. DPT can interact with the VLA-4 receptor and blocks hematopoietic cell adherence to endothelial cells. Whether this serves as an off-target “bystander” effect or some type of anti-inflammatory mechanism remains to be seen. We can only guess that DPT is some type of “repair protein” that has unintended effects on hematopoietic cells when highly expressed. The mammalian body was not designed to experience myeloablative radiation; perhaps as a part of the damage response system, DPT plays a role in tissue repair or clotting57,58 but impedes homing as an unintended side effect. Alternatively, DPT may force immune cells to stay intravascular for longer periods of time to facilitate the repair of endothelial cells. We note that our description of DPT’s activities show it to be a transient regulator that is ultimately overcome during engraftment, as evidenced by the fact that mice/people do engraftment successfully after conditioning (ie, DPT is only part of a larger regulatory pathway, and given the ubiquitous expression of DPT, we speculate that it has multiple roles that depend on its microenvironmental context.
Acknowledgments
This work was supported in part by the National Institutes of Health, National Heart, Lung, and Blood Institute (K08HL108998, R03HL133318), an American Society of Hematology Bridge Grant, and the State of Minnesota, through a Regenerative Medicine Minnesota Award (T.C.L). The Zebrafish Atlas was supported by National Institutes of Health, National Center for Research Resources grant R24 RR01744, the Jake Gittlen Cancer Research Foundation, and the PA Tobacco Settlement Fund.
Authorship
Contribution: A.C.K., Y.A., A.L.B., and M.E.T performed key transplant and homing experiments; B.R.W. generated the DPT-KO mice and assisted with characterization; A.E. and M.J.L. performed adhesion assays; A.G. and D.K.W. performed the microfluidic experiments; J.W.F. performed ELISAs; E.E.N and W.W.D. performed some transplant experiments; and J.T., B.R.B., and T.C.L. wrote and edited the manuscript.
Conflict-of-interest disclosure: The authors declare no competing financial interests.
Correspondence: Troy C. Lund, University of Minnesota, Pediatric Blood and Marrow Transplant Division, Metabolic Program, Stem Cell Institute, Global Pediatrics, MMC 366/420 Delaware St SE, Minneapolis, MN 55455; e-mail: lundx072@umn.edu.

