

Key Points
Clustering analysis from proteomic quantification of iMCD serum identified a novel subgroup with superior siltuximab response.
Enrichment analyses and immunohistochemistry identified JAK-STAT3 signaling as a candidate therapeutic target in iMCD.

Abstract
Idiopathic multicentric Castleman disease (iMCD) is a poorly understood hematologic disorder involving cytokine-induced polyclonal lymphoproliferation, systemic inflammation, and potentially fatal multiorgan failure. Although the etiology of iMCD is unknown, interleukin-6 (IL-6) is an established disease driver in approximately one-third of patients. Anti–IL-6 therapy, siltuximab, is the only US Food and Drug Administration–approved treatment. Few options exist for siltuximab nonresponders, and no validated tests are available to predict likelihood of response. We procured and analyzed the largest-to-date cohort of iMCD samples, which enabled classification of iMCD into disease categories, discovery of siltuximab response biomarkers, and identification of therapeutic targets for siltuximab nonresponders. Proteomic quantification of 1178 analytes was performed on serum of 88 iMCD patients, 60 patients with clinico-pathologically overlapping diseases (human herpesvirus-8–associated MCD, N = 20; Hodgkin lymphoma, N = 20; rheumatoid arthritis, N = 20), and 42 healthy controls. Unsupervised clustering revealed iMCD patients have heterogeneous serum proteomes that did not cluster with clinico-pathologically overlapping diseases. Clustering of iMCD patients identified a novel subgroup with superior response to siltuximab, which was validated using a 7-analyte panel (apolipoprotein E, amphiregulin, serum amyloid P-component, inactivated complement C3b, immunoglobulin E, IL-6, erythropoietin) in an independent cohort. Enrichment analyses and immunohistochemistry identified Janus kinase (JAK)/signal transducer and activator of transcription 3 signaling as a candidate therapeutic target that could potentially be targeted with JAK inhibitors in siltuximab nonresponders. Our discoveries demonstrate the potential for accelerating discoveries for rare diseases through multistakeholder collaboration.
Introduction
Idiopathic multicentric Castleman disease (iMCD) is a rare hematologic disorder with an estimated annual incidence of approximately 1500 individuals in the United States and a 35% to 45% 5-year overall mortality.1-3 iMCD is 1 of 3 subtypes of multicentric Castleman disease (MCD), which also includes forms of MCD caused by uncontrolled human herpes virus-8 (HHV8) infection (HHV8-associated MCD) or associated with polyneuropathy, organomegaly, endocrinopathy, monoclonal protein, skin changes (POEMS) syndrome.4 Patients with iMCD present with a wide range of nonspecific clinical and pathologic features including cytokine-induced polyclonal lymphoproliferation, systemic inflammation, cytopenias, and multiorgan failure. No specific causes of iMCD have as yet been elucidated, and the heterogeneous clinical presentation raises the possibility that multiple etiologies may exist. Many features of iMCD are observed in autoimmune, neoplastic, and infectious diseases, such as rheumatoid arthritis (RA), Hodgkin lymphoma (HL), and HHV8-associated MCD.5 Specifically, autoantibodies, a hallmark of autoimmune diseases, can be present in iMCD, the lymphoproliferative pattern described in iMCD can mimic lymphoma, and intense episodes of acute inflammation, similar to a viral infection, often occur.
Although etiology is unknown, interleukin-6 (IL-6) has been identified as a disease driver in a portion of patients.6,7 IL-6 is a pleiotropic cytokine that leads to activation of signaling pathways associated with survival and proliferation, most notably the Janus kinase/signal transducer and activator of transcription 3 (JAK-STAT3) pathway.8 Monoclonal antibodies directed against IL-6 (siltuximab) and the IL-6 receptor (tocilizumab) abrogate IL-6/IL-6Rα-induced signaling in iMCD.9,10 At present, siltuximab is the only US Food and Drug Administration (FDA)-approved therapy and recommended first line.11 However, 66% of iMCD patients treated in the siltuximab phase 2 registrational study did not meet primary response criteria, and pretreatment IL-6 levels were not a strong predictor of response.10,12 No validated algorithms exist to identify patients likely to respond to anti–IL-6 therapy. Identifying validated predictive biomarkers would be of benefit to nonresponders, who are often in critical condition and have limited time to wait before additional therapies are needed. Off-label monoclonal antibodies, such as rituximab, and cytotoxic chemotherapies are often tried for siltuximab nonresponders, but these can have substantial toxicities as well as unclear efficacy.13 Thus, the discovery of novel therapeutic targets is also urgently needed.
Nascent proteomics approaches provide unique opportunities to discover biomarkers and therapeutic targets for siltuximab nonresponders, 2 major unmet medical needs in iMCD. Advances in mass spectrometry and multiplex DNA aptamer–based proteomic quantification platforms have improved precision and replicability. To determine the appropriate disease classification for iMCD, identify biomarkers of response, and discover treatment targets for siltuximab nonresponders, we used a multiplex DNA aptamer–based platform for quantification of 1305 serum analytes from 88 iMCD patients, 60 patients with clinico-pathologically overlapping diseases, and 42 healthy donors.
Here, we reveal a novel iMCD subgroup with superior response to siltuximab that we validated using an independent cohort and orthogonal platform. We also identified novel candidate pathways involved in iMCD pathogenesis, some of which are known targets for FDA-approved drugs. Finally, we validated JAK-STAT3 as a candidate therapeutic target using orthogonal methods.
Materials and methods
Proteomics samples and clinical data
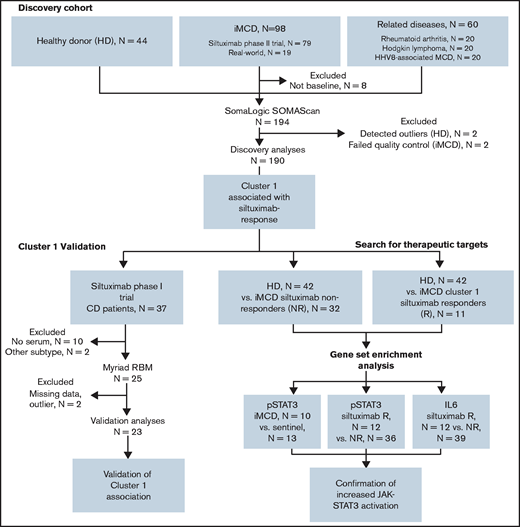
For our discovery cohort, we obtained samples from 88 iMCD patients, with N = 73 pretreatment disease flare samples collected as part of the siltuximab phase 2 study (NCT01024036) and N = 15 disease flare samples collected in real-world practice from 6 sites. Samples collected in real-world practice were included to better represent the full spectrum of iMCD. We obtained samples from 60 patients with comparator diseases, including HHV8-associated MCD (N = 20), HL; N = 20, and RA; N = 20, and 42 healthy individuals. An independent cohort of 23 iMCD patients enrolled in the siltuximab phase 1 study (NCT00412321) served as a validation cohort. All serum samples from the phase 1 and the phase 2 studies were collected and processed following respective standardized protocols.
Clinical and laboratory data were collected at the time of sample draw for iMCD patients. To assess disease activity, we adapted a previously published disease activity score using C-reactive protein, hemoglobin, and albumin.14 Response to siltuximab was assessed by durable symptomatic and tumor (radiologic lymph node) response criteria15 for patients in the phase 2 study and by radiologic lymph node response criteria (at least partial response by Cheson criteria)15 for patients in the phase 1 study. Of note, 18 of 20 patients in the phase 2 study who achieved radiologic lymph node response by Cheson criteria also achieved durable symptomatic response, indicating that radiologic lymph node response is a consistent identifier of response in both studies. All patients provided informed consent, and the research was approved by the Quorum Review Institutional Review Board. Study flow and clinical characteristics of iMCD patients in the discovery and validation cohorts are shown in Figure 1 and supplemental Table 1, respectively.
Advocacy-industry-academic collaboration using multiple technologies and platforms to perform precision medicine science on a collection of iMCD samples.
Advocacy-industry-academic collaboration using multiple technologies and platforms to perform precision medicine science on a collection of iMCD samples.
Proteomics platforms
In the discovery cohort, SomaLogic SOMAscan was used to measure 1305 serum analytes by DNA-based aptamer technology,16 of which 1178 passed quality control and were included in analyses of the discovery dataset.17 Each analyte was log2 transformed and capped at the 2.5th and 97.5th percentiles.
In the validation cohort, Rules-Based Medicine (RBM) DiscoveryMap v1.0 was used to measure 190 serum analytes by a microsphere-based, multiplexed immunoassay.18 Values were standardized, log2 transformed, and truncated at the least detectable dose. Of 190 proteins measured by RBM, 154 can be mapped to targets in the Somalogic platform, and 140 remained for analysis after filtering out low-quality targets on both platforms. Mean protein levels as measured on both platforms were strongly associated (P = 3.35 × 10⁻¹³; supplemental Figure 1), suggesting cross-validity of results across the assays.
Gene set enrichment analysis
To identify enriched pathways, gene set enrichment analysis (GSEA), using the Hallmark database, was performed between healthy donors and a proteomically identified subset of iMCD patients who responded to siltuximab, as well as between healthy donors and all iMCD siltuximab nonresponders.19 For each analyte, the UniProt accession number was converted to a corresponding Entrez Gene ID. Duplicate Entrez Gene IDs were removed such that the final list contained a unique gene set. Of the 1178 proteins that passed quality control, N = 1139 mapped to a unique gene. The threshold for significance for the false discovery rate was 0.20.
Immunohistochemistry
To investigate phosphorylated-STAT3 (pSTAT3) expression in iMCD compared with healthy controls, we collected formalin-fixed paraffin-embedded (FFPE) lymph node tissue from 10 iMCD patients (supplemental Table 2) and 15 breast cancer patients with nonmetastatic sentinel lymph nodes (normal control). HL patients (N = 13) were selected as positive controls for assay validation.20 Immunohistochemistry (IHC) staining was performed on a Leica Bond Max automated staining system (Leica Biosystems) using the Bond intense R staining kit (Leica Biosystems DS9263). Following a standard protocol, pSTAT3(Tyr 705) antibody (Cell Signaling, 9145) was used to stain FFPE tissue slides.
Lymph node sections were annotated using Aperio ImageScope; analysis was performed using the Image Analysis Toolkit Software color deconvolution v9 algorithm. Percentages for weak, medium, and strong staining and no staining were collected, and data were transformed by the logarithm of the ratio of the individual values and the geometric mean of the values (centered log-ratio). Wilcoxon rank-sum tests were performed to compare staining intensity between iMCD and control and between HL and control. When appropriate, P values were Bonferroni corrected.
To identify differential expression of IL-6 and pSTAT3 in siltuximab responders and nonresponders, we examined IHC data from 51 and 48 iMCD patients in the phase 2 siltuximab study, respectively. FFPE tissue samples were obtained from patients in the phase 2 study before initiation of treatment and were processed according to a standard protocol (supplemental Methods).
Statistical analysis
Data analysis was performed using the Medidata Rave Omics machine learning platform and R v3.4.4. Principal component analysis reconstruction residual, average pairwise distance (APW), and the APW to the K-nearest neighbors were used for outlier detection. Data points identified by >1 method were removed from analysis.
The t-distributed stochastic neighbor embedding (t-SNE) algorithm as implemented in the Rtsne package was used to visualize a two-dimensional representation of the proteomic data. Elastic net classifiers were fit using the glmnet R package. The specific analytes selected for the models were determined by performing fivefold cross-validation and selecting the smallest number of proteins from those that mapped between platforms such that the overall cross-validation error was within 1 standard error of the minimum. An elastic net classifier was used to predict cluster 1 membership in the discovery cohort using only those Somalogic SomaSCAN analytes that could be mapped to equivalent proteins in the RBM platform. The fit coefficients (apolipoprotein E [Apo E]: −0.191788; serum amyloid P-component [SAP]: 0.277767; inactivated complement C3b [iC3b]: 0.116684; amphiregulin [AREG]: −0.138515; immunoglobulin E [IgE]: 0.047766; [IL-6]: 0.017952; erythropoietin [Epo]: 0.032938) were used to calculate cluster 1 score in both the discovery and validation cohorts. As the discovery studies led us to hypothesize that there would be a positive association, a 1-sided test was used to test positive association between cluster 1 score and response, disease activity, and IL-6 levels in the validation cohort. All other P values are 2-sided with α = 0.05.
Results
iMCD is a heterogeneous disorder compared with related inflammatory and neoplastic disorders
To characterize the serum proteome of iMCD in the context of 3 clinico-pathologically overlapping diseases HL, RA, and HHV8-associated MCD, we applied an unbiased elastic net and hierarchical clustering algorithm (Figure 2A-B). We hypothesized that the iMCD samples (N = 88) would cluster together or close to a single related disease, which could indicate overlapping etiologic or pathophysiologic mechanisms and possibly treatment approaches. Each of the comparator diseases formed a clear group, whereas most iMCD samples occupied the space between the comparator diseases. We identified 5 distinct clusters composed of 134 samples (Figure 2B-C); 14 samples were unclustered. Interestingly, iMCD samples were present in all 5 clusters and in the unclustered group (supplemental Table 4). More than half of the iMCD samples (49 of 88) were included in clusters B, C, and E, which together only contained 3 comparator disease samples. Cluster D contained nearly all of the HL (19 of 20) samples and the greatest proportion (22 of 88, 25%) of iMCD samples in a single cluster. Cluster A contained nearly all RA (19 of 20) and HHV8-associated MCD (17 of 20) samples, as well as 5 of 88 iMCD samples. Although this analysis failed to identify a single disease that substantially clustered with iMCD, which could imply potential overlapping mechanisms, these results indicate that iMCD is highly heterogeneous with proteomic profiles similar to autoimmune, infectious and neoplastic diseases in some cases but not others.
![Clustering analysis of serum proteomes of iMCD and related diseases reveals notable heterogeneity. (A) A t-SNE plot visualizing serum proteomes of iMCD, Hodgkin lymphoma (lymphoma), HHV8-associated MCD (HHV8+MCD), and rheumatoid arthritis (RA) patients during active disease. Among the iMCD patients, siltuximab responders (partial response or complete response, per durable clinical and tumor [radiologic lymph node] response criteria as determined in NCT01024036) are indicated with open triangles, nonresponders with closed triangles, and patients for which siltuximab was not given as a monotherapy or response was not assessed by independent clinical trial review are represented by closed circles. Colored lines are drawn around clusters as determined by elastic net with fivefold cross-validation. (B) A revisualization of the t-SNE plot of iMCD and related disease serum proteomes to better indicate iMCD in relation to all other samples. Colored lines are drawn around clusters A to E as determined by elastic net with fivefold cross-validation, and samples within each cluster are colored accordingly. iMCD patients are indicated by a closed upward-facing triangle, and non-iMCD patients are visualized by an open downward-facing triangle. (C) Top 40 serum analytes that best distinguish between clusters A to E, as selected by elastic net with fivefold cross-validation, across iMCD and related disease samples.](https://ash.silverchair-cdn.com/ash/content_public/journal/bloodadvances/5/17/10.1182_bloodadvances.2020004016/3/m_advancesadv2020004016f2.png?Expires=1767714472&Signature=DzDIR2fLb8GVaWCDIRtFMDYfIgRSPCO3sJTZGZjaVgn2dekgeFxQ2YJPh6voALGtnH05Jw6g5ftRYGDcK5c7OK0CDo6-rk2z1ojWiktnF7axTgdBEXDNSSdQVIuQWB9AWDu6V7ZH9MfycYCVteb-FdFsc7TGINyqmJzjgPrrDaCmZumgGyb1oUgUr8M08fU5Fsgv2BwgHNNFNSIuTPcZNQQDR6w4LjONM09vdmYvNgZ~ABMqEHegWGc16e3UWwMMbxDt7kx88wS7z4jZoRVbLvIeWgw9Ui4RCA9b5YzeGrIWVpz8DWIAjaQF88n7ddGUg-IMEx2~GSVAGCAkhIMupw__&Key-Pair-Id=APKAIE5G5CRDK6RD3PGA)
Clustering analysis of serum proteomes of iMCD and related diseases reveals notable heterogeneity. (A) A t-SNE plot visualizing serum proteomes of iMCD, Hodgkin lymphoma (lymphoma), HHV8-associated MCD (HHV8+MCD), and rheumatoid arthritis (RA) patients during active disease. Among the iMCD patients, siltuximab responders (partial response or complete response, per durable clinical and tumor [radiologic lymph node] response criteria as determined in NCT01024036) are indicated with open triangles, nonresponders with closed triangles, and patients for which siltuximab was not given as a monotherapy or response was not assessed by independent clinical trial review are represented by closed circles. Colored lines are drawn around clusters as determined by elastic net with fivefold cross-validation. (B) A revisualization of the t-SNE plot of iMCD and related disease serum proteomes to better indicate iMCD in relation to all other samples. Colored lines are drawn around clusters A to E as determined by elastic net with fivefold cross-validation, and samples within each cluster are colored accordingly. iMCD patients are indicated by a closed upward-facing triangle, and non-iMCD patients are visualized by an open downward-facing triangle. (C) Top 40 serum analytes that best distinguish between clusters A to E, as selected by elastic net with fivefold cross-validation, across iMCD and related disease samples.
Clustering analysis of serum proteomes of iMCD and related diseases reveals notable heterogeneity. (A) A t-SNE plot visualizing serum proteomes of iMCD, Hodgkin lymphoma (lymphoma), HHV8-associated MCD (HHV8+MCD), and rheumatoid arthritis (RA) patients during active disease. Among the iMCD patients, siltuximab responders (partial response or complete response, per durable clinical and tumor [radiologic lymph node] response criteria as determined in NCT01024036) are indicated with open triangles, nonresponders with closed triangles, and patients for which siltuximab was not given as a monotherapy or response was not assessed by independent clinical trial review are represented by closed circles. Colored lines are drawn around clusters as determined by elastic net with fivefold cross-validation. (B) A revisualization of the t-SNE plot of iMCD and related disease serum proteomes to better indicate iMCD in relation to all other samples. Colored lines are drawn around clusters A to E as determined by elastic net with fivefold cross-validation, and samples within each cluster are colored accordingly. iMCD patients are indicated by a closed upward-facing triangle, and non-iMCD patients are visualized by an open downward-facing triangle. (C) Top 40 serum analytes that best distinguish between clusters A to E, as selected by elastic net with fivefold cross-validation, across iMCD and related disease samples.
Heterogeneity of iMCD confounds response prediction
Next, we sought to interrogate the iMCD proteome to discover biomarkers of response to siltuximab and to validate them using an orthogonal platform in an independent cohort of 23 iMCD patients enrolled in the phase 1 siltuximab trial.21
To derive a responder classifier to differentiate siltuximab responders from nonresponders, we used an elastic net algorithm and performed fivefold cross-validation 1000 times to determine the fewest proteins present on both platforms that could most effectively predict response in the discovery dataset. As the model chosen 863 of 1000 randomizations had 0 proteins, these data do not support a model that predicts siltuximab responders when the full iMCD cohort is included (supplemental Figure 2). This result suggests that the proteomic heterogeneity across iMCD patients is greater than any signal for biomarkers of response and that clustering of iMCD patients into more homogeneous subgroups may be required before biomarker discovery.
Identification of a novel iMCD subgroup with a superior response to siltuximab
Given the observed heterogeneity, we next applied the clustering algorithm among only iMCD samples to discover homogenous and clinically meaningful subgroups. The algorithm identified 6 proteomically defined clusters that ranged in size from 7 to 27 samples (Figure 3A). The proteins that most contributed to defining these clusters are shown in Figure 3B. No significant associations with race, sex, age, concurrent or prior corticosteroid use, prior use of antineoplastic or immunosuppressive drugs, or processing batch were observed (supplemental Table 5). Compared with all others, patients represented in cluster 1 demonstrated significantly higher disease activity (P = 7.062 × 10⁻⁹), significantly higher baseline IL-6 levels as measured by SomaSCAN assay (P = 5.709 × 10⁻⁹), and significantly higher response to siltuximab (65% [11 of 17] vs 19% [6 of 32]; P = 8.94 × 10⁻⁴; Figure 3C; supplemental Figure 3A-B). Interestingly, the cluster 1 iMCD patients represented all of the iMCD patient samples that clustered with HL patients in cluster D (Figures 2A and 3A; supplemental Table 4). These results demonstrate that there may be a proteomically distinct iMCD subgroup that has a superior response to anti–IL-6 therapy.
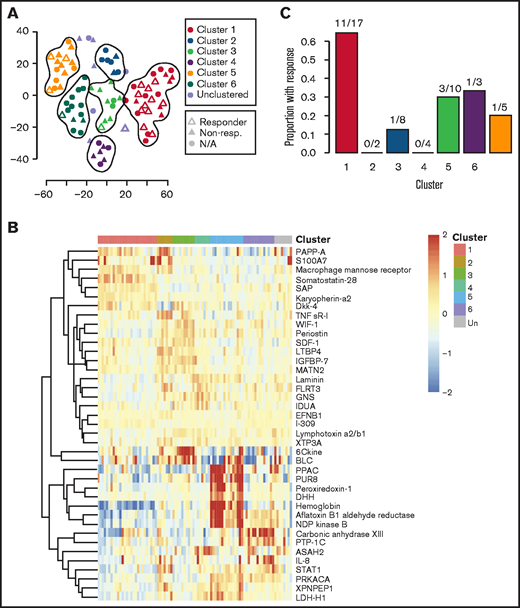
Clustering analysis of iMCD serum proteomes demonstrates 6 distinct clusters with differential response to siltuximab. (A) Subtyping of iMCD patients into 6 clusters by elastic net clustering of iMCD samples using serum analyte levels, as measured by SOMAscan. Siltuximab responders (partial response or complete response, per durable clinical and tumor (radiologic lymph node) response criteria as determined in NCT01024036) are indicated with open triangles, nonresponders with closed triangles, and patients for which siltuximab was not given as a monotherapy or response was not assessed by independent clinical trial review are represented by closed circles. Lines are drawn around clusters as determined by elastic net with fivefold cross-validation. (B) Top 40 serum analytes that best distinguish between clusters 1 to 6, as selected by elastic net with fivefold cross-validation, across iMCD samples. (C) Proportion of patients within each cluster that demonstrated a partial or complete response to anti–IL-6 therapy when administered during active disease (as determined in NCT01024036). Cluster 1 patients demonstrated significantly higher response to siltuximab than the other patients (P = 8.94 × 10⁻⁴).
Clustering analysis of iMCD serum proteomes demonstrates 6 distinct clusters with differential response to siltuximab. (A) Subtyping of iMCD patients into 6 clusters by elastic net clustering of iMCD samples using serum analyte levels, as measured by SOMAscan. Siltuximab responders (partial response or complete response, per durable clinical and tumor (radiologic lymph node) response criteria as determined in NCT01024036) are indicated with open triangles, nonresponders with closed triangles, and patients for which siltuximab was not given as a monotherapy or response was not assessed by independent clinical trial review are represented by closed circles. Lines are drawn around clusters as determined by elastic net with fivefold cross-validation. (B) Top 40 serum analytes that best distinguish between clusters 1 to 6, as selected by elastic net with fivefold cross-validation, across iMCD samples. (C) Proportion of patients within each cluster that demonstrated a partial or complete response to anti–IL-6 therapy when administered during active disease (as determined in NCT01024036). Cluster 1 patients demonstrated significantly higher response to siltuximab than the other patients (P = 8.94 × 10⁻⁴).
Validation of a novel subgroup of iMCD with a superior response to siltuximab
We next sought to validate the identification of this subgroup with a superior siltuximab response. To determine whether cluster 1 inclusion was predictive of siltuximab response in our validation cohort, we derived a “cluster 1 score” using an elastic net algorithm to determine the fewest proteins measured in both the discovery and validation platforms that most effectively predicted cluster 1 membership in the discovery dataset (supplemental Figure 4). The derived model includes ApoE, AREG, SAP, iC3b, IgE, IL-6, and Epo. Among samples in the discovery dataset, cluster 1 score was significantly associated with siltuximab response (P = 2.05 × 10⁻⁵), disease activity (P = 7.08 × 10⁻¹²), and IL-6 level (P = 3.37 × 10⁻⁶; Figure 4A-B). We hypothesized that cluster 1 score would likewise be positively associated with response, disease activity, and IL-6 levels when applied to the validation cohort. There was a trend toward a positive association between cluster 1 score and siltuximab response (P = .0757), and cluster 1 score was significantly associated with increased disease activity (P = .0388) and IL-6 levels (P = .0460; Figure 4C-D). To determine if any one of these proteins reliably associated with these parameters, we performed a univariate analysis on each of the proteins included in the model with these parameters. None of the individual proteins were significantly associated with response in both the discovery and validation cohorts. In the discovery cohort, 4 of 7 proteins demonstrated a significant association with response (ApoE, SAP, IL-6, Epo), 6 of 7 with disease activity (ApoE, SAP, iC3b, IgE, IL-6, and Epo), and all 7 with IL-6 level. In the validation cohort. IgE demonstrated a significant association with response (P = .002), and IL-6 demonstrated a significant association with disease activity (P = .0011; supplemental Figure 5A-B). These results suggest that there is not a single protein that heavily influences the 7-analyte panel or outperforms it. Despite notable differences in the proteomic technique and response criteria used in the discovery and validation cohorts10,21, these results validate the discovery of an iMCD subtype with superior response to siltuximab.
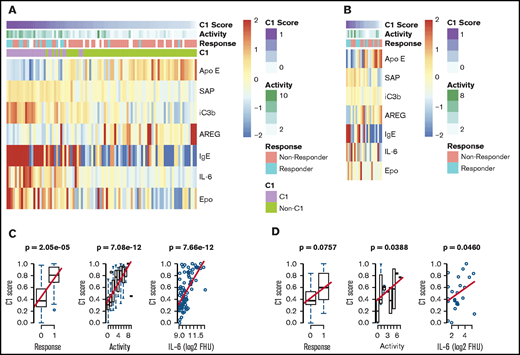
Validation of a novel proteomically definable iMCD subgroup that has superior response to siltuximab, increased disease activity, and elevated IL-6 levels. (A) A heat map of the 7 serum analytes that best distinguish cluster 1 vs other clusters, as selected by elastic net with fivefold cross-validation in the discovery dataset. (B) Correlation analysis between cluster 1 score and response, disease activity, and IL-6 levels in the discovery cohort (2-sided P values). (C) A heat map of the 7 serum analytes tested in an independent validation dataset. (D) Correlation analysis between cluster 1 score and response, disease activity, and IL-6 levels in the validation cohort (1-sided P values). Box plots show center median, first and third quartile, and whiskers extend to 1.5 × interquartile range. Cluster 1 scores are scaled from 0 to 1 for each cohort.
Validation of a novel proteomically definable iMCD subgroup that has superior response to siltuximab, increased disease activity, and elevated IL-6 levels. (A) A heat map of the 7 serum analytes that best distinguish cluster 1 vs other clusters, as selected by elastic net with fivefold cross-validation in the discovery dataset. (B) Correlation analysis between cluster 1 score and response, disease activity, and IL-6 levels in the discovery cohort (2-sided P values). (C) A heat map of the 7 serum analytes tested in an independent validation dataset. (D) Correlation analysis between cluster 1 score and response, disease activity, and IL-6 levels in the validation cohort (1-sided P values). Box plots show center median, first and third quartile, and whiskers extend to 1.5 × interquartile range. Cluster 1 scores are scaled from 0 to 1 for each cohort.
Identification of JAK-STAT3 as a candidate driver pathway in siltuximab nonresponders
Next, we sought to identify candidate driver pathways and potential therapeutic targets for siltuximab nonresponders. As a proof of principle, we performed GSEA on the proteomic data from cluster 1 siltuximab responders compared with healthy controls. To eliminate heterogeneity between clusters, we restricted this analysis to cluster 1. We hypothesized that IL-6-JAK-STAT3 signaling would be significantly enriched as IL-6 signaling is an essential disease driver in patients who improve with siltuximab. As expected, IL-6-JAK-STAT3 signaling was significantly enriched (q = 0.184) below our threshold along with 4 other pathways (Table 1). Given that we had demonstrated this approach could identify a disease driver in siltuximab responders, we repeated GSEA for nonresponders. As seen in cluster 1 responders, IL-6-JAK-STAT3 signaling (q = 0.144), tumor necrosis factor α (TNFα) signaling via nuclear factor κB (NF-κB; q = 0.173), and allograft rejection signature (q = 0.177) were significantly enriched in nonresponders. In addition, IL-2-STAT5 signaling (q = 0.177) and KRAS signaling up (q = 0.118) were identified as significantly enriched (Table 1). Several of the pathways identified in patients either with or without a response to siltuximab can be targeted with existing FDA-approved compounds. (supplemental Table 5).22-32 The results of the GSEA analysis provide a rationale for investigation of these approaches in iMCD.
Hallmark pathways significantly enriched in the discovery dataset among cluster 1 anti–IL-6 responders and in all siltuximab nonresponders
| Pathway | Nominal P value | FDR q value |
|---|---|---|
| Enriched pathways in cluster 1 siltuximab responders vs HDs | ||
| TNFα signaling via NF-κB | .004 | 0.090 |
| Estrogen response early | .013 | 0.137 |
| IFN-γ response | .033 | 0.149 |
| Allograft rejection signature | .033 | 0.167 |
| IL-6-JAK STAT3 signaling | .020 | 0.184 |
| Enriched pathways in siltuximab nonresponders vs HDs | ||
| KRAS signaling up | .029 | 0.118 |
| IL-6-JAK STAT3 signaling | .031 | 0.144 |
| TNFα signaling via NF-κB | .006 | 0.173 |
| Allograft rejection signature | .043 | 0.177 |
| IL2 STAT5 signaling | .018 | 0.179 |
Given that IL-6 inhibition is not effective in siltuximab nonresponders, IL-6-JAK-STAT3 signaling was not expected to be enriched in the serum proteome of siltuximab nonresponders. To confirm pathway activation in the primary site of iMCD pathology, we performed IHC for pSTAT3, an indicator of JAK-STAT3 activation. We analyzed expression of pSTAT3 in 10 iMCD lymph nodes, 15 normal lymph nodes, and lymph nodes from 13 patients with HL as a positive control. As expected, pSTAT3 was significantly elevated in the interfollicular space of HL compared with normal controls (P = .00022; supplemental Figure 6A-C). We observed significantly increased pSTAT3 expression in the interfollicular space of iMCD tissue compared with normal (P = .0037) and no significantly increased expression in the germinal centers (P = .2610; Figure 5A). Weak and medium pSTAT3 intensity was significantly increased in the interfollicular space in iMCD compared with normal (weak, P = .014; medium, P = .0066; strong, P = .57; Figure 5B-D). Consistent with the enrichment analysis, these data suggest that pSTAT3 expression is increased in iMCD lymph node tissue and that JAK-STAT3 signaling is activated in iMCD tissue.
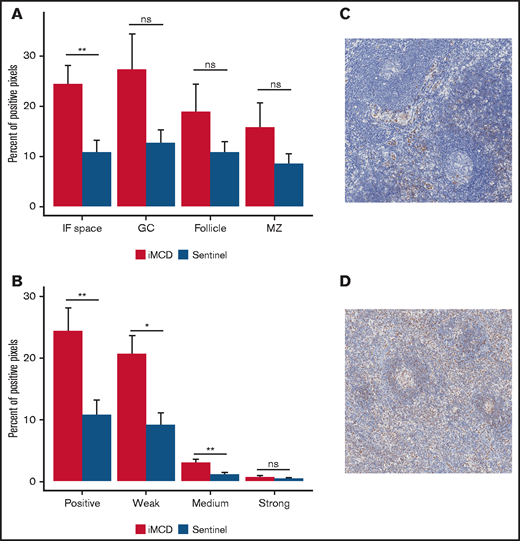
Consistent with enrichment analyses, immunohistochemistry reveals increased pSTAT3 expression in the interfollicular space of iMCD lymph node tissue. (A) iMCD demonstrated significantly more positive staining for pSTAT3 in the interfollicular space compared with normal lymph nodes (P = .0037). No significant differences were observed in germinal centers (P = .2610), secondary follicles (P = .4119), and mantle zones (P = .552). (B) Within the interfollicular space, iMCD lymph nodes demonstrated significantly higher weak (P = .014) and medium (P = .0066) with no difference in strong staining intensity. Representative images of a normal lymph node (C) and an iMCD lymph node (D) (40× magnification) are provided.
Consistent with enrichment analyses, immunohistochemistry reveals increased pSTAT3 expression in the interfollicular space of iMCD lymph node tissue. (A) iMCD demonstrated significantly more positive staining for pSTAT3 in the interfollicular space compared with normal lymph nodes (P = .0037). No significant differences were observed in germinal centers (P = .2610), secondary follicles (P = .4119), and mantle zones (P = .552). (B) Within the interfollicular space, iMCD lymph nodes demonstrated significantly higher weak (P = .014) and medium (P = .0066) with no difference in strong staining intensity. Representative images of a normal lymph node (C) and an iMCD lymph node (D) (40× magnification) are provided.
To investigate potential differences in the IL-6-JAK-STAT3 pathway between siltuximab responders and nonresponders, we evaluated IL-6 and pSTAT3 IHC expression data from 51 and 48 patients, respectively, in the siltuximab treatment arm of the phase 2 study. Given the previous results, we hypothesized that pSTAT3 expression would be present at similar levels in nonresponders and responders, suggesting that JAK-STAT3 pathway activation may be an iMCD driver in both groups. Analysis of IL-6 and pSTAT3 did not reveal significant differences in expression between siltuximab responders and nonresponders in any of the regions of the lymph node tissue that were quantified (supplemental Figure 7A-F). The lack of a difference in IL-6 or pSTAT3 expression between siltuximab responders and nonresponders suggests that increased JAK-STAT3 pathway activation may occur in siltuximab nonresponders secondary to another ligand independent of or in addition to IL-6 and may drive disease activity.
Discussion
Serum proteomic quantification was performed on iMCD patient samples to define disease classification, discover predictive biomarkers of response, and identify treatment targets for siltuximab nonresponders. We identified and validated a novel subgroup of iMCD patients with superior response to siltuximab and uncovered candidate therapeutic targets for siltuximab nonresponders, addressing 2 major unmet medical needs.
As the etiology and disease classification have not been defined for iMCD, we performed unbiased clustering of iMCD and related diseases to infer etiology and disease classification. The broad distribution of iMCD proteomic profiles compared with RA, HL, and HHV8-associated MCD proteomes suggests that iMCD is heterogeneous, spanning the spectrum from autoimmunity to neoplasia. This also supports a leading hypothesis that multiple etiologies are able to elicit iMCD.4
Next, we sought to uncover predictive biomarkers of response to siltuximab. Analyses across the full iMCD cohort failed to produce a model capable of distinguishing responders from nonresponders, potentially due to heterogeneity across iMCD. In fact, interrogation of the iMCD serum samples uncovered 6 proteomically defined clusters, each presumably comprising more homogeneous patients. Included among the proteins that most contributed to distinguishing the 6 iMCD clusters are chemokines that have previously been found elevated in iMCD (B-lymphocyte chemoattractant and C-C motif chemokine 21),33 as well as other chemokines such as stromal cell–derived factor 1, C-C motif chemokine 1, and IL-8 (or CXCL8). Among others, hemoglobin also contributed to defining clusters, with the superiorly responding cluster 1 demonstrating consistently low hemoglobin. Hemoglobin was previously identified in a model of clinical parameters to predict response to siltuximab but that model has not been validated.34
The identification and validation of our cluster 1 subgroup with a superior response to siltuximab represents the first validated predictive algorithm for response to siltuximab in iMCD. The 7 proteins included in our validated algorithm could form the basis for development of a clinical predictive signature. The association of the 7 specific proteins with the cluster 1 subgroup suggests important roles for plasma cells, antibodies, and dysregulated inflammation in patients who respond to siltuximab. IgE is a class of antibodies involved in allergic reactions and parasitic infections, IL-6 is a potent B-cell differentiation and plasma cell growth factor, and iC3b is a complement component that can be induced through antibody complexes. Elevated SAP and Epo likely reflect reactive changes to increased systemic inflammation and inflammation-induced anemia, respectively.35-37 Both ApoE and AREG levels were negatively associated with the cluster 1 patients. Interestingly, both are negative regulators of the immune system and inflammation.38,39 Further investigation of the roles of these proteins is needed.
We further analyzed the proteomic data to identify candidate novel pathways and therapeutic targets. The enrichment analysis of proteomes from cluster 1 responders identified IL-6-JAK-STAT3 signaling as a key pathway, demonstrating the potential for the platform and enrichment database to identify driver pathways. Surprisingly, IL-6-JAK-STAT3 signaling was also found to be significantly enriched among siltuximab nonresponders in the enrichment analysis, despite the fact that IL-6 inhibition is not effective in these patients. Interestingly, 25% of iMCD patients, including nearly all cluster 1 patients, clustered with HL. An association between increased IL-6 and IL-6 receptor expression with worsened survival, JAK-mediated signaling, sensitivity to the JAK inhibitor ruxolitinib, and increased pSTAT3 expression have each been demonstrated in HL.20,40,41 We also found that peripheral blood mononuclear cells from iMCD patients in remission demonstrate hypersensitivity to IL-6 stimulation in vitro, which can be abrogated with JAK1/2 inhibition.42 Together, these data suggest dysregulation of the IL-6-JAK-STAT3 signaling pathway may be important in iMCD.
Tissue-based IHC supported these results and revealed significantly increased pSTAT3 expression in the interfollicular space of iMCD lymph nodes compared with normal with no differences in IL-6 or pSTAT3 expression between responders and nonresponders. The enrichment of IL-6-JAK-STAT3 signaling in iMCD serum proteomes, ability of JAK1/2 inhibition to abrogate hypersensitivity to cytokine stimulation, increased pSTAT3 expression in iMCD, and lack of a difference in IL-6 and pSTAT3 expression between responders and nonresponders suggest that the JAK-STAT3 pathway may be involved in the pathogenesis of iMCD, including siltuximab nonresponders, either under the control of an activating ligand other than IL-6 or because of an aberration downstream of IL-6. Additional work is needed to identify the mechanisms inducing increased pSTAT3 activation in these patients.
Based on the results of this study, targeting another aspect of the IL-6-JAK-STAT3 pathway with an agent such as ruxolitinib, a JAK1/2 inhibitor FDA-approved for myelofibrosis,43 may be potentially useful for siltuximab nonresponders. JAK1/2 is a central node critical to STAT3 phosphorylation that is downstream of many potential driver cytokines. Ruxolitinib has demonstrated activity in other hyperinflammatory, cytokine-driven diseases, such as acute graft-vs-host disease44 and hemophagocytic lymphohistiocytosis,45 by suppressing proinflammatory cytokines and reducing T-cell proliferation through interrupting STAT signaling.
Our enrichment analysis identified other candidate pathways that could contribute to the disease process in both siltuximab responders and nonresponders. Many of these pathways can also be targeted with FDA-approved agents, such as TNFα, interferon γ, IL-2, and components of the allograft rejection signature. Only 4 of these agents have been reported in the iMCD literature.22-24,32 Drugs targeting IL-2-STAT5 signaling, enriched only among the siltuximab nonresponders, and allograft rejection, enriched in both groups of iMCD patients, include cyclosporine, sirolimus, and tacrolimus, each of which has been reported to have potential activity in iMCD.23,24,32 TNFα signaling via NF-κB, also enriched in both the siltuximab responders and nonresponders, is another compelling target. TNFα is capable of inducing IL-6, VEGF, and JAK-STAT3 activation46-48 and could drive pSTAT3 through stimulating production of ligands other than IL-6.49 In autoimmune diseases like RA, anti-TNFα decreases cytokine production, increases hemoglobin, and decreases inflammation.50-52 Considering these functions and proteomic overlap between some iMCD patients and RA, anti-TNFα drugs should be further investigated. Interestingly, the phosphatidylinositol 3-kinase/ protein kinase B/ mammalian target of the rapamycin (PI3K/Akt/mTOR) pathway was not identified in this study. IL-6 signaling can activate both the JAK-STAT3 and PI3K/Akt/mTOR pathways.53 In prior studies, the mTORC1 signaling pathway was found to be significantly enriched in iMCD, and inhibition of mTOR has shown promise in the treatment of siltuximab nonresponders.24,42 It is possible that there is an aberration downstream or independent of IL-6 that affects the PI3K/Akt/mTOR pathway and can be abrogated with mTOR inhibition and/or JAK1/2 inhibition.
In rare disease research, challenges arise from sample scarcity, time required to obtain samples from disparately located patients, differences between collection sites, and limited representation of disease spectrum. These barriers are particularly constraining to use nascent ‘omic’ techniques, which provide unique opportunities to drive precision medicine discoveries but are costly and require a sufficiently powered and clinically annotated sample set. We obtained high-quality, clinically annotated samples from multiple institutions to accumulate the largest sample set studied in iMCD to date. Importantly, unbiased clustering analyses did not segregate samples based on sites contributing samples to this study. To ensure optimal representation of the iMCD severity spectrum, we included patients from 2 clinical trials,10,21 along with additional samples from more severe patients who would have been excluded from both trials. The validation of the cluster 1 subgroup is notable considering several limitations. Two different proteomic platforms and quantification techniques were used between the discovery and validation cohorts. Furthermore, the validation cohort was comprised of patients from the phase 1 dose-finding study of siltuximab,21 which included varying doses and different inclusion and exclusion criteria from the phase 2 study and did not assess durable symptomatic response. Despite the sample size and other limitations, the association between the cluster 1 signature and siltuximab response in discovery (P = 2.05 × 10⁻⁵) and validation (P = .0757) cohorts suggest that this is a robust finding.
In future studies, the predictive signature derived herein should be assessed in association with outcomes of siltuximab treatment other than lymph node response and could also be studied in patients treated with tocilizumab, an anti–IL-6 receptor blocker. Collection of evidence through observational studies, such as the ACCELERATE Natural History Registry (NCT02817997), pragmatic trials, and clinical trials should further explore the clinical utility of the 7 analyte predictor of response. Data on off-label drug use, including candidates identified through this study, will be needed to identify promising drugs for rigorous clinical trials. Further exploration of proteomic and gene expression changes longitudinally after siltuximab administration and in different tissue types involved in iMCD may help elucidate the serum changes in this study. These data from the largest proteomic profiling study performed in iMCD to date reveal a clinically meaningful subgroup, insights into disease pathogenesis, and candidate novel therapeutic targets.
Acknowledgments
The authors thank the members of the Center for Cytokine Storm Treatment and Laboratory (CSTL) whose work facilitated this research, including Rozena Rasheed, Johnson Khor, and Amber Cohen; volunteers of the Castleman Disease Collaborative Network (CDCN) who helped to facilitate this research, including Raj Jayanthan, Mary Zuccato, Helen Partridge, Amy Liu, Mileva Repasky, Patty Prazenica, Stefanie Soegaard, Grant Mitchell, Aaron Stonestrom, Mike Croglio, Sean Craig, Kevin Silk, and Wes Kaupinen; Medidata Solutions and its leadership including Glen de Vries and Tarek Sherif for contributing data analytics and expertise; Elana Amsterdam and Marjorie Raines for their support of this work; Dustin Shilling for his contributions to the development and implementation of this study; Arthur Rubenstein, Daniel Rader, Vera Krymskya, Sofija Miljovska, Jeff Wiser, Jef Banbanaste, Jeff Faris, and Tom Uldrick for consultations on this study; Daniel Martinez and the other members of the CHOP Pathology Core and Qualtek for immunohistochemical analyses; Kevin Silk, Giovanni Insana, and James A. Lebovitz for contributions to the development of this study; and Reena Koodathil and Lyndsay Harris for facilitating many discussions relating to this research.
This study was funded by Janssen Pharmaceuticals, the National Heart Lung & Blood Institute (grant R01HL141408) and a research grant from the University of Pennsylvania Ophan Disease Center in partnership with the Castleman Disease Collaborative Network.
Authorship
Contribution: S.K.P. and S.S. conducted analyses, performed data interpretation, and contributed to writing the manuscript; A.B.O. and J.M. contributed to study design, data interpretation, and contributed to writing the manuscript; R.-A.L. and T.K. contributed to data collection and conducting analyses and performed data interpretation; C.S.N. and J.R.R. contributed to study design and data interpretation; S.A.T.P., D.J.A., and D.L. performed data interpretation; M.G., M.R., and C.T. contributed to study design, sample collection, and data interpretation; M.W., N.S., M.B., A.D.P., and Y.M. contributed to sample collection and data interpretation; L.K. conducted analyses and contributed to data interpretation; P.B. contributed to study design and data interpretation; A.F. contributed to sample collection, data interpretation, and writing the manuscript; F.v.R. contributed to study design, sample collection, data interpretation, and writing the manuscript; and D.C.F. contributed to study design, data interpretation, and writing the manuscript.
Conflict-of-interest disclosure: D.C.F. has received research funding from Janssen Pharmaceuticals and EUSA Pharma for the ACCELERATE Natural History Registry (financial sponsorship of the ACCELERATE study has now been transferred to EUSA Pharma), received study drug from Pfizer for a clinical trial of sirolimus in iMCD, and holds two provisional pending patents related to the diagnosis and treatment of iMCD. S.S. and J.M. provide consultancy for Medidata Solutions. A.B.O., L.K., P.B., and D.L. are employed by and/or receive equity ownership from Medidata Solutions. M.G., M.R., and C.T. are employed by and receive equity ownership by Janssen Pharmaceuticals. M.W. provides consultancy and/or receives research funding from Amgen, Bristol Myers Squibb, Crescendo Bioscience, Sanofi/Regeneron, and UCB Pharmaceuticals. M.B. receives honoraria from Merck, Gilead, ViiV, and Janssen Pharmaceuticals. Y.M. receives research funding from Kyowa Hakko Kirin, Astellas, Ono, Eisai, and Pfizer. A.F. receives honoraria from Janssen Pharmaceuticals. F.v.R. provides consultancy for EUSA Pharma, Takeda, Sanofi Genzyme, Adicet Bio, Kite Pharma, and Karyopharm Therapeutics. The remaining authors declare no competing financial interests.
Correspondence: David Fajgenbaum, University of Pennsylvania, 112A Stemmler Hall, 3450 Hamilton Walk, Philadelphia, PA 19104; e-mail: davidfa@pennmedicine.upenn.edu.

