

Key Points
m-EASIX calculated before and early after CAR T-cell infusion can predict severe CRS and ICANS before the onset of severe symptoms.
m-EASIX includes laboratory parameters routinely available in CAR T-cell clinical practice and can be easily calculated at bedside.

Abstract
Patients who develop chimeric antigen receptor (CAR) T-cell–related severe cytokine release syndrome (CRS) and immune effector cell–associated neurotoxicity syndrome (ICANS) exhibit hemodynamic instability and endothelial activation. The EASIX (Endothelial Activation and Stress Index) score (lactate dehydrogenase [LDH; U/L] × creatinine [mg/dL]/platelets [PLTs; 109 cells/L]) is a marker of endothelial damage that correlates with outcomes in allogeneic hematopoietic cell transplantation. Elevated LDH and low PLTs have been associated with severe CRS and ICANS, as has C-reactive protein (CRP), while increased creatinine is seen only in a minority of advanced severe CRS cases. We hypothesized that EASIX and 2 new modified EASIX formulas (simplified EASIX, which excludes creatinine, and modified EASIX [m-EASIX], which replaces creatinine with CRP [mg/dL]), calculated peri-CAR T-cell infusion, would be associated with development of severe (grade ≥ 3) CRS and ICANS. We included 118 adults, 53 with B-acute lymphoblastic leukemia treated with 1928z CAR T cells (NCT01044069) and 65 with diffuse large B-cell lymphoma treated with axicabtagene ciloleucel or tisagenlecleucel. The 3 formulas showed similar predictive power for severe CRS and ICANS. However, low PLTs and high CRP values were the only variables individually correlated with these toxicities. Moreover, only m-EASIX was a significant predictor of disease response. m-EASIX could discriminate patients who subsequently developed severe CRS preceding the onset of severe symptoms (area under the curve [AUC] at lymphodepletion, 80.4%; at day −1, 73.0%; and at day +1, 75.4%). At day +3, it also had high discriminatory ability for severe ICANS (AUC, 73%). We propose m-EASIX as a clinical tool to potentially guide individualized management of patients at higher risk for severe CAR T-cell–related toxicities.
Introduction
The Endothelial Activation and Stress Index (EASIX) score (lactic dehydrogenase [LDH; U/L] × creatinine [mg/dL]/platelets [PLTs; 109 cells/L]) has emerged as a marker of endothelial damage and predictor of survival in patients with acute graft-versus-host-disease after allogeneic hematopoietic cell transplant (allo-HCT).1 EASIX assessed pre-HCT has also been shown to predict significant fluid overload after transplant and increased risk of acute graft-versus-host-disease and to be associated with non-relapse mortality and overall survival after allo-HCT.2-5
Patients who develop chimeric antigen receptor (CAR) T-cell–related severe cytokine release syndrome (CRS) and immune effector cell–associated neurotoxicity syndrome (ICANS) exhibit hemodynamic instability and coagulopathy, with evidence of endothelial activation and increased blood-brain barrier permeability.6 Several inflammatory cytokines and markers of coagulopathy have been shown to correlate with the onset of severe CRS and/or ICANS, such as interferon-γ, interleukin-6 (IL-6), IL-1, IL-10, monocyte chemoattractant protein-1 (MCP-1), and angiotensin-2 (Ang-2).6-9 Among routinely available laboratory tests, LDH, C-reactive protein (CRP), fibrinogen, PLTs, and ferritin have been associated with severe CRS and severe neurotoxicity.6,7,10-13
We hypothesized that the EASIX score, as a marker for endothelial damage, would be able to predict the onset of severe CRS and/or ICANS in patients receiving CAR T cells. Creatinine, one of the components of EASIX, however, plays a limited role as a biomarker of CAR T-cell–related toxicities, with elevation in a minority of patients who have already developed severe symptoms of CRS.14 Therefore, we further hypothesized that 2 modified EASIX formulas, the simplified EASIX (s-EASIX), which excludes creatinine, and the modified EASIX (m-EASIX), which replaces creatinine with CRP (mg/dL), would better estimate the risk of developing severe CRS and ICANS after CAR T-cell infusion. Therefore, we calculated EASIX/s-EASIX/m-EASIX scores at different time points before and early after infusion in recipients of CAR T cells in order to investigate their association with CRS and ICANS.
Methods
Study population and data collection
This retrospective analysis included adult patients with B-cell acute lymphoblastic leukemia (B-ALL) enrolled at our center in a phase 1 trial of 1928z CAR T cells from 2010 through 2016 (#NCT01044069),12 and consecutive patients with non-Hodgkin large B-cell lymphoma (LBCL) treated at our center with commercially available axicabtagene ciloleucel (Yescarta, Kite/Gilead) or tisagenlecleucel (Kymriah, Novartis), starting after US Food and Drug Administration approval from February 2018 through August 2019, as recently described by Wudhikarn et al.15 All patients received CAR T cells after lymphodepleting chemotherapy, according to the Food and Drug Administration’s recommendations for LBCL, and protocol directed for B-ALL, as previously described.12 Demographic, clinical, and laboratory data were retrospectively extracted from electronic medical records. CRS and ICANS were graded according to the American Society for Transplantation and Cellular Therapy (ASTCT) grading system16 and were considered severe if grade ≥ 3. CRS and ICANS data were collected prospectively for patients with LBCL. Since the B-ALL cohort was treated before the introduction of the ASTCT grading, a chart review was conducted to retrospectively grade CRS and ICANS, as previously described.17 For patients with lymphoma, disease burden was evaluated based on the last imaging before CAR T-cell infusion. This was preformed after treatment in 43 of 44 patients who received bridging therapy. One patient with progressive stage 4 disease received a brief course of steroids and was considered as having high disease burden in the absence of reimaging. To calculate EASIX/s-EASIX/m-EASIX formulas, we collected all available LDH, CRP, creatinine and PLTs values starting from day −14 to day +14 after CAR T-cell infusion for each patient. Written informed consent for treatment was obtained from all patients. Approval for this retrospective review was obtained from Memorial Sloan-Kettering Cancer Center’s Institutional Review and Privacy Board. The study was conducted in accordance with the Declaration of Helsinki.
Aims of the study
The study's primary objective was to investigate if the EASIX/s-EASIX/m-EASIX formulas would predict severe CRS or ICANS. The secondary objectives included (1) exploration of the correlation of EASIX/s-EASIX/m-EASIX scores with the rates of complete response (CR) and best overall response rate (ORR) to CAR T-cell therapy, (2) selection of the formula with the best predictive power for the primary outcome, and (3) assessment of the selected formula to predict severe CRS and ICANS in disease subgroups (B-ALL and LBCL).
Statistical analysis
As published in the original report, a log transformation using base 2 (log2) was applied to all the EASIX/s-EASIX/m-EASIX scores to reduce skewness. A 1-unit increase in log2 EASIX was associated with a doubling (onefold increase) of EASIX on the original scale. EASIX/s-EASIX/m-EASIX scores were calculated at specific time points considered clinically relevant for estimating and managing the risk of toxicities: preinfusion, at start of lymphodepletion, and day −1 (or day 0, if not available); and postinfusion, days +1 and +3, and onset of CRS symptoms. Best overall response was assessed between day +30 and day +90 after infusion. For patients with LBCL, response was assessed by positron emission tomography/computed tomography or biopsy, based on clinical indication, and reported according to the Lugano criteria.18 Patients with B-ALL who achieved morphologic CR with persistence of minimal residual disease (MRD), as assessed by multiparameter flow cytometry, were included in the CR group. The threshold for MRD negativity was defined as <0.01% of bone marrow (BM) blasts.12
Univariate logistic regression was performed to investigate the association between predictors of interest and the outcomes of severe CRS and ICANS. Multivariate logistic regression was performed based on univariate significance and clinical judgment: disease subtype (B-ALL vs LBCL), age as a continuous variable, and burden of disease (high vs low). Logistic regression was also used for the endpoint of CR to evaluate which EASIX formula was associated with response. Receiver operating characteristic (ROC) curves were built and areas under the curve (AUCs) were evaluated to select the formula with the highest discriminatory ability. Comparison of AUCs at specific time points was performed with ROC tests. All analyses and graphics were produced using R version 3.6.2.
Results
Patient characteristics and CRS-ICANS rates
A total of 118 patients were included (53 with B-ALL, who received 1928z CAR T cells [NCT01044069],12 and 65 with LBCL); 44 patients (68%) were treated with axicabtagene ciloleucel and 21 patients (32%) were treated with tisagenlecleucel based on physician’s preference. Demographic and clinical characteristics of the patients at time of CAR T-cell infusion are outlined in Table 1. Median age was 58 (range, 20-86), 44 (range, 22-74), and 64 (range, 20-86) years in all patients, patients with B-ALL, and patients with LBCL, respectively. The preinfusion ECOG score was 0 to 1 in 93% of patients in the overall cohort and in 100% and 86% of patients with B-ALL and lymphoma, respectively. More than half of the population (66%) had a high disease burden before CAR T-cell infusion, defined as BM blasts percentage >5% for B-ALL (62% of cases) and stage 3 to 4 and/or bulky disease for patients with LBCL (69% of cases).
Patient characteristics
| Patients | Overall (118) | B-ALL (53) | LBCL (65) |
|---|---|---|---|
| Age (y), median (range) | 58 (20-86) | 44 (22-74) | 64 (20-86) |
| Sex (male), n (%) | 84 (71) | 39 (74) | 45 (69) |
| ECOG preinfusion, n (%) | |||
| 0-1 | 109 (93) | 53 (100) | 56 (86) |
| 2-4 | 7 (6) | 0 | 7 (11) |
| Not available | 2 (1) | 0 | 2 (3) |
| Disease burden preinfusion, n (%) | |||
| High | 78 (66) | 33 (62)* | 45 (69)† |
| Low | 37 (31) | 20 (38)‡ | 17 (26)§ |
| N/A¶ | 3 (3) | 0 | 3 (5) |
| IPI preinfusion, n (%) | |||
| Low/intermediate low (0-2) | — | — | 39 (60) |
| High/intermediate high (3-5) | — | — | 22 (35) |
| Not available | — | — | 3 (5) |
| Fever before/during lymphodepletion, n (%) | 23 (19) | 10 (19) | 13 (20) |
| Lymphodepleting chemotherapy, n (%) | |||
| Fludarabine/cyclophosphamide | 72 (61) | 10 (19) | 62 (95) |
| High-dose cyclophosphamide | 43 (36) | 43 (81) | — |
| Bendamustine | 3 (3) | — | 3 (5) |
| CAR T-cell product, n (%) | |||
| CD1928z | 53 (45) | 53 (100) | 0 (0) |
| Axicabtagene ciloleucel | 44 (37) | 0 (0) | 44 (68) |
| Tisagenlecleucel | 21 (18) | 0 (0) | 21 (32) |
CR, complete response; ECOG, Eastern Cooperative Oncology Group; IPI, International Prognostic Index; N/A, not applicable.
BM blasts > 5%.
Stage 3 to 4 and/or bulky >6 cm.
BM blasts < 5%.
Stage 1 or 2.
Patients in CR at infusion
Supplemental Table 1 summarizes the rates of CRS and ICANS by ASTCT grading, stratified by disease subtype and CAR T-cell product received. Eighty-three percent of patients had CRS of any grade. Grade ≥ 3 CRS occurred in 19% of patients. Forty-seven percent of the overall population developed ICANS of any grade, with 36% of patients developing grade ≥ 3 ICANS. Median onset of CRS and ICANS symptoms was 2 days (interquartile range [IQR], 1-4; range, 0-12) and 6 days (IQR, 4-8; range, 1-21), respectively. Median onset of severe CRS symptoms was 4 days (IQR, 2-7; range, 0-12). Data to calculate time of median onset of severe symptoms of ICANS was available only in a minority of patients and was thus not reported.
EASIX/s-EASIX/m-EASIX are associated with onset and severity of CRS and ICANS
EASIX, s-EASIX, and m-EASIX were calculated for each patient at (1) preinfusion time points (start of lymphodepletion and day −1), (2) early post-infusion time points (day +1 and +3), and (3) day of onset of CRS. As primary outcome, we investigated the association between the different EASIX scores calculated at various time points and the onset of CRS and ICANS and severe CRS and ICANS. Median scores at different time points stratified by occurrence or nonoccurrence of CRS are shown in supplemental Table 2.
We found that all 3 formulas, when calculated preinfusion (start of lymphodepletion and day −1), were associated with the occurrence of any grade of CRS (supplemental Table 3) and, more importantly, with severe CRS (Figure 1; eg, at day −1, per log2 increase: EASIX: OR, 1.51; 95% CI, 1.12-2.09; P = .008; s-EASIX: OR, 1.6; 95% CI, 1.19-2.23; P = .003; m-EASIX: OR, 1.26; 95% CI, 1.07-1.50; P = .009). Conversely, EASIX/s-EASIX/m-EASIX scores at preinfusion time points were not associated with the onset of ICANS (supplemental Table 3). When we looked at early time points postinfusion (day +1 and +3), a significant association was found between all 3 EASIX scores and CRS of any grade and ICANS of any grade (supplemental Table 3). Moreover, all 3 formulas were associated with the onset of both severe CRS (eg, at day +1, per log2 increase: EASIX: OR, 1.56; 95% CI, 1.15-2.18; P = .006; s-EASIX: OR, 1.65; 95% CI, 1.22-2.34; P = .002; m-EASIX: OR, 1.31; 95% CI, 1.10-1.60; P = .004) and severe ICANS (eg, at day +3, per log2 increase: EASIX: OR, 1.5; 95% CI, 1.17-1.96; P = .002; s-EASIX: OR, 1.55; 95% CI, 1.20-2.04; P = .001; m-EASIX: OR, 1.36; 95% CI, 1.15-1.65; P < .001) (Figure 1).
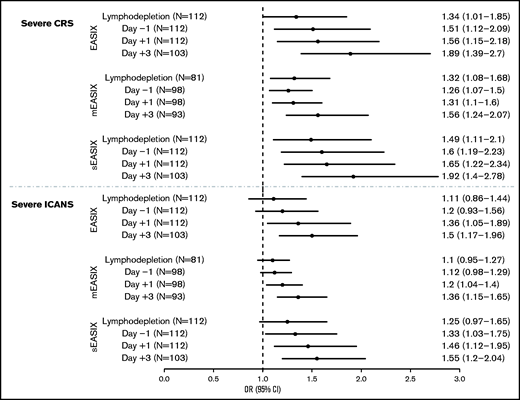
Association of EASIX/s-EASIX/m-EASIX with severe CRS and severe ICANS. This figure shows a Forest plot for odds ratios (ORs) and 95% confidence intervals (CIs) for prediction of severe CRS (top) and ICANS (bottom) by EASIX/s-EASIX/m-EASIX calculated at preinfusion (lymphodepletion and day −1) and postinfusion (days +1 and +3) time points.
Association of EASIX/s-EASIX/m-EASIX with severe CRS and severe ICANS. This figure shows a Forest plot for odds ratios (ORs) and 95% confidence intervals (CIs) for prediction of severe CRS (top) and ICANS (bottom) by EASIX/s-EASIX/m-EASIX calculated at preinfusion (lymphodepletion and day −1) and postinfusion (days +1 and +3) time points.
Lower PLT counts and higher CRP are associated with onset of severe CRS and ICANS
To investigate the contribution of the individual variables included in the formulas, we explored the association of creatinine, LDH, PLTs, and CRP with the onset of severe CRS and ICANS (Table 2). Increased CRP levels at all time points were associated with the onset of severe CRS (eg, per log increase, at start of lymphodepletion: OR, 1.87; 95% CI, 1.21-3.18; P = .01) and severe ICANS (eg, per log increase, at day +3: OR, 2.19; 95% CI, 1.44-3.63; P < 0.001). Higher PLT counts were associated with reduced toxicity; at all time points, higher PLTs values were associated with a lower odds of severe CRS (eg, per 10-U increase, at start of lymphodepletion OR, 0.87; 95% CI, 0.80-0.94, P < .001), and of severe ICANS (eg, per 10-U increase, at day +3: OR, 0.85; 95% CI, 0.78-0.92: P < .001). In contrast, no association was found between LDH or creatinine levels and severe CRS and ICANS.
Association of individual variables included in EASIX scores and severe CRS/ICANS
| Variable | Median (range) | N | OR | 95% CI | P value |
|---|---|---|---|---|---|
| Severe CRS | |||||
| At start of lymphodepletion | |||||
| LDH* (U/L) | 227 (110, 8255) | 112 | 1.17 | 0.55, 2.24 | .7 |
| Creatinine (mg/dL) | 0.80 (0.30, 2.00) | 118 | 0.05 | 0.00, 0.49 | .018 |
| PLTs° (k/μL) | 14 (1, 49) | 118 | 0.87 | 0.80, 0.94 | <.001 |
| CRP* (mg/L) | 1.3 (0.0, 28.5) | 84 | 1.87 | 1.21, 3.18 | .01 |
| At day − 1 | |||||
| LDH* (U/L) | 232 (106, 4110) | 112 | 1.66 | 0.81, 3.30 | .15 |
| Creatinine (mg/dL) | 0.70 (0.30, 1.60) | 118 | 0.22 | 0.02, 1.68 | .2 |
| PLTs° (k/μL) | 12 (1, 44) | 118 | 0.87 | 0.80, 0.94 | .001 |
| CRP* (mg/L) | 2.0 (0.0, 28.1) | 103 | 1.64 | 1.13, 2.51 | .014 |
| At day + 1 | |||||
| LDH* (U/L) | 207 (95, 2645) | 112 | 1.63 | 0.75, 3.42 | .2 |
| Creatinine (mg/dL) | 0.70 (0.30, 1.60) | 118 | 0.29 | 0.03, 2.35 | .3 |
| PLTs° (k/μL) | 11 (1, 38) | 118 | 0.84 | 0.76, 0.92 | <.001 |
| CRP* (mg/L) | 2.2 (0.1, 27.0) | 104 | 1.83 | 1.20, 2.98 | .009 |
| Severe ICANS | |||||
| At day + 1 | |||||
| LDH* (U/L) | 207 (95, 2645) | 112 | 1.39 | 0.71, 2.70 | .3 |
| Creatinine (mg/dL) | 0.70 (0.30, 1.60) | 118 | 0.3 | 0.04, 1.70 | .2 |
| PLTs° (k/μL) | 11 (1, 38) | 118 | 0.91 | 0.85, 0.97 | .004 |
| CRP* (mg/L) | 2.2 (0.1, 27.0) | 104 | 1.54 | 1.11, 2.21 | .013 |
| At day +3 | |||||
| LDH* (U/L) | 202 (96, 1810) | 103 | 1.17 | 0.54, 2.46 | .7 |
| Creatinine (mg/dL) | 0.70 (0.30, 1.80) | 118 | 0.91 | 0.21, 3.52 | .9 |
| PLTs† (/μL) | 8 (1, 34) | 118 | 0.85 | 0.78, 0.92 | <.001 |
| CRP* (mg/L) | 7 (0, 33) | 105 | 2.19 | 1.44, 3.63 | <.001 |
Log transformation of raw LDH and CRP values was applied to calculate the OR s.
PLT values were scaled by 10 units to calculate the ORs. Bold indicates statistically significant values.
ROC curve analysis and selection of the m-EASIX formula as the best predictor of CAR T-cell outcomes
To evaluate the model’s performance, a ROC curve analysis was conducted with an estimation of the AUCs for EASIX/s-EASIX/m-EASIX scores calculated at all the time points that showed a significant association with severe CRS or ICANS in the logistic regression analysis (Figure 2). The EASIX/s-EASIX/m-EASIX scores were confirmed to be good predictors for severe CRS at start of lymphodepletion (AUCs 77.3%/82.1%/80.4%), at day −1 (AUCs 71.8%/74.5%/73%), day +1 (AUCs 72.4%/76.4%/75.4%), and day +3 (AUCs 79.7%/80.9%/80.2%) (Figure 2A-D). m-EASIX values at day +3 showed the highest discriminatory ability for severe ICANS (AUCs 68%/68.4%/73% for EASIX/s-EASIX/m-EASIX, respectively) (Figure 2F). No clear superiority of one formula over the others emerged when comparing AUCs at all time points (Figure 2A-F).
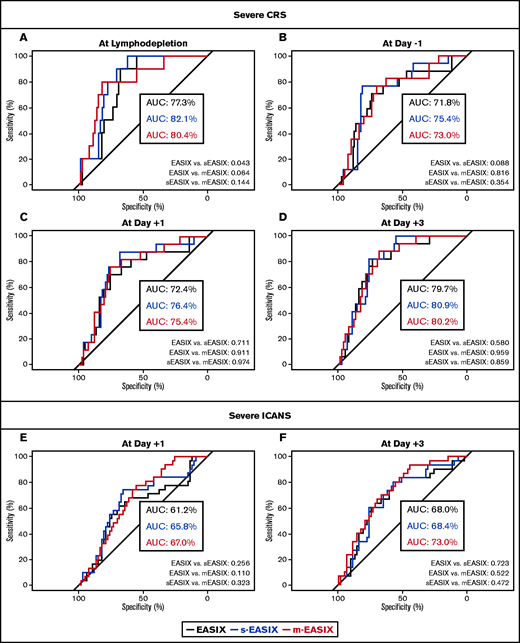
Prediction of severe CRS and ICANS by EASIX/s-EASIX/m-EASIX. ROC curves are shown at all pre- and postinfusion time points for severe CRS (A-D) and ICANS (E-F). AUCs are calculated for all curves and compared in pairs with ROC tests at all time points.
Prediction of severe CRS and ICANS by EASIX/s-EASIX/m-EASIX. ROC curves are shown at all pre- and postinfusion time points for severe CRS (A-D) and ICANS (E-F). AUCs are calculated for all curves and compared in pairs with ROC tests at all time points.
Since the ROC curve analysis did not identify a superior formula, and considering that PLTs and CRP levels were shown to have the most relevant individual role in the prediction of both severe CRS and severe ICANS in the single variable analysis and that m-EASIX on day +3 had the strongest association with severe ICANS compared with the other formulas, we selected the m-EASIX score (which includes CRP) as the most comprehensive formula for the early prediction of severe CRS and ICANS in patients treated with CAR T cells.
m-EASIX as an early biomarker of severe CRS and ICANS
For the remainder of the analysis, we focused on the m-EASIX formula. Figure 3 displays the distribution of m-EASIX values at different time points across all patients, showing a progressive increase in median values for patients presenting with no symptoms or mild (CRS or ICANS grade 1-2) or severe (CRS or ICANS grade 3-5) symptoms of CRS and ICANS.
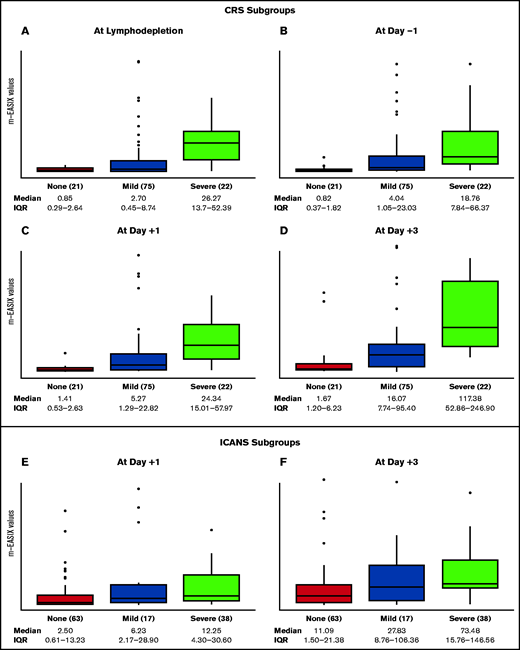
Distribution of m-EASIX levels across CRS and ICANS subgroups. The boxplots summarize median and IQR of m-EASIX levels at day of lymphodepletion (A), day −1 (B), day +1 (C), and day +3 (D) for patients presenting with no symptoms (red) or mild (blue) or severe (green) CRS and at day +1 (E) and day + 3 (F) for patients with no symptoms (red) or mild (blue) or severe (green) ICANS. CRS and ICANS were defined mild if grade 1 or 2 and severe if grade 3 to 5.
Distribution of m-EASIX levels across CRS and ICANS subgroups. The boxplots summarize median and IQR of m-EASIX levels at day of lymphodepletion (A), day −1 (B), day +1 (C), and day +3 (D) for patients presenting with no symptoms (red) or mild (blue) or severe (green) CRS and at day +1 (E) and day + 3 (F) for patients with no symptoms (red) or mild (blue) or severe (green) ICANS. CRS and ICANS were defined mild if grade 1 or 2 and severe if grade 3 to 5.
To better characterize the selected formula, we explored the association between m-EASIX and baseline patient characteristics. At all time points, lower m-EASIX levels were correlated with low disease burden (eg, at start of lymphodepletion: β-coefficient, −3.4; 95% CI, −4.9, −1.9: P < .001), while occurrence of fever during the 14 days preceding CAR T-cell infusion was associated with higher m-EASIX levels (eg, at day −1: β-coefficient, 3.5; 95% CI; 2.1, 5.0; P < .001). No consistent association was found with age, diagnosis of B-ALL vs LBCL, and ECOG 0-1 vs ≥ 2 (supplemental Table 4). In a multivariate analysis for prediction of severe CRS, after adjusting for other preinfusion risk factors for severe CRS (disease type, disease burden, and age) m-EASIX calculated at preinfusion time points remained a significant predictor of severe CRS (at day of lymphodepletion: OR, 1.38; 95% CI, 1.11-1.85; P = .01; at day −1: OR, 1.21; 95% CI, 1.00-1.48; P = .05). m-EASIX achieved the highest AUC for the association with severe CRS at the start of lymphodepletion. At that time point, an m-EASIX cutpoint of 6.2, where specificity was 76% and sensitivity 80%, showed a negative predictive value of 96.43% for prediction of CRS grade 3 or above.
We further compared m-EASIX with clinical variables, including CRP and fever. m-EASIX on day −1 preinfusion was superior to CRP alone in predicting severe CRS (ROC comparison for m-EASIX vs CRP 0.025). No difference with CRP, however, was seen at the start of lymphodepletion (ROC comparison, 0.059). When comparing with fever, m-EASIX on days +1 and +3 postinfusion was not superior to fever in predicting severe CRS or ICANS (ROC comparison for severe CRS: m-EASIX vs fever days +1 and +3, 0.284 and 0.367, respectively; ROC comparison for severe ICANS: m-EASIX vs fever days +1 and +3, 0.237 and 0.492, respectively). However, in 42 patients who developed fever on day +1, only 12 developed severe CRS and 23 severe ICANS. Therefore, day +1 fever did not necessarily translate into severe symptoms.
Subanalysis for m-EASIX and severe CRS and ICANS by disease type (B-ALL and LBCL)
Lastly, we explored the impact of m-EASIX scores on severe CRS and ICANS risk by disease type (supplemental Table 5). Among the 53 patients with B-ALL, 15 (28%) had severe CRS and 24 (45%) had severe ICANS. m-EASIX remained a significant predictor of severe CRS at all time points (eg, per log2 increase, at start of lymphodepletion: OR, 5.33; 95% CI, 1.77-62.1; P = .043; at day −1: OR, 1.45; 95% CI, 1.08-2.12; P = .027) and of severe ICANS at day +3 (per log2 increase, at day +3: OR, 1.5; 95% CI, 1.10-2.21; P = .02). In the 65 patients with LBCL, severe events were less frequent (7 cases of severe CRS and 14 of severe ICANS). Only m-EASIX calculated at day +3 retained statistical significance for predicting severe CRS and severe ICANS (per log2 increase, OR, 1.34; 95% CI, 1.03-1.86; P = .045 and OR, 1.25; 95% CI, 1.03-1.58; P = .038).
m-EASIX, but not EASIX or s-EASIX, is associated with CAR T-cell efficacy
All patients were evaluable for disease response assessment, except for 1 patient who died with grade 5 CRS on day +5. Out of 117 patients, 89 patients (76%) responded to treatment between days 30 and 90, with 79 (67%) achieving a CR as the best response. Among patients with B-ALL, 44 (83%) achieved a CR, which was MRD negative in 35 patients (66%). Thirty-five patients (54%) with non-Hodgkin lymphoma achieved a CR by day 90 after infusion.
When we explored the association of the 3 scores with achieving a CR as best overall response, we found that higher m-EASIX levels were associated with a reduced odds of response to CAR T cells (per log2 increase, at day −1: OR, 0.81; 95% CI, 0.69-0.93; P = .004; at day +1: OR, 0.82; 95% CI, 0.70-0.94; P = .007; at day +3: OR, 0.84; 95% CI, 0.72-0.98; P = .031; at the first day of CRS: OR, 0.67; 95% CI; 0.52-0.84; P = .001), suggesting that patients with higher m-EASIX scores were less likely to achieve a CR (Table 3). Based on the AUCs, m-EASIX scores in our population were shown to have a moderate discriminatory power for achieving a CR (AUCs of 62.2%, 68.1%, 66.8%, and 66.8% at the start of lymphodepletion, day −1, +1, and +3, respectively). No clear association with disease response was found for EASIX and s-EASIX scores.
Correlation of m-EASIX and achievement of CR
| Formula | N | OR | 95% CI | P value |
|---|---|---|---|---|
| At lymphodepletion | ||||
| EASIX | 111 | 0.87 | 0.67, 1.12 | .3 |
| s-EASIX | 111 | 0.87 | 0.67, 1.12 | .3 |
| m-EASIX | 81 | 0.9 | 0.78, 1.03 | .13 |
| At day −1 | ||||
| EASIX | 111 | 0.77 | 0.59, 1.00 | .053 |
| s-EASIX | 111 | 0.79 | 0.61, 1.02 | .078 |
| m-EASIX | 97 | 0.81 | 0.69, 0.93 | .004 |
| At day +1 | ||||
| EASIX | 111 | 0.79 | 0.61, 1.02 | .078 |
| s-EASIX | 111 | 0.81 | 0.62, 1.04 | .1 |
| m-EASIX | 97 | 0.82 | 0.70, 0.94 | .007 |
| At day +3 | ||||
| EASIX | 102 | 0.84 | 0.65, 1.07 | .2 |
| s-EASIX | 102 | 0.83 | 0.65, 1.06 | .14 |
| m-EASIX | 92 | 0.84 | 0.72, 0.98 | .031 |
| At day of CRS | ||||
| EASIX | 88 | 0.81 | 0.60, 1.08 | .2 |
| s-EASIX | 88 | 0.82 | 0.61, 1.09 | .2 |
| m-EASIX | 78 | 0.67 | 0.52, 0.84 | .001 |
Patients achieving CR = 79. CR, complete response for B-ALL, including patients with positive MRD as assessed by flow cytometry.
Discussion
In this study, we explored the role of the EASIX formula (LDH × creatinine/PLT), a biomarker for endothelial damage in allo-HCT recipients,1 in predicting severe CRS and ICANS in patients with LBCL and B-ALL treated with CAR T cells. In addition to EASIX, we tested 2 new revised formulas: s-EASIX, which excludes creatinine, and m-EASIX, which replaces creatinine with CRP (mg/dL). We found that all 3 formulas were associated with severe CRS prior to CAR T-cell infusion (at day of lymphodepletion and day −1) and early postinfusion (days +1 and +3), preceding the onset of severe symptoms. Early postinfusion, the 3 formulas also had a moderate discriminatory ability for severe ICANS. When we assessed the individual role of each variable included in the formulas, low PLTs and high CRP levels at all pre- and postinfusion time points emerged as the variables most correlated with the development of severe CRS and ICANS.
Thrombocytopenia is a result of endothelial damage and complement activation in many diseases. In patients treated with CAR T cells, low PLTs can be multifactorial, related to higher disease burden, heavy pretreatment including autologous or allogeneic transplant, and systemic inflammatory syndrome.15,19 In patients with both B-ALL and aggressive lymphomas treated with various CAR T-cell products, a lower PLT nadir has been shown to be independently correlated with higher grades of CRS.10 In other reports, PLT counts at time of CAR T-cell infusion were shown to be significantly lower in patients who then developed severe neurotoxicity compared with those who had mild symptoms.11-13 At CAR T-cell peak expansion, endothelial activation represented by high Ang-2 levels and Ang-2/Ang-1 ratio has been associated with severe CRS.10 Similarly, high Ang-2 levels and Ang-2/Ang-1 ratio have been reported 1 week after CAR T-cell infusion and also before the start of lymphodepletion in patients who subsequently developed high-grade neurotoxicity, suggesting that a proendothelial damage state can precede CAR T-cell infusion.6 As PLTs are one of the few sources of the endothelial stabilizing cytokine Ang-1, patients with severe thrombocytopenia before and early after CAR T-cell infusion might be more prone to CRS- and ICANS-related endothelial activation and damage.20
High CRP levels have previously been reported in patients with severe CRS and ICANS. Early elevation of CRP after CAR T-cell infusion was associated with grade 4 to 5 CRS in patients with B-ALL and other lymphoid neoplasms; however, its utility as an early biomarker of severe CRS has not been proven.7,10 While in one report, peak CRP levels were shown to be higher in patients who experienced high-grade neurotoxicity, in another, CRP levels peaked in all patients before the development of neurologic symptoms but failed to discriminate between patients with mild vs severe symptoms.6,13 In our population, CRP levels at all time points were significantly associated with the development of both severe CRS and severe ICANS.
Conversely, unlike Karschnia et al, who reported elevated (≥400 U/L) LDH levels at baseline in 69% of patients with severe neurotoxicity, we did not find a correlation between LDH levels and severe CRS or ICANS.13 Endothelial activation leads to release of LDH from endothelial cells as well as to a higher turnover of circulating cells, such as PLTs and leukocytes, resulting in elevated LDH serum levels.21 LDH is also a marker for neoplastic cells proliferation and high disease burden, which have been implicated in the development of severe CRS and ICANS.10,12 High LDH has also been correlated with decreased survival after CAR T-cell infusion.13,22,23 The absence of an association between LDH and CAR T-cell–related toxicities in our sample might be a result of the small sizes of the 2 populations involved.
Based on our findings, we chose the m-EASIX as the most clinically relevant formula for the prediction of severe toxicities. At present, several laboratory parameters, cytokines, and clinical characteristics have been associated with the development of CRS and ICANS. However, no specific biomarker has been identified for use in clinical practice as an effective predictor. The use of currently known biomarkers has been limited by the fact that the majority of studies involve non-routinely available cytokines. A clear strength of the m-EASIX is that it includes laboratory parameters that are ubiquitously available and often routinely assessed in clinical practice for patients treated with CAR T cells. Besides, the formula can be easily calculated at the bedside. Moreover, the m-EASIX proved to effectively correlate with severe CRS and ICANS at clinically actionable time points, before and early after CAR T-cell infusion. Increasing m-EASIX scores calculated preinfusion (at lymphodepletion and day −1) were predictive of CRS grade 3 or above, with an m-EASIX cutpoint of 6.2 at start of lymphodepletion showing a 96.43% negative predictive value for severe CRS. In the clinical setting, patients with m-EASIX values <6.2 at the start of lymphodepletion might be considered for outpatient treatment as their risk of developing severe symptoms is predicted to be low. Conversely, a higher preinfusion m-EASIX score might help in selecting patients requiring inpatient admission on the day of infusion for careful monitoring or patients who might be candidates for clinical trials of prophylactic or preemptive treatment of toxicities. In our population, CRS median onset was day +2, with severe symptoms occurring at a median of day +4, in line with previous reports.24,25 Early after infusion (days +1 and +3), higher m-EASIX values were associated with both severe CRS and severe ICANS, and this could be used for similar interventions. The fact that only postinfusion m-EASIX levels are associated with severe ICANS might be because most patients develop neurologic symptoms only after having experienced some degree of CRS. However, it is not clear if higher grades of CRS are more predictive of ICANS; thus, the m-EASIX might help to identify those patients at higher risk.
The selection of the m-EASIX as the best score was also guided by the fact that it was the only formula that included CRP and was also associated with CR. Recently, CRP levels on day 0 have been shown to correlate with response to axicabtagene ciloleucel.26 Interestingly, higher m-EASIX levels were associated with severe CRS and ICANS and conversely with lower chances of achieving a CR. This highlights the potential role of CRP as a marker of disease burden besides systemic inflammation. Higher disease burden and presence of fever before CAR T-cell infusion were in fact associated with higher m-EASIX levels at all time points. In general, disease burden is known to be a risk factor for CRS, and patients with higher disease burden are also at higher risk of not responding. Furthermore, patients who develop mild or no CRS have been shown to effectively respond to CAR T cells. Therefore, experiencing CRS might not necessarily be a requirement for a good response to CAR T cells. The association between m-EASIX and response suggests that the combination of disease/patient/pretreatment factors, such as LDH and PLTs, and markers of inflammation due to disease, such as CRP, provides a better prediction of ultimate disease response than the factors in isolation.
Our study has some limitations. The sample size is in line with recent single-center retrospective reports on patients treated with CAR T cells. However, it is limited by combining patients affected by 2 different diseases and treated with different products, which might represent confounding factors. As such, while the results from the whole population were confirmed in the B-ALL subgroup analysis, we were not able to prove the same for the LBCL patients, likely related to the paucity of CRS/ICANS events in this subgroup. Finally, further validation in external cohorts is warranted. To conclude, we propose that the m-EASIX score should be further investigated as an early biomarker of severe CRS and ICANS in larger datasets. The m-EASIX could provide a clinical tool for discriminating patients at higher risk for severe toxicities at clinically actionable time points (before or early after infusion) to guide differential individualized management.
Acknowledgments
This work was supported by National Institutes of Health, National Cancer Institute Cancer Center support grant P30CA008748. M.P. was supported by an American-Italian Cancer Foundation postdoctoral research fellowship and Associazione Italiana contro le leucemie-linfomi e mieloma Milano e Provincia ONLUS. M.S.-E. was supported by a Research Institute of Marques de Valdecilla Wenceslao-Lopez-Albo grant (WLA17/03). A.A.T. was supported by a grant of the Alfonso Martin Escudero Foundation. The content is solely the responsibility of the authors and does not necessarily represent the official views of the National Institutes of Health.
Authorship
Contribution: M.P., M.S.-E., L.Y.S.S., and M.-A.P. designed the study and wrote the manuscript; M.P. and M.S.-E. collected the data and conducted the analysis; M.L.S., A.A.T., T.J., J.R., and M.M. participated in data collection; J.R.F. and S.M.D. conducted the statistical analysis; R.S. participated into the data analysis; C.B., R.J.B., P.B.D., C.D., E.F.H., E.M., B.S., S.G., M.L.P., C.S.S., M.S., G.S., and J.H.P. took care of the patients; and all authors reviewed and approved the manuscript.
Conflict-of-interest disclosure: B.S. has consulted for Juno Therapeutics, Celgene/BMS, and Novartis and has served on advisory boards for Kite/Gilead and Janssen Pharmaceuticals. C.B. has consulted for and served on advisory boards for Juno Therapeutics; R.B. has consulted for Celgene and has consulted for, has patents and royalties with, and received research funding from Juno Therapeutics. P.B.D. has served on advisory boards for Kite/Gilead. S.G. has consulted for and received research funding from Amgen, Actinium, Celgene, Johnson & Johnson, and Takeda; has consulted for Jazz Pharmaceuticals, Novartis, Kite, and Spectrum Pharmaceuticals; and has received research funding from Miltenyi. T.J. has consulted for Targeted Oncology and served on advisory board for Bristol-Myers Squibb and CareDx. M.L.P. has consulted for Noble Insights and Merck & Co Inc; has served on advisory boards for STRAXIMM, Kite Pharmaceuticals, Pharmacyclics and Seres Therapeutics; has served on the Speakers Bureau for Hemedicus; has equity ownership for Seres Therapeutics and Evelo; and has patents and royalties with MSKCC (IP for Juno and Seres Therapeutics). C.S.S. has served as a paid consultant on advisory boards for Juno Therapeutics, Sanofi-Genzyme, Spectrum Pharmaceuticals, Novartis, Genmab, Precision Biosciences, Kite/Gilead, Celgene/BMS, Gamida Cell, Karyopharm Therapeutics, and GSK; he has received research funds for clinical trials from Juno Therapeutics, Celgene/BMS, Bristol-Myers Squibb, Precision Biosciences, and Sanofi-Genzyme. M.S. reports research support/funding from Angiocrine Bioscience; consultancy for Angiocrine Bioscience, Omeros Corporation, and McKinsey & Company; ad hoc advisory board membership with Kite/Gilead; and a one-time speaking commitment with i3Health (CME). GS has received research funding from Amgen and Janssen Pharmaceuticals. J.H.P. has consulted for Allogene, Amgen, AstraZeneca, Autolus, GSK, Incyte, Kite Pharma, Novartis, and Takeda. L.Y.S.S. has received honoraria and served on advisory boards for AbbVie, Astra Zeneca, Janssen, Roche, Gilead, Merck, and Pfizer. M.-A.P. served on advisory boards for MolMed, NexImmune, Medigene, and Servier; has received honoraria and served on advisory boards for AbbVie, Bellicum, Bristol-Meyers Squibb, Miltenyi Biotec, Nektar Therapeutics, Novartis, Omeros, and Takeda; has consulted and received honoraria from Merck; and has received research funding from Kite/Gilead, Incyte, and Miltenyi Biotec. The remaining authors declare no competing financial interests.
The current affiliation for T.J. is Division of Hematological Malignancies and Bone Marrow Transplantation, Department of Oncology, John Hopkins University, Baltimore, MD.
Correspondence: Miguel-Angel Perales, Adult Bone Marrow Transplantation Service, Department of Medicine, Memorial Sloan-Kettering Cancer Center, 1275 York Avenue, Box 298, New York, NY 10065; e-mail: peralesm@mskcc.org.

