

Key Points
In mice, immunosuppressive pmn MDSCs are required for tolerance.
Tolerance conditioning leads to depletion of recipient T cells and an increase in immunosuppressive pmn MDSCs in patient blood.

Abstract
Replacement of failed organs followed by safe withdrawal of immunosuppressive drugs has long been the goal of organ transplantation. We studied changes in the balance of T cells and myeloid cells in the blood of HLA-matched and -mismatched patients given living donor kidney transplants followed by total lymphoid irradiation, anti-thymocyte globulin conditioning, and donor hematopoietic cell transplant to induce mixed chimerism and immune tolerance. The clinical trials were based on a conditioning regimen used to establish mixed chimerism and tolerance in mice. In preclinical murine studies, there was a profound depletion of T cells and an increase in immunosuppressive polymorphonuclear (pmn) myeloid-derived suppressor cells (MDSCs) in the spleen and blood following transplant. Selective depletion of pmn MDSCs in mice abrogated mixed chimerism and tolerance. In our clinical trials, patients given an analogous tolerance conditioning regimen developed similar changes, including profound depletion of T cells and a marked increase in MDSCs in blood posttransplant. Posttransplant pmn MDSCs transiently increased expression of lectin-type oxidized LDL receptor-1, a marker of immunosuppression, and production of the T-cell inhibitor arginase-1. These posttransplant pmn MDSCs suppressed the activation, proliferation, and inflammatory cytokine secretion of autologous T-cell receptor microbead-stimulated pretransplant T cells when cocultured in vitro. In conclusion, we elucidated changes in receptors and function of immunosuppressive myeloid cells in patients enrolled in the tolerance protocol that were nearly identical to those of MDSCs required for tolerance in mice. These trials were registered at www.clinicaltrials.gov as #NCT00319657 and #NCT01165762.
Introduction
Immune tolerance to combined living donor kidney transplants (KTx’s) and hematopoietic cell transplants (HCTs), allowing for complete withdrawal of immunosuppressive drugs, has been achieved in HLA-matched and -mismatched patients.1-7 We established clinical trials using a tolerance approach developed in preclinical studies of rodents, dogs, and nonhuman primates in which total lymphoid irradiation (TLI) and anti-thymocyte serum (ATS) were used to condition recipients to establish mixed chimerism and tolerance.8-14 Our previous preclinical tolerance studies demonstrated that immune suppression was mediated by polymorphonuclear (pmn) myeloid-derived suppressor cells (MDSCs), tolerogenic CD8+ dendritic cells, invariant natural killer T cells, and regulatory T cells that were required for the induction and maintenance of mixed chimerism and tolerance.14-19
Here, we analyzed MDSCs and their tolerogenic functions in patients who were conditioned with TLI + anti-thymocyte globulin (ATG) and received combined KTx and HCT. As in our murine studies, there was a striking increase in the percentage and absolute number of CD15+ pmn MDSCs in our patients concurrent with profound T-cell depletion early posttransplant. Early posttransplant pmn MDSCs from our patients expressed the lectin-type oxidized LDL receptor-1 (LOX-1) that characterizes suppressive pmn MDSCs found in cancer patients.20 These MDSCs suppressed the activation, proliferation, and inflammatory cytokine secretion of autologous pretransplant T cells. Thus, TLI + ATG conditioning and HCT given to patients following KTx elicits immunosuppressive pmn MDSCs similar to those observed in cancer patients and required for tolerance in our preclinical mouse transplant studies.
Materials and methods
Conditioning of murine recipients, donor cell injections, organ transplantation, suppression, and chimerism assays
Male BALB/c and C57BL/6 mice were purchased from The Jackson Laboratory (Bar Harbor, ME) at 8 to 10 weeks of age. Neonatal C57BL/6 heart grafts were transplanted to the ear pinnae of adult transplant recipients as described previously.15 TLI was administered as 10 doses (240 cGy) using an x-ray machine (Polaris MC-500; Kimtron Inc., Woodbury, CT).9,15 Rabbit ATS (Accurate Chemical, Westbury, NY) was administered intraperitoneally in 0.5 mL of saline. Bone marrow organ transplantation, monitoring of graft survival, and testing of chimerism with anti–H-2Kb monoclonal antibody (mAb) were described previously.9,15 Phenotypic mAbs for analyses of cells were purchased from eBioscience (San Diego, CA).17,18 Depletion of Gr-1+ cells using anti–Gr-1 mAb, sorting of MDSCs, and the mixed leukocyte reaction (MLR) suppression assay were described in detail previously.17,18
Conditioning of human recipients, donor cell injections, and chimerism assays
Detailed characteristics of recipients of the living related donor KTx’s and HCTs were described previously.3,4,7 Ten HLA fully matched patients and 11 HLA haplotype-matched patients, enrolled between May of 2014 and November of 2018, were monitored in the current study, which was approved by the Institutional Review Board of the Stanford Medical Center.3,4,7 The study was conducted in accordance with the Declaration of Helsinki. Clinical trials included in this article were registered at www.clinicaltrials.gov (#NCT00319657: Kidney and Blood Stem Cell Transplantation That Eliminates Requirement For Immunosuppressive Drugs; #NCT01165762: Combined Blood Stem Cell and Kidney Transplant of One Haplotype Match Living Donor Pairs).7
Human blood processing
Peripheral blood mononuclear cells (PBMCs) were isolated as previously described.3,4 All assays were performed on fresh samples without cryopreservation, unless otherwise indicated.
Flow cytometry and fluorescence-activated cell sorting of PBMCs
Cells were stained and then fixed in paraformaldehyde (1% volume-to-volume ratio) prior to analysis on a BD LSR II flow cytometer (BD Biosciences). Cells used in functional studies were not fixed. The mAbs used for staining and sorting of T and myeloid subsets are shown in supplemental Table 1.3,4
Human suppression assay
PBMCs were labeled with carboxyfluorescein diacetate succinimidyl ester (CFSE), according to the manufacturer’s protocol (Thermo Fisher Scientific). T cells were enriched from CFSE-labeled cells using a CD2 Positive Selection Kit (STEMCELL Technologies), according to the manufacturer’s protocol, and then cultured at 100,000 cells per well. Lin−CD11bhiDRlo MDSCs were sorted on a FACSAria sorter (BD Biosciences) to >95% purity and added to cultures. Anti-CD3/anti-CD28 T cell microbeads (TCBs; ThermoFisher) were added at a ratio of 1 bead:128 T cells. MDSCs (5 × 10⁴ cells per well; 1 suppressor cell:2 T cells) were added to parallel wells containing T cells + TCBs and cocultured as per above. Cultured cells were collected on day 5 and stained with fluorescent-labeled mAbs to identify CD3, CD4, and CD8 T cells and their activation/differentiation marker expression.3,4
Luminex and enzyme-linked immunosorbent assay
Cytokines were measured from culture supernatants (taken at 36 hours) via a Luminex (Procarta 20Plex; ThermoFisher Scientific) assay, according to manufacturer’s protocol on a Bio-Plex 200 (Bio-Rad) instrument. Arginase-1 (ARG-1) was measured from culture supernatants via enzyme-linked immunosorbent assay (Lifespan Biosciences), according to the manufacturer’s protocol.
Statistics
Data from untreated and treated groups of mice were compared using the 2-tailed Student t test of independent means at a single time point. Groups of pretransplant and serial posttransplant patient blood samples (percentages, absolute cell numbers, suppressive function and cytokine/ARG-1 secretion) were compared using an unpaired nonparametric Mann-Whitney U test of independent means at a single time point. Human data were further tested by 1-way analysis of variance (ANOVA) multicomparison analysis because data from multiple time points, rather than a single time point, were compared. The Holm-Sidak correction was applied to all but the cytokine and ARG-1 data. The Kruskal-Wallis test with Dunn’s correction was applied to the cytokine and ARG-1 data. Statistical analysis was performed using GraphPad Prism 7 software.
Results
Immunosuppressive pmn MDSCs increase in TLI-conditioned mice and are required for transplant tolerance
The TLI + ATS conditioning regimen used to achieve mixed chimerism and tolerance in mice and humans is shown in Figure 1A. In the mouse studies, organ transplantation was performed on day 0, followed by 10 doses of TLI and 5 doses of rabbit ATS, administered in the first 2 weeks posttransplant. Donor HCT was performed immediately after the completion of TLI. Chimerism and graft survival were measured at serial time points thereafter. BALB/c (H-2d) recipients were given heart transplants and hematopoietic cells from C57BL/6 (H-2b) donors.9,15,17,18 Figure 1B shows that the percentage of total T cells in the spleen of wild-type mouse recipients was markedly reduced from 40% in untreated mice to 2% 5 days after treatment with TLI + ATS and HCT.

Depletion of T cells and increase in MDSCs in BALB/c recipients after transplantation of C57BL/6 heart and bone marrow using TLI + ATG conditioning to establish mixed chimerism. (A) Experimental scheme used for murine and human transplantation. Recipients were given an organ graft on day 0, followed by 5 doses of TLI and 5 doses of rabbit anti-thymocyte antibodies (ATG for humans and ATS for mice) in the first week after transplantation and 5 doses of TLI during the second week. The donor cell infusion was given immediately after the completion of TLI (day 15 in mice and day 11 in humans). (B) Representative 2-color flow cytometric analysis of CD11b vs TCRβ staining of spleen cells and PBMCs from wild-type BALB/c mice that were left untreated (WT UNT) or from wild-type BALB/c mice that were recipients of combined transplants (WT TX). Gated CD11b+ cells were analyzed further for expression of Gr-1 vs CD11b. Recipient cells were obtained 5 days after the infusion of the donor cells. The percentage of cells in each box is shown. (C) Mean absolute number of TCRβ+ T cells and CD11b+Gr-1hi myeloid cells in the spleen from untreated BALB/c mice vs the number in the spleen obtained from transplant recipients 5 days after the donor cell infusion. (D) Mean percentage suppression of responder TCRβ+ T-cell proliferation in the BALB/c vs C57BL/6 MLR was calculated by comparing the percentage of dull CFSE staining, with or without the addition of sorted CD11b+Gr-1hi spleen cells. The latter cells were obtained from untreated BABL/c mice or from BALB/c recipient mice 5 days after the donor cell infusion. (E) Mean percentage of donor cell chimerism among gated TCRβ+ T cells in PBMCs from BALB/c recipients without administration of anti–Gr-1 mAb or with administration of anti–Gr-1 mAb to deplete MDSCs. PBMCs were obtained from recipients 28 days after the donor cell infusion. (F) Mean duration of graft survival after allogeneic heart and bone marrow cell transplant in nondepleted or MDSC-depleted or in MDSC-depleted with add back. Cessation of heartbeats in grafts was used as an indicator of heart graft rejection. (G) Mean absolute number of CD11b+Gr-1hi myeloid cells in the spleen from untreated BALB/c mice vs the number in the spleen obtained from transplant recipients on days 28 and 85 after the donor cell infusion. (H) Mean median fluorescence intensity (MFI) and percentages of LOX-1+ cells among gated CD11b+Gr-1hi spleen cells from wild-type BALB/c mice that were left untreated (UNT) or from wild-type BALB/c mice conditioned with 10 doses of TLI (TLI), 5 days after the end of conditioning. Recipient data are a representation of up to 8 independent experiments with ≥6 to 10 mice per group. *P < .05, **P < .01, ***P < .001, Mann-Whitney U test (2-group comparisons) and 1-way ANOVA (for 3-group comparisons). HTx, heart transplant; NS, not significant.
Depletion of T cells and increase in MDSCs in BALB/c recipients after transplantation of C57BL/6 heart and bone marrow using TLI + ATG conditioning to establish mixed chimerism. (A) Experimental scheme used for murine and human transplantation. Recipients were given an organ graft on day 0, followed by 5 doses of TLI and 5 doses of rabbit anti-thymocyte antibodies (ATG for humans and ATS for mice) in the first week after transplantation and 5 doses of TLI during the second week. The donor cell infusion was given immediately after the completion of TLI (day 15 in mice and day 11 in humans). (B) Representative 2-color flow cytometric analysis of CD11b vs TCRβ staining of spleen cells and PBMCs from wild-type BALB/c mice that were left untreated (WT UNT) or from wild-type BALB/c mice that were recipients of combined transplants (WT TX). Gated CD11b+ cells were analyzed further for expression of Gr-1 vs CD11b. Recipient cells were obtained 5 days after the infusion of the donor cells. The percentage of cells in each box is shown. (C) Mean absolute number of TCRβ+ T cells and CD11b+Gr-1hi myeloid cells in the spleen from untreated BALB/c mice vs the number in the spleen obtained from transplant recipients 5 days after the donor cell infusion. (D) Mean percentage suppression of responder TCRβ+ T-cell proliferation in the BALB/c vs C57BL/6 MLR was calculated by comparing the percentage of dull CFSE staining, with or without the addition of sorted CD11b+Gr-1hi spleen cells. The latter cells were obtained from untreated BABL/c mice or from BALB/c recipient mice 5 days after the donor cell infusion. (E) Mean percentage of donor cell chimerism among gated TCRβ+ T cells in PBMCs from BALB/c recipients without administration of anti–Gr-1 mAb or with administration of anti–Gr-1 mAb to deplete MDSCs. PBMCs were obtained from recipients 28 days after the donor cell infusion. (F) Mean duration of graft survival after allogeneic heart and bone marrow cell transplant in nondepleted or MDSC-depleted or in MDSC-depleted with add back. Cessation of heartbeats in grafts was used as an indicator of heart graft rejection. (G) Mean absolute number of CD11b+Gr-1hi myeloid cells in the spleen from untreated BALB/c mice vs the number in the spleen obtained from transplant recipients on days 28 and 85 after the donor cell infusion. (H) Mean median fluorescence intensity (MFI) and percentages of LOX-1+ cells among gated CD11b+Gr-1hi spleen cells from wild-type BALB/c mice that were left untreated (UNT) or from wild-type BALB/c mice conditioned with 10 doses of TLI (TLI), 5 days after the end of conditioning. Recipient data are a representation of up to 8 independent experiments with ≥6 to 10 mice per group. *P < .05, **P < .01, ***P < .001, Mann-Whitney U test (2-group comparisons) and 1-way ANOVA (for 3-group comparisons). HTx, heart transplant; NS, not significant.
In contrast, CD11b+ myeloid cells increased from 4% to 8% in these animals. Further analysis of the gated CD11b+ myeloid cells in the spleen showed that ∼12% were Gr-1hiCD11b+ in untreated mice, whereas 65% were Gr-1hiCD11b+ after transplantation (Figure 1B).
The percentage of T cells in the blood of mice decreased from 70% in untreated mice to 1%, whereas the percentage of CD11b+ myeloid cells increased from 7% to 11% after transplantation and TLI + ATG conditioning (Figure 1B). Gated CD11b+ cells with the Gr-1hiCD11b+ phenotype increased from 9% in untreated mice to 19% after transplantation (Figure 1B).
Our previous studies showed that Gr-1hiCD11b+ splenic myeloid cells were predominantly granulocytic before and after transplantation, because the large majority expressed the Ly6G marker of granulocytes, and the minority expressed the Ly6C marker of macrophages.17 Figure 1C shows that the mean absolute number of splenic T cells after transplantation was significantly reduced to 1 × 10⁶ cells compared with 20 × 106 cells in untreated mice (P < .001). In contrast there was a significant increase in the mean absolute number of Gr-1hiCD11b+ cells in the spleen, from 1 × 10⁶ cells in untreated mice to 2.75 × 10⁶ cells after transplantation (P < .05).
Sorted Gr-1hiCD11b+ cells obtained from untreated and posttransplant mice were tested for immunosuppressive function in MLR cultures of BALB/c spleen responder and C57BL/6 irradiated spleen stimulator cells. Although Gr-1hiCD11b+ cells from untreated mice did not suppress the proliferation responder total T cells,17 addition of sorted posttransplant Gr-1hiCD11b+ cells suppressed proliferation by 50% (P < .001; Figure 1D). The posttransplant cells expressed markedly increased levels of immunosuppressive molecules PD-L1 and ARG-1 compared with cells from untreated mice.17
To determine whether MDSCs that developed after transplantation were necessary for mixed chimerism, recipient mice were selectively depleted of these cells by administration of anti–Gr-1 mAb at the time of the donor cell infusion.17 Figure 1E shows that the mean percentage of donor cells among gated total T cells was 7% without depletion of MDSCs. After depletion, it was reduced to <1% in all mice tested (P < .01). Depletion of MDSCs led to loss of T-cell mixed chimerism and a marked reduction in the survival of heart allografts after transplantation. As shown in Figure 1F, all heart grafts survived for ≥100 days in recipients without MDSC depletion, whereas all heart grafts were rejected in recipients with MDSC depletion, with a mean survival time ∼ 25 days (P < .001).
Next, we tested whether purified MDSCs increase the duration of heart graft survival in MDSC-depleted recipients. IV administration of purified MDSCs significantly improved graft survival (P < .001; Figure 1F). Although the marked increase in the absolute number of MDSCs observed in the spleen during the first month after donor cell infusion was associated with the establishment of chimerism and tolerance, it was not clear whether the increase was a transient or persistent change. Accordingly, we compared the mean absolute numbers obtained on day 28 after donor cell infusion with the number obtained at day 85. As shown in Figure 1G, there was a marked decrease in the numbers from day 28 to day 85 (P < .001), such that the mean at the later time point was not significantly different from the pretransplant value.
Condamine et al showed that the gain of immunosuppressive function by pmn MDSCs in cancer patients was associated with the increased expression of LOX-1 surface receptor.20 To determine whether the gain of immunosuppressive function by pmn myeloid cells in our mouse model was associated with a similar change in LOX-1 expression, Gr-1hiCD11b+ cells obtained pre-TLI and post-TLI were stained for LOX-1. There was a significant increase (P < .001) in the frequency and mean fluorescent intensity of LOX-1+ cells among Gr-1hiCD11b+ cells in the spleen posttransplant (Figure 1H).
Changes in T cells and myeloid cells following transplantation with TLI + ATG conditioning in humans
Given the above findings, we wanted to determine whether the immunosuppressive myeloid cells observed in mice17 are present in the blood of human recipients of combined KTx, TLI + ATG conditioning, and HCT. Accordingly, pre- and serial posttransplant blood samples were studied from 10 fully HLA-matched and 11 HLA haplotype-mismatched KTx recipients enrolled in similar tolerance induction trials.3,4,7 All patients were given a KTx, followed by 10 doses of TLI and 5 doses of ATG, and infusion of donor hematopoietic cells immediately after the completion of TLI on postoperative day 11.3,4,7 Blood samples were analyzed at 3 posttransplant time intervals (1.5-4, 6-12, and 13-24 months) and compared with pretransplant samples. All of the HLA-matched patients were chimeric for ≥12 months. These tolerant patients were successfully weaned off all immunosuppressive drugs by the time that the 13- to 24-month blood samples were obtained.3,4,7 HLA-mismatched patients who were persistent mixed chimeras were tapered and completely withdrawn from mycophenolate mofetil by 12 months. Figure 2A and B (and supplemental Figure 1) show a representative flow cytometry gating strategy used to analyze changes in total T cells and MDSCs in pretransplant and early (9 weeks) posttransplant samples from an HLA-matched patient.21-23 pmn MDSCs were identified as lineage negative (CD3−CD56−CD19−) and CD11bhiDRloCD14−CD15+.
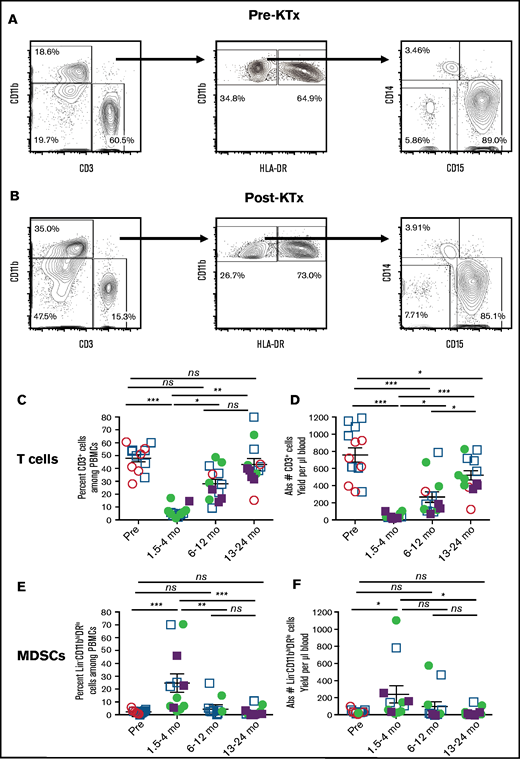
Analysis of T cells and myeloid cells from patients before and after KTx and HCT. Representative 2-color staining of PBMCs before (A) and 9 weeks after (B) transplantation from a single patient. CD19+ B and CD56+ natural killer NK cells were gated out before identifying CD3+ T and CD11b+ myeloid cells (left panels). Lineage negative (Lin− = CD3−CD19−CD56−) CD11bhi myeloid cells are enclosed in boxes to identify phenotypic MDSCs (CD11bhiDRlo) and monocytes (CD11bhiDRhi) (middle panels). Further analysis of the phenotypic MDSCs for expression of CD14 monocytic vs CD15 granulocytic/pmn markers are shown (right panels). The percentage of cells in each box is indicated. Mean percentage (C) and absolute numbers (D) of T cells. Mean percentage (E) and absolute numbers (F) of total MDSCs pre vs posttransplant. HLA-matched recipients are represented as circles, HLA-mismatched recipients are represented as squares. Filled symbols indicate that the recipients were mixed chimeric (>5% donor type cells in whole blood), and open symbols indicate that the recipients were not chimeric at the time that the assay was performed. Data are mean ± standard error of the mean for each group. *P < .05, **P < .01, ***P < .001, Mann-Whitney U test of independent means; significance was subsequently determined by 1-way ANOVA, multicomparison analysis with Holm-Sidak correction. ns, not significant (P > .05).
Analysis of T cells and myeloid cells from patients before and after KTx and HCT. Representative 2-color staining of PBMCs before (A) and 9 weeks after (B) transplantation from a single patient. CD19+ B and CD56+ natural killer NK cells were gated out before identifying CD3+ T and CD11b+ myeloid cells (left panels). Lineage negative (Lin− = CD3−CD19−CD56−) CD11bhi myeloid cells are enclosed in boxes to identify phenotypic MDSCs (CD11bhiDRlo) and monocytes (CD11bhiDRhi) (middle panels). Further analysis of the phenotypic MDSCs for expression of CD14 monocytic vs CD15 granulocytic/pmn markers are shown (right panels). The percentage of cells in each box is indicated. Mean percentage (C) and absolute numbers (D) of T cells. Mean percentage (E) and absolute numbers (F) of total MDSCs pre vs posttransplant. HLA-matched recipients are represented as circles, HLA-mismatched recipients are represented as squares. Filled symbols indicate that the recipients were mixed chimeric (>5% donor type cells in whole blood), and open symbols indicate that the recipients were not chimeric at the time that the assay was performed. Data are mean ± standard error of the mean for each group. *P < .05, **P < .01, ***P < .001, Mann-Whitney U test of independent means; significance was subsequently determined by 1-way ANOVA, multicomparison analysis with Holm-Sidak correction. ns, not significant (P > .05).
Dominance of MDSCs early after transplantation
Figure 2C through F show changes in the percentage and absolute numbers of T cells and MDSCs among PBMCs from patients before and at serial time points after transplantation. The data from the fully HLA-matched patients (circles), as well as HLA-mismatched patients (squares) who were mixed chimeric (closed symbols, >5% donor type cells in whole blood) or nonchimeric (open symbols), were combined. Although the mean percentage of T cells was 45% pretransplant, there was a statistically significant reduction to a mean of 5% early posttransplant (nadir = 1.5-4 months; P < .001) (Figure 2C). There was a return toward the pretransplant values at 6 to 12 months and at 13 to 24 months posttransplant, such that the mean of 45% at the latest time interval was significantly increased compared with the early posttransplant nadir (P < .01). The mean percentage of MDSCs was 3%, and all values were <10% pretransplant (Figure 2E). The mean increased to 25% at 1.5 to 4 months posttransplant (P < .001). By 6 to 12 months, the mean values were not significantly different from the pretransplant values.
Figure 2D also shows a dramatic decrease in the mean absolute number of T cells early posttransplant (pretransplant mean of 750 cells per microliter decreased to 50 cells per microliter). This was due to the TLI + ATG conditioning, because severe T-cell depletion was already observed just before the donor cell infusion (data not shown). There was a gradual recovery in absolute numbers of T cells to a mean of 300 cells per microliter at 6 to 12 months and to 500 cells per microliter during the second year. The mean absolute cell number of MDSCs increased early posttransplant (250 cells per microliter) compared with pretransplant (20 cells per microliter; P = .05) (Figure 2F). Regression analysis of the percentage of T cells vs the percentage of MDSCs among PBMCs at all time points before and after transplantation showed that the posttransplant decrease in the percentage of T cells correlated strongly (P < .0002) with the increase in the percentage of MDSCs (supplemental Figure 2A). However, regression analysis of the posttransplant decrease in the absolute number of T cells vs the increase in the absolute number of MDSCs in the blood failed to show a significant correlation (P < .128; supplemental Figure 2B).
Dominance of Lox-1+ pmn MDSCs after transplantation
Figure 3 shows the changes in the percentages and absolute cell numbers of CD14+ monocytic MDSCs, CD15+ pmn MDSCs, and CD14−CD15− double-negative MDSCs over time. The monocytic MDSCs were a minority subset among MDSCs and accounted for <10% of total MDSCs early posttransplant (Figure 3A,D). The mean percentage increased to a peak of 25% at 6 to 12 months and remained above the early time point thereafter. However, the posttransplant increases were not significant (P > .05). In contrast, the pmn MDSC subset was predominant. There was an increase in the mean percentage of pmn MDSCs from 58% of total MDSCs pretransplant to 82% early posttransplant (P = .16; Figure 3B). The absolute cell number also increased from 20 to 225 cells per microliter of blood, which was at the border of significance (P = .05, Figure 3E). Thereafter, there was a decline at 6 to 12 months to ∼50 cells per microliter (Figure 3B).
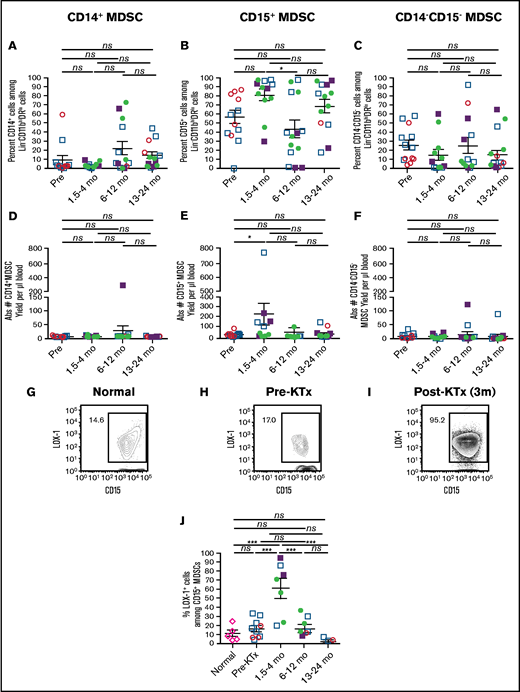
Changes in subsets of MDSCs and expression of LOX-1 before and after transplantation. Gated MDSCs were analyzed for percentages of CD14+ monocytic MDSCs (A), CD15+ pmn MDSCs (B), and CD14−CD15− double-negative MDSCs (C). MDSC subsets were also enumerated to determine the absolute cell number of CD14+ monocytic MDSCs (D), CD15+ pmn MDSCs (E), and CD14−CD15− double-negative MDSCs (F) in blood. Percentage of LOX-1+CD15+ pmn MDSCs in a normal subject (G) and in an HLA-mismatched recipient pretransplant (H) and at 3 months (3m) posttransplant (I). (J) Mean LOX-1+ cells among CD15+ pmn MDSCs from normal individuals and recipients at pretransplant vs 1.5 to 4 months posttransplant vs 6 to 12 months posttransplant vs 13 to 24 months posttransplant. *P < .05, **P < .01, ***P < .001, Mann-Whitney U test of independent means; significance was subsequently determined by 1-way ANOVA, multicomparison analysis with Holm-Sidak correction. ns, not significant (P > .05). The data from the fully HLA-matched patients (circles), as well as HLA-mismatched patients (squares) who were mixed chimeric (closed symbols, >5% donor type cells in whole blood) or nonchimeric (open symbols), were combined.
Changes in subsets of MDSCs and expression of LOX-1 before and after transplantation. Gated MDSCs were analyzed for percentages of CD14+ monocytic MDSCs (A), CD15+ pmn MDSCs (B), and CD14−CD15− double-negative MDSCs (C). MDSC subsets were also enumerated to determine the absolute cell number of CD14+ monocytic MDSCs (D), CD15+ pmn MDSCs (E), and CD14−CD15− double-negative MDSCs (F) in blood. Percentage of LOX-1+CD15+ pmn MDSCs in a normal subject (G) and in an HLA-mismatched recipient pretransplant (H) and at 3 months (3m) posttransplant (I). (J) Mean LOX-1+ cells among CD15+ pmn MDSCs from normal individuals and recipients at pretransplant vs 1.5 to 4 months posttransplant vs 6 to 12 months posttransplant vs 13 to 24 months posttransplant. *P < .05, **P < .01, ***P < .001, Mann-Whitney U test of independent means; significance was subsequently determined by 1-way ANOVA, multicomparison analysis with Holm-Sidak correction. ns, not significant (P > .05). The data from the fully HLA-matched patients (circles), as well as HLA-mismatched patients (squares) who were mixed chimeric (closed symbols, >5% donor type cells in whole blood) or nonchimeric (open symbols), were combined.
Condamine et al showed that pmn MDSCs in the blood of cancer patients can be distinguished from nonimmunosuppressive neutrophils via the expression of LOX-1.20 In addition, the posttransplant pmn MDSCs in our preclinical model (Figure 1G-H) showed an increase in LOX-1 expression in association with the increase in immunosuppressive function. Therefore, we gated on CD15+ pmn MDSCs and analyzed their LOX-1 expression. Representative staining patterns of LOX-1 on CD15+ gated pmn MDSCs from blood samples of control individuals (Figure 3G) and our KTx patients pretransplant (Figure 3H) and early posttransplant (Figure 3I) are shown. The percentage of LOX-1+ cells was highest in early posttransplant samples. The mean percentages of LOX-1+ cells among pmn MDSCs are shown in Figure 3J. Although the mean percentage of LOX-1+ cells was <25% in the normal and KTx patient pretransplant samples, the mean percentage increased to 62% in the samples taken between 1.5 and 4 months posttransplant (P < .001). The mean percentage of LOX-1+ pmn MDSCs returned to pretransplant values between 6 and 12 months and decreased thereafter.
Increased immunosuppressive function of MDSCs after transplantation
Our murine studies showed that host splenic MDSCs developed an increased ability to suppress host T-cell immune responses to alloantigens in vitro following TLI conditioning alone.17,18 To determine whether blood MDSCs from KTx + HCT patients enrolled in our tolerance trials developed suppressive function, we sorted total MDSCs pre- and posttransplant, according to the gating strategy in Figure 2A and supplemental Figure 1. We compared MDSCs for their ability to suppress the proliferation and cytokine secretion of pretransplant total T cells stimulated with anti-CD3/anti-CD28 TCBs in vitro. Figure 4A shows representative line graphs of proliferation of CFSE-labeled pretransplant gated CD4+ T cells among total T cells. The T cells were cultured for 5 days with anti-CD3/anti-CD28 microbeads in the presence or absence of autologous sorted total pre- or early posttransplant MDSCs. Although cultures without bead stimulation showed that <1% of the T cells proliferated (CFSElo), cultures with TCB stimulation showed that > 50% of CD4+ T cells proliferated (Figure 4A). When pretransplant MDSCs were added to the cultures there was minimal reduction in the percentage of T cells that proliferated in response to TCB. In contrast, addition of the posttransplant MDSCs markedly reduced the percentage of CFSElo cells to 19% (Figure 4B; CD4 T cells shown). Thus, posttransplant MDSCs were considerably more potent in suppressing the proliferation of pretransplant T cells compared with pretransplant MDSCs.
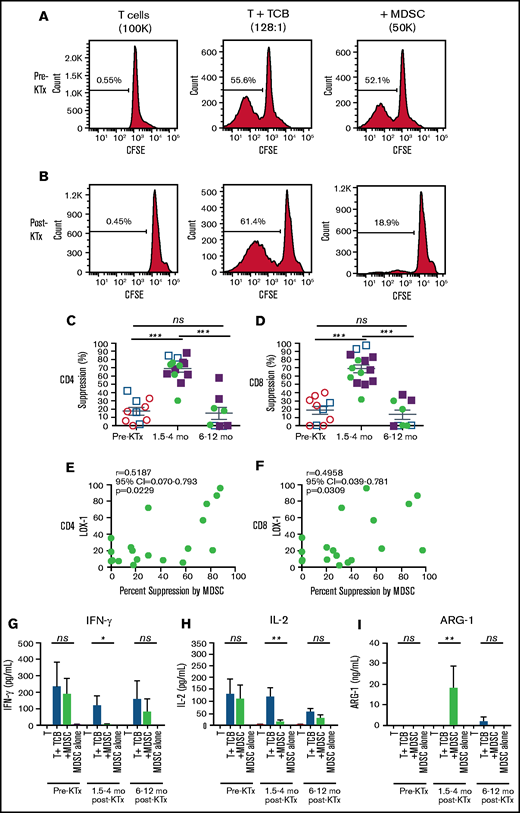
Suppression of proliferation of purified pretransplant T cells by MDSCs before and after transplantation. Percentage suppression was determined by comparing the percentage of CFSElo pretransplant T cells in anti-CD3/anti-CD28 TCB–stimulated cultures with or without the addition of sorted pretransplant (A) or posttransplant (B) MDSCs after 4 or 5 days of coculture, as shown in the representative line graphs of CFSE staining of gated pretransplant CD4+ T cells. Mean percentage suppression mediated by sorted MDSCs obtained from patients before and at serial time points after transplantation for CD4+ (C) and CD8+ (D) T cells. P values were determined by the Mann-Whitney U test of independent means; significance was subsequently determined by 1-way ANOVA, multicomparison analysis with Holm-Sidak correction. Linear regression analyses of the percentage of Lox-1+ cells among pmn MDSCs vs percentage suppression of CD4+ (E) and CD8+ (F) T cells mediated by the MDSCs at all time points. Mean (± standard error of the mean) concentration of IFN-γ (G), IL-2 (H), and ARG-1 (I) in the culture supernatants from T cells alone, T cells plus anti-CD3/anti-CD28 TCBs, T cells plus anti-CD3/anti-CD28 beads plus MDSCs, or MDSCs alone. P values were determined by 1-way ANOVA, Kruskal-Wallis multi-comparison analysis with Dunn’s correction.
Suppression of proliferation of purified pretransplant T cells by MDSCs before and after transplantation. Percentage suppression was determined by comparing the percentage of CFSElo pretransplant T cells in anti-CD3/anti-CD28 TCB–stimulated cultures with or without the addition of sorted pretransplant (A) or posttransplant (B) MDSCs after 4 or 5 days of coculture, as shown in the representative line graphs of CFSE staining of gated pretransplant CD4+ T cells. Mean percentage suppression mediated by sorted MDSCs obtained from patients before and at serial time points after transplantation for CD4+ (C) and CD8+ (D) T cells. P values were determined by the Mann-Whitney U test of independent means; significance was subsequently determined by 1-way ANOVA, multicomparison analysis with Holm-Sidak correction. Linear regression analyses of the percentage of Lox-1+ cells among pmn MDSCs vs percentage suppression of CD4+ (E) and CD8+ (F) T cells mediated by the MDSCs at all time points. Mean (± standard error of the mean) concentration of IFN-γ (G), IL-2 (H), and ARG-1 (I) in the culture supernatants from T cells alone, T cells plus anti-CD3/anti-CD28 TCBs, T cells plus anti-CD3/anti-CD28 beads plus MDSCs, or MDSCs alone. P values were determined by 1-way ANOVA, Kruskal-Wallis multi-comparison analysis with Dunn’s correction.
Figure 4C and D show the changes in the mean percentages of suppression of proliferation of pretransplant gated CD4+ and CD8+ T cells after the addition of pretransplant vs posttransplant MDSCs. There was a significant increase (P < .001) in the mean percentage of suppression of CD4+ and CD8+ gated T-cell proliferation when early posttransplant MDSCs (∼70% suppression) were added to cultures compared with pretransplant MDSCs (∼18% suppression). The suppressive function of MDSCs returned to baseline 6 to 12 months posttransplant (mean, 15%; P < .001) (Figure 4C-D). The suppression data from the matched and mismatched patients were also analyzed separately; the pattern was the same as for the combined data (supplemental Figure 3).
Because the kinetics of LOX-1 and the suppressive function of pmn MDSCs were similar, we performed regression analysis of changes in the percentage of LOX-1+ pmn MDSCs vs the percentage suppression at all time points (Figure 4E-F). There was a statistically significant (P < .05) correlation between the suppression of CD4+ and CD8+ T-cell proliferation and LOX-1 expression among pmn MDSCs.
To determine the mechanism through which MDSCs suppress recipient T-cell proliferation, we measured the concentrations of 20 cytokines/chemokines in our T-cell cocultures with and without MDSCs (Figure 4G-I). We found that addition of early posttransplant MDSCs significantly suppressed the secretion of interferon-γ (IFN-γ) and interleukin-2 (IL-2) in culture supernatants (P < .05 to .01), whereas pretransplant and late posttransplant MDSCs failed to significantly suppress secretion of these cytokines. Previous studies have shown that the suppressive function of MDSCs is dependent on ARG-1, an enzyme that catabolizes and depletes arginine from the T-cell microenvironment.21 Inhibition of ARG-1 with arginine blocked the in vitro suppressive activity of MDSCs in our murine studies.17 Figure 4I shows that supernatants from cocultures of pretransplant T cells with TCB and early posttransplant MDSCs contained significantly higher (P < .01) concentrations of ARG-1 compared with supernatants from cultures without MDSCs.
We also determined whether the addition of posttransplant MDSCs suppressed the activation of CD4+ and CD8+ T cells in vitro. Supplemental Figure 4A shows representative fluorescence-activated cell sorting staining of gated CD8+ T cells in cocultures with and without TCB stimulation in the presence or absence of MDSCs. TCB stimulation induced a robust increase in the percentage of CD25hi T cells among gated CD8+ T cells, from <1% in the unstimulated cells to 55% to 72% in the TCB-stimulated T cells. Addition of early posttransplant MDSCs to TCB-stimulated cultures reduced the percentage of CD25hi T cells to 5%. In contrast, addition of pretransplant or >6-month posttransplant MDSCs had little or no effect (47% to 57%, respectively). Supplemental Figure 4 shows the mean suppression of pretransplant T-cell activation, as measured by the percentage of CD25hi cells among the gated CD4+ and/or CD8+ T cells in the T + TCB cultures after the addition of the MDSCs. There was a highly significant (P < .001), but transient, suppression of CD25 upregulation when early posttransplant MDSCs were added to T + TCB cocultures.
Lack of increase in LOX-1+ pmn MDSCs following transplantation using ATG and standard-of-care immunosuppressive drugs without TLI
In further experiments, we determined whether the increase in Lox-1+ pmn MDSCs is a general finding in KTx recipients given ATG plus standard-of-care immunosuppressive drugs, regardless of the extent of HLA matching, cause of end-stage renal disease, or use of living or deceased donors. Accordingly, we studied 6 consecutive KTx patients at the Stanford Medical Center who were treated with ATG and standard-of-care immunosuppressive drugs without matching for the latter parameters. The standard-of-care patients had a statistically significant (P < .05) nadir of T-cell depletion early posttransplant (frequency) that lasted for ≥4 months after administration of ATG that was similar to that of the early time point in our experimental patients conditioned with TLI + ATG. However, there was an 86% reduction in the frequency of T cells in the blood of our TLI + ATG–conditioned patients early posttransplant (mean, 6.6% T cells among PBMCs; Figure 2C) compared with pretransplant (mean, 48%). There was only a 34% reduction in the frequency of T cells in the blood from the ATG-only patients (mean, 31% T cells among PBMCs posttransplant vs 47% pretransplant (Figure 5A). The absolute number of T cells was not significantly reduced in the ATG-only patients (P > .05; Figure 5B).
![Patients given standard-of-care transplants and ATG differ from patients given TLI + ATG conditioning and HCT. Blood samples were obtained before and 1.5 to 4 months after transplantation from a control group of standard-of-care KTx recipients given ATG (n = 5-6). (A) Changes in the mean (± standard error of the mean [SEM]) percentage of T cells among PBMCs. (B) Changes in the absolute numbers (Abs #) of T cells. (C) Changes in the mean (± SEM) percentage of total phenotypic MDSCs among PBMCs. (D) Changes in the absolute numbers (Abs #). (E) Changes in the percentage of CD15+ pmn MDSCS. (F) Changes in the absolute numbers (Abs #) of CD15+ pmn MDSCs. (G) Changes in the percentage of Lox-1+ pmn MDSCs. (H) Changes in the absolute numbers (Abs #) of Lox-1+ pmn MDSCs. P values were determined by the Mann-Whitney U test of independent means. Means were calculated from blood samples such that n = 5 or 6 patients for each time point were used. ns, not significant.](https://ash.silverchair-cdn.com/ash/content_public/journal/bloodadvances/5/17/10.1182_bloodadvances.2020003669/8/m_advancesadv2020003669f5.png?Expires=1769084406&Signature=hhdyJ7E56HRcNbGsSPe~-sNrO9SUYWp03gkTAwLAGp83v6LKp7ou62xLowjzmMc2gyuy5ShA9GSSfiyCg7r0g1DDI8xt6usXORYgJRL2usQ8khXJD20zBQfLuZUnq13hfib2WtKO9zyIBnRfrZiizdKMkpbZs1BMZ7HVLdYk6sQFpVWl-J6HjwctrWDyt7QTJNHBYToP3AQOY5Y4rzxzj6AKUI8BcO8kdv~fA8VSVqdyOi9gJozjKMkGxIncV21~HkkWBNLnm~qgt6xRgIsBC-dJmr6ZTjRdUg2FmVNnl4~hVsLkISP5sl63WWOGQHNv12juco5wq2-YNKQb8bwfdA__&Key-Pair-Id=APKAIE5G5CRDK6RD3PGA)
Patients given standard-of-care transplants and ATG differ from patients given TLI + ATG conditioning and HCT. Blood samples were obtained before and 1.5 to 4 months after transplantation from a control group of standard-of-care KTx recipients given ATG (n = 5-6). (A) Changes in the mean (± standard error of the mean [SEM]) percentage of T cells among PBMCs. (B) Changes in the absolute numbers (Abs #) of T cells. (C) Changes in the mean (± SEM) percentage of total phenotypic MDSCs among PBMCs. (D) Changes in the absolute numbers (Abs #). (E) Changes in the percentage of CD15+ pmn MDSCS. (F) Changes in the absolute numbers (Abs #) of CD15+ pmn MDSCs. (G) Changes in the percentage of Lox-1+ pmn MDSCs. (H) Changes in the absolute numbers (Abs #) of Lox-1+ pmn MDSCs. P values were determined by the Mann-Whitney U test of independent means. Means were calculated from blood samples such that n = 5 or 6 patients for each time point were used. ns, not significant.
Patients given standard-of-care transplants and ATG differ from patients given TLI + ATG conditioning and HCT. Blood samples were obtained before and 1.5 to 4 months after transplantation from a control group of standard-of-care KTx recipients given ATG (n = 5-6). (A) Changes in the mean (± standard error of the mean [SEM]) percentage of T cells among PBMCs. (B) Changes in the absolute numbers (Abs #) of T cells. (C) Changes in the mean (± SEM) percentage of total phenotypic MDSCs among PBMCs. (D) Changes in the absolute numbers (Abs #). (E) Changes in the percentage of CD15+ pmn MDSCS. (F) Changes in the absolute numbers (Abs #) of CD15+ pmn MDSCs. (G) Changes in the percentage of Lox-1+ pmn MDSCs. (H) Changes in the absolute numbers (Abs #) of Lox-1+ pmn MDSCs. P values were determined by the Mann-Whitney U test of independent means. Means were calculated from blood samples such that n = 5 or 6 patients for each time point were used. ns, not significant.
Figure 5C shows that the percentage of MDSCs among PBMCs in the control patients increased significantly posttransplant. However, the mean early posttransplant percentage was 10-fold lower (2.5%; Figure 5C) compared with our TLI + ATG patients (25%; Figure 2E). Similarly, the mean absolute number of MDSCs in the posttransplant blood of control patients was also 10-fold lower than that of TLI + ATG patients (200 cells per microliter; Figure 5D vs Figure 2F). The posttransplant change in the control patients was not significant. Figure 5E and F show that the mean percentage and absolute number of pmn MDSCs among PBMCs did not increase significantly in the control patients. In contrast, there was a significant increase in the absolute number of these cells in the TLI + ATG patients that was ∼10-fold higher than in the control patients (Figure 5F vs Figure 3E). Also, there was not a significant increase in the mean percentage or absolute number of Lox-1+ pmn MDSCs in the standard-of-care patients (Figure 5G-H).
Discussion
The goal of the current study was to determine whether mice and humans given TLI + ATG conditioning plus organ and hematopoietic cell transplants to induce tolerance develop similar immunosuppressive myeloid cells. In both cases, the recipients were given 10 doses of TLI and 5 doses of ATG in the immediate posttransplant period. There was a profound depletion of T cells and a significant increase in the absolute number of Gr-1hiCD11b+ cells in the blood and spleen of murine recipients after TLI + ATG conditioning. The latter cells were predominantly pmn MDSCs that gained the capacity to suppress responder T-cell proliferation in MLRs with pretransplant host responder T cells and donor stimulator cells. In contrast, pmn MDSCs obtained from untreated mice lacked immunosuppressive function. Posttransplant MDSCs were required for the establishment of mixed chimerism, because selective depletion abrogated chimerism. Depletion of pmn MDSCs also abrogated chimerism and acceptance of the organ graft, whereas add back of purified posttransplant MDSCs restored chimerism and significantly prolonged heart graft survival.17
We investigated whether TLI + ATG conditioning in HLA-matched and -mismatched patients given combined KTx and HCT to induce mixed chimerism and tolerance resulted in similar immunological changes.3,4,7 Analysis of T-cell percentages and absolute numbers in blood showed marked T-cell lymphopenia within the first 4 months posttransplant, followed by a gradual recovery to pretransplant levels during the second year. There was a dramatic increase in the percentage of MDSCs in the early posttransplant period that correlated significantly with T-cell reduction, such that the dominance of T cells over MDSCs observed pretransplant was reversed early posttransplant. This result, as well as the increase in the absolute number of pmn MDSCs in blood, was similar to that observed in mice. All murine and human recipients who developed chimerism also developed T-cell depletion and immunosuppressive pmn MDSCs. However, chimerism was also dependent on the number of donor CD34+ cells injected and the number of HLA mismatches in our clinical trial, as well as on the development of tolerogenic dendritic cells, regulatory T cells, and natural killer T cells in our preclinical model.7,9,15,17,18
After transplantation, pmn MDSCs from murine and human transplant recipients upregulated LOX-1, similar to pmn MDSCs reported in cancer patients.20,23 Posttransplant MDSCs produced ARG-1 and significantly suppressed the proliferation, activation, and cytokine (IFN-γ and IL-2) secretion of CD4+ and CD8+ T cells. The MDSCs obtained from the patients enrolled in the tolerance study using TLI + ATG conditioning differed from the MDSCs reported previously in standard-of-care kidney transplant patients; the latter cells that had acquired immunosuppressive function after transplant were monocytic, rather than granulocytic, MDSCs.24-28 Control patients treated with ATG without TLI in the current study did not exhibit significantly increased pmn MDSC when pre- and posttransplant cells were compared.
In conclusion, there was a significant change in the balance of MDSCs and T cells early posttransplant in mice and humans, favoring a marked increase in LOX-1+ pmn MDSCs with increased immunosuppressive function. Human MDSCs suppressed proliferation, activation, and production of proinflammatory cytokines (IFN-γ and IL-2) by T cells. Because MDSCs with nearly identical characteristics are required for chimerism and tolerance in transplanted mice treated with the same conditioning regimen, these cells likely contribute to chimerism and tolerance in human transplant recipients as well. We did not provide an update of clinical outcome data in patients who continue to be enrolled and monitored in our ongoing clinical studies, because that is beyond the scope of the present report.7 However, it is of interest that, at present and with up to 14 years of observation, <5% of HLA-matched and -mismatched patients enrolled in the tolerance protocol (n = 59) had kidney graft loss due to rejection.7
Acknowledgments
The authors thank the following groups and individuals for contributions to this work: the Bone Marrow Transplant (BMT) Cell Therapy Facility and Investigational New Drug (IND) Team (Kevin Sheehan, Catherine McIntyre, Mary McLeod, Nery Diaz, Tumari Tutt, Christopher Bainter, XiaoBin Tang, Zoe Amiri, Randy Armstrong, Keri Tate, Adam Pegueros, Kimberly Rodriguez, Zain Dibian, Navneet Anand, Molly Coyne, Kartoosh Hedari, Dana Bistritz, Anita Wong, Kauhleen Mangayan, Jeff Agapay, Rikin Patel, Brenda Digiacomo) for producing HCT cell products; Richard Hoppe and our Radiation Oncology colleagues for performing TLI conditioning; the Kidney Transplant and BMT Clinical Team for patient care; the Stanford Shared FACS Facility staff (Martin Bigos, Lisa Nichols, Cathy Carswell-Crumpton, Ometa Herman, Tim Knaak, Bianca Gomez, Meredith Weglarz, Brandon Carter, Wayne Moore, Tom Nozaki, David Parks) for advice on flow cytometry; the BMT (Mindy Ratra, Kassandra Kasparek, Krish Rangarajan) and Human Immune Monitoring Core personnel (Rohit Gupta, Alaina Puleo, Bianca Gomez, Vivien Diep) for assistance with PBMC processing and biobanking; and Joyce Troiano for administrative assistance. The authors also thank Damon Cook and Jonas Ruiz (Thermofisher Scientific) for technical assistance with the Luminex instrument and assays.
This work was supported by National Institutes of Health grants National Heart, Lung, and Blood Institute P01HL075462 and National Institute of Allergy and Infectious Diseases R01AI85024 and the California Institute for Regenerative Medicine (Clin 2-09439). Fluorescence-activated cell sorting and data collection were performed on instruments in the Stanford Shared FACS Facility that were obtained using a National Institutes of Health S10 Shared Instrument Grant (FACSAria grant S10RR025518-01).
Authorship
Contribution: K.P.J. procured and processed blood samples, designed and performed immune monitoring and functional studies, analyzed data, performed statistical analysis, and cowrote and edited the manuscript; J.D.S., S.B., J.A.S., R.N., and R.L. supervised the clinical management of patients and the experimental protocol; A. Shori obtained informed consent from patients and coordinated all aspects of the clinical study and patient sample procurement; D.A.H. performed all murine experiments and analyzed the data; S.D., X.J., P.Z., R.D.P., T.H.-H.W., A. Saraswathula, J.B., J.W., E.M., and H.M. assisted with study design, experimental optimization, and data analysis; J.S.T. and P.L. supervised all statistical analyses and performed additional statistical analyses of data; E.M. and E.G.E. helped to design the studies and edited the manuscript; and S.S. designed experiments, analyzed data, and wrote and edited the manuscript.
Conflict-of-interest disclosure: S.S., E.G.E. and R.L. are cofounders of Medeor Therapeutics, a company that supports tolerance clinical trials. The remaining authors declare no competing financial interests.
Correspondence: Samuel Strober, Department of Medicine, Stanford University School of Medicine, CCSR 2215c, 1291 Welch Rd, Stanford, CA 94305-5166; e-mail: sstrober@stanford.edu.

