

Key Points
T cells expressing mbaIL6 remove IL-6 from the milieu and neutralize its signaling capacity.
CAR–T cells with mbaIL6 have intact antitumor activity and neutralize macrophage-derived IL-6, a feature that could prevent CRS.

Abstract
Infusion of T lymphocytes expressing chimeric antigen receptors (CARs) can produce extraordinary antitumor activity in patients with leukemia, lymphoma, and myeloma. The signaling mechanisms activating T cells and provoking tumor cell killing also trigger cytokine secretion and macrophage activation, leading to cytokine release syndrome (CRS). CRS is a serious side effect of CAR–T cells, and proinflammatory interleukin-6 (IL-6) is central to its pathogenesis. To endow T cells with anti-CRS activity, we designed a nonsignaling membrane-bound IL-6 receptor (mbaIL6) constituted by a single chain variable fragment derived from an anti–IL-6 antibody linked to a transmembrane anchoring peptide. We found that mbaIL6 expressed on the surface of T cells could rapidly remove IL-6 from the culture supernatant. IL-6 removal was proportional to the number of mbaIL6+ cells, increased with T-cell proliferation, and neutralized IL-6 signaling and function. A construct encoding for mbaIL6 and an anti–CD19-41BB-CD3ζ CAR allowed simultaneous expression of both receptors. T cells with mbaIL6 and CAR neutralized macrophage-derived IL-6 while exerting powerful antitumor activity. Cytotoxicity and proliferation were identical to those of cells expressing CAR alone in vitro, and CAR–T cells were effective in xenograft models regardless of mbaIL6 expression. Levels of human IL-6 in mice, however, were greatly reduced if T cells expressed both receptors instead of CAR alone. Thus, CAR–T cells with on-board capacity to extinguish IL-6 represent a new approach to prevent CRS and suppress its severity without affecting the antitumor potential of CAR–T cells.
Introduction
T lymphocytes engineered to express chimeric antigen receptors (CARs) can selectively target and eliminate cancer cells while exerting limited cytotoxicity against normal tissues.1,2 The clinical activity of CAR–T cells has been primarily shown in B-cell malignancies, including acute lymphoblastic leukemia (ALL), non-Hodgkin lymphoma, and chronic lymphocytic leukemia, and in multiple myeloma.3-13 Patients enrolled in current CAR–T cell trials have typically exhausted all standard treatment options, but the extraordinary results obtained thus far suggest that this approach is likely to become a component of frontline therapy for these malignancies; it may also be applicable to other hematologic malignancies and solid tumors. Therefore, improving the safety profile of CAR–T cells is critical.
CAR–T cell activation upon contact with target cells can cause a sharp increase in inflammatory cytokines, producing cytokine release syndrome (CRS), a frequent and often serious side effect of CAR–T cell infusions that can be associated with neurotoxicity.14-18 In addition to the potential life-threatening nature of these adverse events, patients with severe CRS require hospitalization and intensive care, markedly increasing the costs of the procedure. The proinflammatory cytokine interleukin-6 (IL-6) secreted primarily by activated macrophages plays a central role in the development of CRS. Plasma levels of IL-6 and C-reactive protein, produced by hepatocytes stimulated by IL-6, correlate with CRS severity,14-18 and the anti–IL-6 receptor antibody tocilizumab is regarded as a key treatment of CRS, although it is not always effective.4,14-17,19
Whether IL-6–mediated signaling is required for CAR–T cell cytotoxicity, proliferation, and persistence is still unclear. Administration of tocilizumab, however, does not interfere with CAR–T cell potency,4,20 suggesting that CAR–T cell function might be maintained in the absence of such signaling. In the current study, a novel receptor was developed that neutralizes IL-6 and can be combined in a single construct with a CAR. T cells expressing both receptors can quickly neutralize IL-6 in their milieu while retaining all functions of CAR–T cells.
Materials and methods
Cells
Cell lines Nalm-6, Daudi, Jurkat, THP-1, U937, DS-1, and HEK 293T were from ATCC (Manassas, VA); OP-1 was developed in our laboratory.21 Cell lines were cultured in RPMI 1640 (Thermo Fisher Scientific, Waltham, MA), with 10% fetal bovine serum (FBS) (HyClone GE Healthcare, Logan, UT); 10 IU/mL IL-6 (Thermo Fisher Scientific) was added to maintain DS-1. HEK 293T was cultured in Dulbecco’s modified Eagle medium (HyClone GE Healthcare) with 10% FBS. Daudi and Nalm-6 were transduced with a murine stem cell virus (MSCV)–internal ribosome entry site (IRES)–green fluorescent protein (GFP) retroviral vector (from the St. Jude Children's Research Hospital Vector Development and Production Shared Resource, Memphis, TN) containing the firefly luciferase gene. DS-1 and OP-1 were transduced with an MSCV vector containing mCherry. Transduced cell lines were selected for GFP or mCherry expression with a MoFlo cell sorter (Beckman Coulter, Brea, CA). THP-1 cells were differentiated by culture in 10 mL of RPMI 1640, 10% FBS, and 20 ng/mL phorbol 12-myristate 13-acetate for 72 hours.
Peripheral blood mononucleated cells were isolated by density gradient from discarded, anonymized byproducts of platelet donations provided by the National University Hospital Blood Donation Centre or the Health Science Authority Blood Bank (Singapore) with approval of the Institutional Review Board of the National University of Singapore. They were cultured with Dynabeads Human T-Activator CD3/CD28 (Thermo Fisher Scientific) in RPMI 1640 with 10% FBS and 120 IU/mL IL-2 (Novartis, Basel, Switzerland).
Plasmids and retroviral transduction
The heavy and light chain sequences of the anti-IL6 human monoclonal antibody AME-19a were joined with a 15-amino acid [(G4S)3] linker (GenScript; Nanjing, China). The single chain variable fragment (scFv) was linked to the CD8α hinge and transmembrane region to form the membrane-bound anti–IL-6 construct (mbaIL6). The anti–CD19-41BB-CD3ζ construct was previously developed in our laboratory22 and linked to the mbaIL6 sequence with a P2A sequence.23 All constructs were subcloned into pMSCV-IRES-GFP between EcoRI and XhoI. Retroviral transduction was performed as described in the supplemental Methods.24
Cell staining and measurements of IL-6 levels and function
To detect mbaIL6, biotin-conjugated goat anti-human F(ab′)2 and allophycocyanin (APC)-conjugated streptavidin (Jackson ImmunoResearch, West Grove, PA) were used. Binding to human IL-6 conjugated to biotin (Abcam, Eugene, OR) was detected with streptavidin-APC; soybean-trypsin inhibitor conjugated to biotin (R&D Systems, Minneapolis, MN) was used as a control. APC calibration particles (ACP-30-5K) (Spherotech, Lake Forest, IL) were used to calculate mbaIL6 receptor number per cell. CD19-myc, a soluble fusion protein produced in our laboratory containing the extracellular domain of human CD19 linked to a myc-tag, was used to detect anti–CD19-41BB-CD3ζ. T cells were incubated with CD19-myc followed by R-phycoerythrin (PE)-conjugated anti-myc (Cell Signaling Technology, Danvers, MA). In some experiments, binding of mbaIL6 to IL-6 was detected by using anti–IL-6-PE (AS12; BD Biosciences, San Jose, CA). Surface marker analysis was performed as described in the supplemental Methods. For STAT3 phosphorylation, cells were stimulated with IL-6 or cell culture supernatant for 15 minutes, treated with Lyse/Fix Buffer, stained with anti–STAT3 (pY705)-PE (BD Biosciences), and analyzed by using Accuri C6 or Fortessa flow cytometers (BD Biosciences). In some experiments, THP-1 cells were exposed to 0 to 10 µg/mL tocilizumab (Selleck Chemicals, Houston, TX) for 30 minutes before IL-6 stimulation. Confocal microscope imaging was performed with an Olympus FV1000 TIRF (C4) inverted IX81 laser scanning confocal microscope system (Olympus, Tokyo, Japan).
To measure levels of recombinant human IL-6 (Thermo Fisher Scientific), culture supernatant was harvested and filtered with a 0.22 µm filter. IL-6 was measured with the Human IL-6 Platinum enzyme-linked immunosorbent assay (ELISA) kit (Thermo Fisher Scientific), interpolating the calculated standard curve with GraphPad Prism (GraphPad, San Diego, CA). Growth of the IL-6–dependent cell line DS-1 transduced with mCherry was measured by using the IncuCyte Live Imaging System (Essen Biosciences, Ann Arbor, MI); total red object integrated intensity, expressed as red calibrated units × µm2/well, was used to estimate DS-1 cell growth.
Cytokine production, cytotoxicity, and cells proliferation
Measurements of cytokine levels are described in the supplemental Methods.
To test cytotoxicity, target cells (OP-1) were labeled with Calcein-AM Red (Thermo Fisher Scientific) and cocultured with T cells at a 1:1 ratio for 4 hours. Viable target cells were counted by flow cytometry, as previously described.24 Killing of luciferase-labeled Daudi cells was calculated after staining with Bright-Glo Reagent (Promega, Madison, WI) and quantifying luminescence with an FLx 800 Microplate Reader (BioTek, Winooski, VT). For long-term cytotoxicity assays, mCherry-transduced OP-1 were cocultured with T cells at a 1:5 ratio. In some experiments, THP-1 was added at a 1:5:1 ratio (T-cell:OP-1:THP-1). Cell killing was quantitated by using the IncuCyte Live Imaging System. Exocytosis of cytotoxic granules was detected by adding anti-human CD107a-PE (BD Biosciences) at the beginning of cultures. After 1 hour, GolgiStop (BD Biosciences) was added and the cultures continued for another 3 hours before analysis by using flow cytometry.
To measure cell proliferation, T cells were cocultured with irradiated target cells at a 1:1 ratio; 120 IU/mL IL-2 was added every 2 days. Fresh irradiated target cells were added every 7 days to reconstitute the 1:1 ratio.
Xenograft models
To assess in vivo cytotoxicity, luciferase-transduced Nalm-6 cells were injected IV in NOD.Cg-Prkdcscid IL2rgtm1Wjl/SzJ (NOD/scid-IL2RGnull) mice (The Jackson Laboratory, Bar Harbor, ME) at 0.5 to 1 × 10⁶ cells/mouse. Three days later, T cells expressing either CAR or CAR plus mbaIL6 were injected IV at 20 × 106/mouse; all mice received 20 000 IU IL-2 intraperitoneally (IP) every 2 days. Tumor engraftment and growth were measured by using a Xenogen IVIS-200 system (Caliper Life Sciences, Waltham, MA). Imaging commenced 5 minutes after IP injection of D-luciferin potassium salt (3 mg/mouse; PerkinElmer, Waltham, MA) in aqueous solution, and photons emitted from luciferase-expressing cells were quantified by using Living Image 3.0 software (PerkinElmer). Mice were euthanized when the luminescence reached 1 × 10¹⁰ photons per second, or earlier if there were physical signs warranting euthanasia.
To assess removal of human IL-6 removal in mice, T cells expressing either anti-CD19 CAR or anti-CD19 CAR plus mbaIL6 were injected IV in NOD/scid-IL2RGnull mice (10 × 106/mouse). Three days later, mice were injected IP with 50 ng of human IL-6 and euthanized 2 hours later. Serum was obtained from blood collected by cardiac puncture.
In a third model, luciferase-transduced Daudi cells were injected IP in NOD/scid-IL2RGnull mice at 20 × 106 cells/mouse. Three days after Daudi injection, THP-1 and/or T cells expressing either anti-CD19 CAR or anti-CD19 CAR plus mbaIL6 were injected IP (20 × 106/mouse for both cell types). Two days after THP-1 and T-cell injection, mice were euthanized, and a peritoneal lavage using 2 mL of phosphate-buffered saline was performed. Tumor engraftment and growth were measured by using a Xenogen IVIS-200 system as described earlier.
Cells were collected from peritoneal lavage or mandibular vein, and counted by using the Coulter Ac·T diff Hematology Analyzer (Beckman Coulter). Cells were stained with anti-mouse CD45-PE (BD Pharmingen) or PE-Cy7 (BioLegend), anti-human CD3-APC, anti-human CD45-PerCP, and/or anti-human IL-6-PE (all from BD Biosciences) after treatment with Hybri-Max Red Blood Cell Lysing Buffer (MilliporeSigma, Burlington, MA) and analyzed by using flow cytometry. IL-6 concentration was measured by ELISA. These studies were approved by the Institutional Animal Care and Use Committee of the National University of Singapore.
Results
Design, expression, and specificity of mbaIL6
We generated an scFv from the sequences of the variable light and heavy chains of the human anti–IL-6 antibody AME-19a and linked it to a sequence encoding the hinge and transmembrane domains of CD8α (Figure 1A). The mbaIL6 construct was placed in an MSCV retroviral vector containing IRES and GFP. After transduction of the Jurkat T-cell line, all cells expressing GFP also expressed mbaIL6 (Figure 1B). The receptor could bind IL-6, as shown by both flow cytometry (Figure 1C) and confocal microscopy (Figure 1D). By comparing the fluorescence emitted by APC bound to IL-6 vs a standard curve of fluorescence emitted by APC calibration particles, we estimated that the number of receptors expressed was ∼20 000/cell (Figure 1E). Expression of the receptor remains stable >30 months after transduction (supplemental Figure 1).

Design and expression of mbaIL6. (A) Schema of the mbaIL6 construct. (B) mbaIL6 and GFP expression in Jurkat cells transduced with either GFP alone (“Control”) or GFP plus mbaIL6, labeled with biotin-conjugated goat anti-human F(ab′)2 and streptavidin-APC. (C) IL-6 binding of control or mbaIL6-transduced Jurkat cells, labeled with IL-6 biotin and streptavidin-APC. Soybean trypsin inhibitor (STI)–biotin was used as a labeling control. (D) Control or mbaIL6-transduced Jurkat cells were labeled with IL-6 biotin and streptavidin-APC; confocal images were captured with a 60× objective lens. (E) Log10 molecules of equivalent APC (MEAPC) and log10 mean fluorescence intensity (MFI) were plotted on a standard curve constructed using allophycocyanin calibration particles (ACP-30-5K). Using the MFI of IL-6–biotin bound to mbaIL6 in the transduced Jurkat cells, the average number of receptors per cell was estimated as follows: log MFI of mbaIL6, 5.27956; log molecules of equivalent APC, 4.321 by intrapolation; yielding 104.321 = 20 941 mbaIL6 receptors per cell. VH, variable heavy chain; VL, variable light chain.
Design and expression of mbaIL6. (A) Schema of the mbaIL6 construct. (B) mbaIL6 and GFP expression in Jurkat cells transduced with either GFP alone (“Control”) or GFP plus mbaIL6, labeled with biotin-conjugated goat anti-human F(ab′)2 and streptavidin-APC. (C) IL-6 binding of control or mbaIL6-transduced Jurkat cells, labeled with IL-6 biotin and streptavidin-APC. Soybean trypsin inhibitor (STI)–biotin was used as a labeling control. (D) Control or mbaIL6-transduced Jurkat cells were labeled with IL-6 biotin and streptavidin-APC; confocal images were captured with a 60× objective lens. (E) Log10 molecules of equivalent APC (MEAPC) and log10 mean fluorescence intensity (MFI) were plotted on a standard curve constructed using allophycocyanin calibration particles (ACP-30-5K). Using the MFI of IL-6–biotin bound to mbaIL6 in the transduced Jurkat cells, the average number of receptors per cell was estimated as follows: log MFI of mbaIL6, 5.27956; log molecules of equivalent APC, 4.321 by intrapolation; yielding 104.321 = 20 941 mbaIL6 receptors per cell. VH, variable heavy chain; VL, variable light chain.
mbaIL6 removes IL-6 and neutralizes its function
To determine whether Jurkat cells expressing mbaIL6 could remove IL-6 from the milieu, 2 × 10⁶/mL cells were cultured in medium containing 1 ng/mL human IL-6. After 2 hours of culture, the concentration of IL-6 recovered in the supernatant was markedly reduced, whereas residual IL-6 concentration was essentially unchanged in the supernatant of Jurkat cells transduced with GFP only (n = 3; P < .0001) (Figure 2A). IL-6 capture was time dependent, with ∼50% being removed after 30 minutes; after 120 minutes, it became undetectable. The kinetics fitted a first-order exponential decay curve (R2 = 0.9576), with an IL-6 half-life of 33.2 minutes and a rate constant K of 0.02087 (n = 3) (Figure 2B). In time-course experiments (n = 3) using saturating concentrations of IL-6 (10 ng/mL), 90% binding of mbaIL6 was reached in ∼20 minutes and 99.9% binding in 1 hour (supplemental Figure 2A).
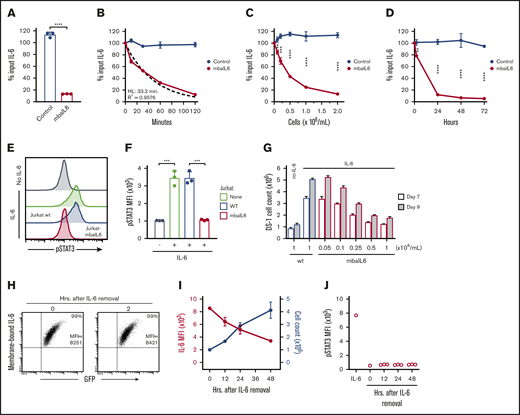
Functionality of mbaIL6. (A) Jurkat cells (2 × 10⁶/mL) transduced with either GFP alone (“Control”) or GFP plus mbaIL6 were cultured for 2 hours with 1 ng/mL human IL-6; IL-6 in the supernatant was measured by ELISA. Mean (±SD; n = 3) is shown. ****P < .0001. (B) Cultures were set up as in panel A; IL-6 levels were measured after the indicated time. The dashed curve is the fitted exponential decay curve. Mean (±SD; n = 3) is shown. (C) Cultures were set as in panel A but with various Jurkat cell concentrations; IL-6 was measured after 2 hours. Mean (±SD; n = 3) for each cell concentration is shown. **P < .01; ***P < .001; ****P < .0001. (D) Cultures were initiated with 0.1 × 10⁶ cells/mL Jurkat cells; cell numbers increased to 0.2 × 10⁶/mL after 24 hours, 0.4 × 10⁶/mL after 48 hours, and 1.0 × 10⁶/mL after 72 hours. Mean (±SD) for each time point is shown (n = 3). **P < .01; ****P < .0001. (E) Jurkat cells (2 × 10⁶/mL) nontransduced (“wt”) or transduced with mbaIL6 were cultured for 2 hours with 1 ng/mL IL-6. U937 cells were exposed to the supernatant for 15 minutes at 37°C. Representative flow cytometry histograms show labeling of U937 cells with anti-STAT3 pY705. (F) Mean (±SD; n = 3) STAT3 phosphorylation in U937 cells. ***P < .001. (G) Varying concentrations of Jurkat cells transduced with mbaIL6 were cultured with 1 ng/mL IL-6 for 2 hours. The supernatant was added to 0.2 × 10⁶ DS-1 cells, which were counted after 7 and 9 days of culture. Mean (±SD; n = 3) is shown. (H) Jurkat cells expressing mbaIL6 were cultured with IL-6 (5 ng/mL) for 2 hours; after washing, cells were cultured for another 2 hours and periodically labeled with anti–IL-6 PE. Flow cytometry dot plots show levels of IL-6 bound to mbaIL6 cells. Sequential data of 2 experiments are given in supplemental Figure 2C. (I) Jurkat cells (1 × 10⁶/mL) expressing mbaIL6 were cultured with IL-6 (5 ng/mL) for 2 hours; after washing, cells were cultured for another 48 hours and periodically labeled with anti–IL-6 PE. Graph shows mean fluorescence intensity (MFI) of IL-6 (red) plotted together with cell count (blue). Mean (±SD; n = 3) is shown. (J) Supernatant from cultures shown in panel I was added to THP-1 cells for 15 minutes at 37°C. STAT3 phosphorylation was measured as in panel E. HL, half-life.
Functionality of mbaIL6. (A) Jurkat cells (2 × 10⁶/mL) transduced with either GFP alone (“Control”) or GFP plus mbaIL6 were cultured for 2 hours with 1 ng/mL human IL-6; IL-6 in the supernatant was measured by ELISA. Mean (±SD; n = 3) is shown. ****P < .0001. (B) Cultures were set up as in panel A; IL-6 levels were measured after the indicated time. The dashed curve is the fitted exponential decay curve. Mean (±SD; n = 3) is shown. (C) Cultures were set as in panel A but with various Jurkat cell concentrations; IL-6 was measured after 2 hours. Mean (±SD; n = 3) for each cell concentration is shown. **P < .01; ***P < .001; ****P < .0001. (D) Cultures were initiated with 0.1 × 10⁶ cells/mL Jurkat cells; cell numbers increased to 0.2 × 10⁶/mL after 24 hours, 0.4 × 10⁶/mL after 48 hours, and 1.0 × 10⁶/mL after 72 hours. Mean (±SD) for each time point is shown (n = 3). **P < .01; ****P < .0001. (E) Jurkat cells (2 × 10⁶/mL) nontransduced (“wt”) or transduced with mbaIL6 were cultured for 2 hours with 1 ng/mL IL-6. U937 cells were exposed to the supernatant for 15 minutes at 37°C. Representative flow cytometry histograms show labeling of U937 cells with anti-STAT3 pY705. (F) Mean (±SD; n = 3) STAT3 phosphorylation in U937 cells. ***P < .001. (G) Varying concentrations of Jurkat cells transduced with mbaIL6 were cultured with 1 ng/mL IL-6 for 2 hours. The supernatant was added to 0.2 × 10⁶ DS-1 cells, which were counted after 7 and 9 days of culture. Mean (±SD; n = 3) is shown. (H) Jurkat cells expressing mbaIL6 were cultured with IL-6 (5 ng/mL) for 2 hours; after washing, cells were cultured for another 2 hours and periodically labeled with anti–IL-6 PE. Flow cytometry dot plots show levels of IL-6 bound to mbaIL6 cells. Sequential data of 2 experiments are given in supplemental Figure 2C. (I) Jurkat cells (1 × 10⁶/mL) expressing mbaIL6 were cultured with IL-6 (5 ng/mL) for 2 hours; after washing, cells were cultured for another 48 hours and periodically labeled with anti–IL-6 PE. Graph shows mean fluorescence intensity (MFI) of IL-6 (red) plotted together with cell count (blue). Mean (±SD; n = 3) is shown. (J) Supernatant from cultures shown in panel I was added to THP-1 cells for 15 minutes at 37°C. STAT3 phosphorylation was measured as in panel E. HL, half-life.
The degree of IL-6 removal depended on the number of cells expressing mbaIL6 present in the cultures (Figure 2C). Conceivably, cell proliferation would generate new mbaIL6 cells that would continue to neutralize IL-6 in prolonged cell cultures. To test this notion, we used previously determined culture conditions that were insufficient to completely remove IL-6 within 2 hours (ie, 0.1 × 10⁶/mL cells with 0.5-1 ng/mL IL-6) and continued the cultures for 72 hours. After 24 hours, most of the IL-6 had been removed from the supernatant and levels were further reduced in prolonged cultures (Figure 2D), while the number of mbaIL6 cells progressively increased and reached 1.0 × 10⁶/mL after 72 hours. After removing surface receptor expression by trypsin digestion, the IL-6–binding capacity of Jurkat cells dropped to <50% but steadily increased thereafter and was restored after 36 hours (supplemental Figure 2B).
To assess whether mbaIL6 neutralized IL-6 activity, we used the U937 monocytic cell line, which is stimulated by IL-625,26 and undergoes STAT3 phosphorylation upon IL-6 binding to its receptor.27 After 15 minutes with IL-6 (1 ng/mL), STAT3 phosphorylation was readily detected (Figure 2E-F). If U937 cells were exposed to IL-6–containing supernatant from 2-hour cultures with untransduced Jurkat cells, levels of STAT3 phosphorylation remained unchanged; however, when the supernatant was from cultures with mbaIL6-Jurkat cells, STAT3 phosphorylation was markedly lower (P < .001; n = 3), resembling those of unstimulated cells. As shown in Figure 2G, exposure to mbaIL6-expressing cells also diminished IL-6–driven expansion of DS-1, a B-lymphoma cell line, whose continuous growth is supported by endogenous IL-6 and is enhanced by exogenous IL-6.28
Binding of IL-6 to mbaIL6 persisted over time. After exposing Jurkat cells to saturating concentrations of IL-6 for 2 hours and then washing cells to remove unbound IL-6, IL-6 levels on the cell surface remained unchanged over 2 hours (Figure 2H; supplemental Figure 2C-D). In longer cultures, IL-6 mean fluorescence intensity decreased over time concomitantly with the increase in cell number (Figure 2I), suggesting that the decreasing mean fluorescence intensity was due to cell division. The culture supernatant could not trigger STAT3 phosphorylation in another IL-6–susceptible cell line, THP-1,29 ensuring that there was no release of membrane-bound IL-6 (Figure 2J).
Expression of mbaIL6 in peripheral blood T lymphocytes
The mbaIL6 receptor could be expressed on the surface of peripheral blood T lymphocytes (Figure 3A). In 11 transductions with T lymphocytes of 4 donors, the percentage of GFP+ cells was 61.7% ± 12.9%; as with Jurkat cells, virtually every GFP+ cell expressed mbaIL6. The receptor effectively bound IL-6 (Figure 3B). The immunophenotype of T cells expressing mbaIL6 remained essentially identical to that of T cells transduced with GFP only (Figure 3C).
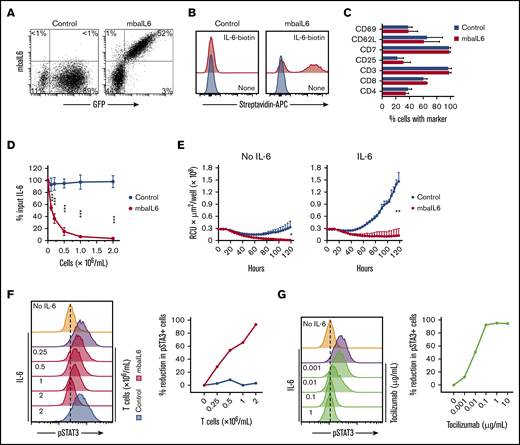
Functional consequences of IL-6 neutralization with mbaIL6-T cells. (A) mbaIL6 and GFP expression in peripheral blood T cells transduced with either GFP alone (“Control”) or GFP plus mbaIL6, after labeling with biotin-conjugated goat anti-human F(ab′)2 antibody and streptavidin-APC. (B) IL-6 binding to Control or mbaIL6-transduced peripheral blood T cells, labeled with IL-6 biotin and streptavidin-APC. (C) Cell marker profile of Control or mbaIL6-transduced T cells from 3 donors. Mean (±SD) of percent T cells expressing each marker is shown. (D) Control or mbaIL6-transduced T lymphocytes at the indicated concentrations were cultured for 2 hours with 1 ng/mL human IL-6; IL-6 in the supernatant was measured by using ELISA. Mean (±SD; n = 3) is shown. ***P < .001. (E) DS-1-mCherry cells were cocultured with Control or mbaIL6-transduced T cells at a 1:1 ratio, with IL-6 (0.5 ng/mL). DS-1 proliferation was quantitated by using the IncuCyte Live Imaging System; shown are mean (±SD) of red calibrated units (RCU) × μm2/well in triplicate measurements. *P = .02; **P < .01 for data at 120 hours. (F) Control or mbaIL6-transduced T lymphocytes at the indicated concentration were cultured for 2 hours with 1 ng/mL IL-6. THP-1 cells were then exposed to either 1 ng/mL IL-6 or to the supernatant of the lymphocyte cultures for 15 minutes at 37°C. Flow cytometry histograms show labeling of THP-1 cells with anti-STAT3 pY705; the graph on the right shows the decrease in pSTAT3 relative to that of THP-1 cells exposed for 15 minutes to 1 ng/mL IL-6. (G) THP-1 cells were exposed to IL-6 for 15 minutes, after 30-minute incubation with the indicated concentrations of tocilizumab. Cells were then labeled with anti-STAT3 pY705 and analyzed as in panel F.
Functional consequences of IL-6 neutralization with mbaIL6-T cells. (A) mbaIL6 and GFP expression in peripheral blood T cells transduced with either GFP alone (“Control”) or GFP plus mbaIL6, after labeling with biotin-conjugated goat anti-human F(ab′)2 antibody and streptavidin-APC. (B) IL-6 binding to Control or mbaIL6-transduced peripheral blood T cells, labeled with IL-6 biotin and streptavidin-APC. (C) Cell marker profile of Control or mbaIL6-transduced T cells from 3 donors. Mean (±SD) of percent T cells expressing each marker is shown. (D) Control or mbaIL6-transduced T lymphocytes at the indicated concentrations were cultured for 2 hours with 1 ng/mL human IL-6; IL-6 in the supernatant was measured by using ELISA. Mean (±SD; n = 3) is shown. ***P < .001. (E) DS-1-mCherry cells were cocultured with Control or mbaIL6-transduced T cells at a 1:1 ratio, with IL-6 (0.5 ng/mL). DS-1 proliferation was quantitated by using the IncuCyte Live Imaging System; shown are mean (±SD) of red calibrated units (RCU) × μm2/well in triplicate measurements. *P = .02; **P < .01 for data at 120 hours. (F) Control or mbaIL6-transduced T lymphocytes at the indicated concentration were cultured for 2 hours with 1 ng/mL IL-6. THP-1 cells were then exposed to either 1 ng/mL IL-6 or to the supernatant of the lymphocyte cultures for 15 minutes at 37°C. Flow cytometry histograms show labeling of THP-1 cells with anti-STAT3 pY705; the graph on the right shows the decrease in pSTAT3 relative to that of THP-1 cells exposed for 15 minutes to 1 ng/mL IL-6. (G) THP-1 cells were exposed to IL-6 for 15 minutes, after 30-minute incubation with the indicated concentrations of tocilizumab. Cells were then labeled with anti-STAT3 pY705 and analyzed as in panel F.
T cells expressing mbaIL6 removed IL-6 from the culture supernatant in a cell dose– and time-dependent manner (Figure 3D; supplemental Figure 3A-B). In the presence of mbaIL6-T cells, the growth of the IL-6–dependent cell line DS-1 was suppressed (Figure 3E), an effect that was also cell dose dependent (supplemental Figure 3C).
Finally, we determined whether mbaIL6 expression in T cells could reduce the capacity of IL-6 to stimulate macrophages. Culture supernatant containing 1 ng/mL IL-6 was mixed with different concentrations of mbaIL6 T cells or T-cell transduced with GFP only, and its capacity to stimulate STAT3 phosphorylation in THP-1 cells was tested 2 hours later. STAT3 phosphorylation was inhibited by mbaIL6 T cells in a dose-dependent manner while control cells had no effect (Figure 3F). In parallel experiments, we observed a dose-dependent inhibition of STAT3 phosphorylation in THP-1 cells by pre-incubation with the anti–IL-6 receptor antibody tocilizumab (Figure 3G), confirming that this action was entirely dependent on IL-6 stimulation.
Simultaneous expression of functional mbaIL6 and anti–CD19-41BB-CD3ζ CAR
We developed a bicistronic MSCV vector containing genes encoding mbaIL6 and an anti–CD19-41BB-CD3ζ CAR (Figure 4A).22 To specifically detect the anti-CD19 CAR, the extracellular domain of the human CD19 molecule was linked to an myc tag (CD19-myc), and cells were then stained with the CD19-myc fusion protein and an anti-myc antibody. Both mbaIL6 and the anti-CD19 CAR could be expressed at high levels in peripheral blood T cells (Figure 4B-C; supplemental Figure 4), and expression of mbaIL6 in CAR–T cells did not change their cell marker profile (Figure 4D). Likewise, the proportion of naive, effector, central memory, and effector memory cells was unaltered (Figure 4E). As with mbaIL6 alone, mbaIL6 expressed in conjunction with the CAR effectively neutralized IL-6 (Figure 4F).
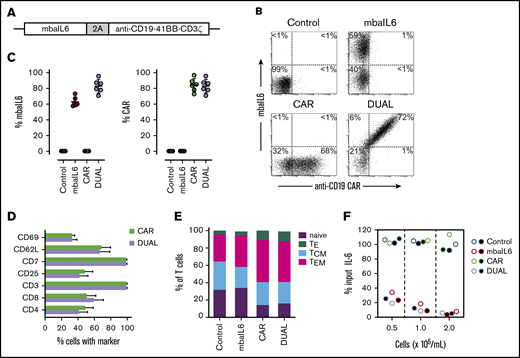
Design, expression, and IL-6–neutralizing capacity of a bicistronic construct encoding mbaIL6 and anti-CD19 CAR. (A) Schema of the plasmid encoding both receptors (“DUAL”). (B) mbaIL6 expression in peripheral blood T cells transduced with either GFP alone (“Control”), GFP plus anti-CD19 CAR, mbaIL6, or both; cells were labeled with biotin-conjugated goat anti-human F(ab′)2 antibody and streptavidin-APC, and CD19-myc followed by PE-conjugated anti-myc. Expression of each receptor in relation to GFP is shown in supplemental Figure 4. (C) Aggregate data of mbaIL6 and CAR expression from 6 transductions with T cells from 6 donors. Mean (±SD) is shown. (D) Cell marker profile of CAR or DUAL-transduced peripheral blood T cells. Mean (±SD; n = 3) percent T cells expressing each marker is shown. (E) Proportion of naive (CD45RA+ CCR7+), effector (TE, CD45RA+ CCR7‒), central memory (TCM, CD45RA‒ CCR7+), and effector memory (TEM, CD45RA‒ CCR7‒) phenotypes among T cells transduced with the various constructs (mean of 3 experiments). (F) T lymphocytes transduced as in panels B and C were cultured with 1 ng/mL IL-6. After 2 hours, IL-6 levels in the supernatant were measured by using ELISA. Symbols indicate results of 2 independent experiments.
Design, expression, and IL-6–neutralizing capacity of a bicistronic construct encoding mbaIL6 and anti-CD19 CAR. (A) Schema of the plasmid encoding both receptors (“DUAL”). (B) mbaIL6 expression in peripheral blood T cells transduced with either GFP alone (“Control”), GFP plus anti-CD19 CAR, mbaIL6, or both; cells were labeled with biotin-conjugated goat anti-human F(ab′)2 antibody and streptavidin-APC, and CD19-myc followed by PE-conjugated anti-myc. Expression of each receptor in relation to GFP is shown in supplemental Figure 4. (C) Aggregate data of mbaIL6 and CAR expression from 6 transductions with T cells from 6 donors. Mean (±SD) is shown. (D) Cell marker profile of CAR or DUAL-transduced peripheral blood T cells. Mean (±SD; n = 3) percent T cells expressing each marker is shown. (E) Proportion of naive (CD45RA+ CCR7+), effector (TE, CD45RA+ CCR7‒), central memory (TCM, CD45RA‒ CCR7+), and effector memory (TEM, CD45RA‒ CCR7‒) phenotypes among T cells transduced with the various constructs (mean of 3 experiments). (F) T lymphocytes transduced as in panels B and C were cultured with 1 ng/mL IL-6. After 2 hours, IL-6 levels in the supernatant were measured by using ELISA. Symbols indicate results of 2 independent experiments.
We determined whether IL-6 neutralization by mbaIL6 would affect T-cell functions activated by the CAR. Production of interferon-γ (IFN-γ) after coculture with CD19+ target cells was high in CAR–T cells, regardless of whether mbaIL6 was expressed (Figure 5A). Likewise, CAR-expressing cells released similar levels of cytotoxic granules, as evidenced by staining with the anti-CD107a antibody, irrespective of mbaIL6 expression (Figure 5B). In line with these results, percent cytotoxicity against CD19+ target cells driven by the CAR remained unchanged by the presence of mbaIL6, even if the receptor was saturated with IL-6 (Figure 5C-D).

Expression of mbaIL6 does not affect anti-CD19 CAR function. (A) IFN-γ production in T cells cocultured with CD19+ OP-1 ALL cells for 6 hours at 1:1, measured by flow cytometry after labeling with anti-human IFN-γ–PE. Symbols are triplicate measurements with T cells from 3 donors. CAR expression was 73% to 85% for CAR alone and 71% to 80% for CAR plus mbaIL6 (“DUAL”). (B) CD107a expression in T cells cocultured with OP-1 for 4 hours at 1:1, measured by flow cytometry after labeling with anti-human CD107a-PE. (C) T-cell cytotoxicity against OP-1 after 4 hours at 1:1. (D) T cells were cultured for 30 minutes with 5 ng/mL IL-6 before coculture with Daudi-luciferase cells at 2:1 or 1:1. Bars show mean (±SD) cytotoxicity in triplicate measurements. (E) T-cell proliferation in cultures with or without OP-1 for 21 days at 1:1, with 120 IU/mL IL-2. Irradiated OP-1 cells were added on days 0, 7, and 14. Symbols are percentage of cells recovered after culture compared with the number of cells at the beginning of the culture and are the mean (±SD) of triplicate measurements with cells from 3 donors. (F) PD1, TIM3, and LAG3 expression in T cells cocultured with irradiated OP-1 for 7 days at 1:1 with 10 IU/mL IL-2. Data were plotted with Python 3 using Matplotlib package (https://matplotlib.org/). The profile of unstimulated cells is shown in supplemental Figure 5.
Expression of mbaIL6 does not affect anti-CD19 CAR function. (A) IFN-γ production in T cells cocultured with CD19+ OP-1 ALL cells for 6 hours at 1:1, measured by flow cytometry after labeling with anti-human IFN-γ–PE. Symbols are triplicate measurements with T cells from 3 donors. CAR expression was 73% to 85% for CAR alone and 71% to 80% for CAR plus mbaIL6 (“DUAL”). (B) CD107a expression in T cells cocultured with OP-1 for 4 hours at 1:1, measured by flow cytometry after labeling with anti-human CD107a-PE. (C) T-cell cytotoxicity against OP-1 after 4 hours at 1:1. (D) T cells were cultured for 30 minutes with 5 ng/mL IL-6 before coculture with Daudi-luciferase cells at 2:1 or 1:1. Bars show mean (±SD) cytotoxicity in triplicate measurements. (E) T-cell proliferation in cultures with or without OP-1 for 21 days at 1:1, with 120 IU/mL IL-2. Irradiated OP-1 cells were added on days 0, 7, and 14. Symbols are percentage of cells recovered after culture compared with the number of cells at the beginning of the culture and are the mean (±SD) of triplicate measurements with cells from 3 donors. (F) PD1, TIM3, and LAG3 expression in T cells cocultured with irradiated OP-1 for 7 days at 1:1 with 10 IU/mL IL-2. Data were plotted with Python 3 using Matplotlib package (https://matplotlib.org/). The profile of unstimulated cells is shown in supplemental Figure 5.
Anti-CD19 CAR–T cells proliferated for 3 weeks in the presence of CD19+ target cells, and the rate of proliferation was similar in cells with and without mbaIL6 (Figure 5E). We determined whether mbaIL6 would alter expression of markers associated with T-cell activation and exhaustion in T lymphocytes stimulated by the CAR.30 To this end, CAR–T cells were cultured with CD19+ ALL cells for 7 days, and expression of PD1, TIM3, and LAG3 was compared to that of lymphocytes expressing both receptors or GFP only. As expected, the proportion of cells expressing all 3 markers increased with CAR-driven proliferation, but the percentage of cells expressing these markers was similar with or without mbaIL6 (Figure 5F; supplemental Figure 5).
T cells expressing mbaIL6 and CAR can kill target cells while neutralizing IL-6 derived from macrophages
IL-6 secreted by activated macrophages is a major contributor to the pathogenesis of CRS.4,14-16 To mimic the interaction between CAR–T cells and macrophages, CAR–T cells were cocultured with the monocyte cell line THP-1, which secretes IL-6 when stimulated with tumor necrosis factor-α (TNF-α) and IFN-γ,31 which are secreted by T-lymphocytes upon activation.15,32 Expression of mbaIL6 did not affect the capacity of CAR–T cells to exert cytotoxicity against CD19+ leukemic cells in prolonged cultures with either untreated THP-1 cells or THP-1 cells induced to differentiate by exposure to phorbol 12-myristate 13-acetate (20 ng/mL) for 3 days (Figure 6A; supplemental Figure 6A). The interaction of CAR–T cells with target cells in the presence of THP-1 resulted in a sharp increase in IL-6 levels, although these remained at baseline levels if CAR–T cells also expressed mbaIL6 (P < .01 in all comparisons) (Figure 6B; supplemental Figure 6B).
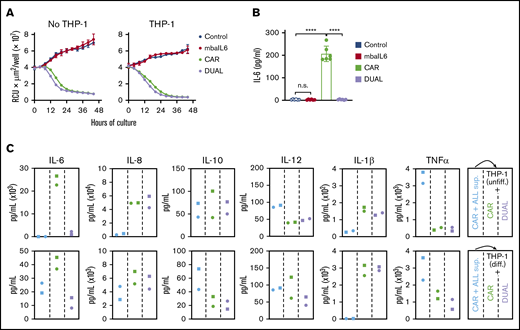
Function of T cells expressing mbaIL6 and anti-CD19 CAR cocultured with a monocytic cell line. (A) Cytotoxicity of T cells against OP-1-mCherry cells, with or without undifferentiated THP-1 cells (1:5:1 T-cell:OP-1:THP-1 ratio). OP-1 growth was quantitated by using the IncuCyte Live Imaging System; results are expressed as mean (±SD) of red calibrated units (RCU) × μm2/well in triplicate measurements. (B) IL-6 levels in the supernatant of the cultures shown in panel A after 48 hours, measured by using ELISA. CAR expression was 84% to 97% for CAR alone and 86% to 96% for CAR plus mbaIL6 (“DUAL”). Mean (±SD) of 3 measurements each with T cells from 2 donors. Not significant (n.s.), P > .05; ****P < .0001. (C) Supernatant from CAR-T/OP-1 48-hour cocultures was added to T cells mixed at 1:1 with either undifferentiated or differentiated THP-1 cells (supplemental Figure 6D). Cytokine levels were measured after an additional 72 hours of culture. Results with T cells transduced with GFP only or mbaIL6 are shown in supplemental Figure 6E.
Function of T cells expressing mbaIL6 and anti-CD19 CAR cocultured with a monocytic cell line. (A) Cytotoxicity of T cells against OP-1-mCherry cells, with or without undifferentiated THP-1 cells (1:5:1 T-cell:OP-1:THP-1 ratio). OP-1 growth was quantitated by using the IncuCyte Live Imaging System; results are expressed as mean (±SD) of red calibrated units (RCU) × μm2/well in triplicate measurements. (B) IL-6 levels in the supernatant of the cultures shown in panel A after 48 hours, measured by using ELISA. CAR expression was 84% to 97% for CAR alone and 86% to 96% for CAR plus mbaIL6 (“DUAL”). Mean (±SD) of 3 measurements each with T cells from 2 donors. Not significant (n.s.), P > .05; ****P < .0001. (C) Supernatant from CAR-T/OP-1 48-hour cocultures was added to T cells mixed at 1:1 with either undifferentiated or differentiated THP-1 cells (supplemental Figure 6D). Cytokine levels were measured after an additional 72 hours of culture. Results with T cells transduced with GFP only or mbaIL6 are shown in supplemental Figure 6E.
Levels of the inflammatory cytokines IL-1β, IL-8, IL-10, and TNF-α increased in the supernatant collected from 48-hour cultures of CAR–T cells with CD19+ ALL cells regardless of mbaIL6 expression (supplemental Figure 6C). We collected the supernatant from the cultures containing CAR–T cells and target cells, added it to THP-1 and T cell cocultures, and tested cytokine levels after an additional 72 hours (supplemental Figure 6D). T cells expressing mbaIL6, with or without CAR, specifically decreased IL-6 levels (Figure 6C; supplemental Figure 6E). Hence, mbaIL6 can neutralize IL-6 secreted by macrophages in response to stimulation by CAR-activated lymphocytes.
CAR–T cells expressing mbaIL6 quench IL-6 and exert antileukemia effects in xenograft models
To determine the in vivo tumor killing capacity of T cells expressing mbaIL6 and anti-CD19 CAR, we injected the CD19+ ALL cell line Nalm-6 IV in NOD/scid-IL2RGnull mice, followed by injection of CAR–T cells with or without mbaIL6. Both types of T cells had considerable antileukemia activity (Figure 7A-B; supplemental Figure 7) and could still be detected in peripheral blood 50 days after injection (Figure 7C). After 100 days of follow-up, none of the mice treated with either CAR–T cells or cells expressing both CAR and mbaIL6 showed evidence of leukemia relapse (Figure 7D).
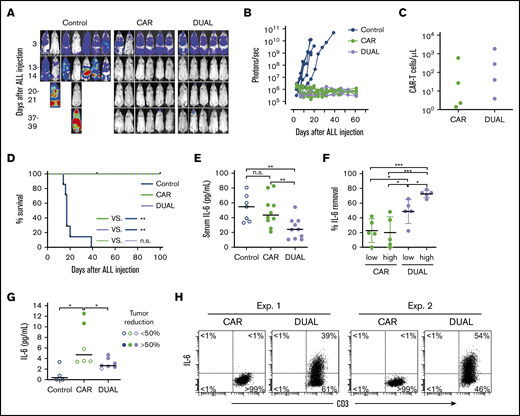
CAR–T cells expressing mbaIL6 quench IL-6 and exert antileukemia activity in xenograft models. (A) NOD/scid-IL2RGnull mice were injected IV with 0.5 to 1 × 10⁶ Nalm-6-luciferase cells. On day 3, mice were given T cells expressing either anti-CD19 CAR alone (85% CAR expression) or mbaIL6 plus CAR (“DUAL”; 79% CAR expression) (20 × 106/mouse IV); all mice received 20 000 IU IL-2 IP every 2 days. Ventral images from the Xenogen IVIS-200 system after D-luciferin injection are shown (captured with enhanced sensitivity on day 3 to visualize Nalm-6 engraftment; full set of ventral and dorsal images is shown in supplemental Figure 7). (B) Luminescence measurements (photons per second) in the mice. Each point corresponds to a measurement in 1 mouse. (C) Levels of GFP+ CD3+ CAR–T cells in blood 50 days after CAR–T cell injection in a subset of the mice. (D) Kaplan-Meier curves of overall survival for the mice shown in panel A, euthanized when the total bioluminescence signal reached 1 × 10¹⁰ photons/second. **P < .01 by log-rank test. (E) T cells expressing either anti–CD19 CAR or anti–CD19 CAR plus mbaIL6 were injected IV in NOD/scid-IL2RGnull mice (2-10 × 106/mouse); 3 days later, 50 ng of human IL-6 was injected IP. After 2 hours, mice were euthanized, and serum was collected by cardiac puncture to measure levels of human IL-6 by using ELISA. Each symbol corresponds to data from 1 mouse; bars show mean (±SD). **P < .01. (F) Mice from the experiments shown in panel E were divided according to the number of T cells that were administered: 2 to 4 × 10⁶ (“low”) and 5 to 10 × 106 (“high”). Values correspond to the percentage of IL-6 that was removed from serum in each mouse, using as a reference the mean value of IL-6 measured in mice that received IL-6 with no prior injection of T cells. *P = .035 for CAR low vs DUAL low, P = .045 from CAR high vs, DUAL low, P = .013 for DUAL low vs DUAL high; ***P < .001. (G) Daudi-luciferase cells were injected IP in NOD/scid-IL2RGnull mice (20 × 106/mouse), followed 3 days later by THP-1 and/or T cells IP (20 × 106 for both cell types). Tumor engraftment was measured by in vivo imaging (supplemental Figure 8). Mice were euthanized 48 hours after THP-1 and/or T-cell injection. Symbols show IL-6 levels measured by using ELISA in peritoneal lavage, according to percentage of tumor reduction. *P = .032 for CAR vs no T cells; P = .046 for CAR vs DUAL. (H) IL-6 binding to T cells from the peritoneal lavage of 4 mice, 2 injected with CAR–T cells and 2 injected with T cells expressing both CAR and mbaIL6. Cells were stained with anti-mouse CD45-PE-Cy7, anti-human CD45-PerCP, anti-human CD3-APC, and anti-human IL-6-PE; the plots show selectively gated mouse CD45–, human CD45+, and human CD3+ cells.
CAR–T cells expressing mbaIL6 quench IL-6 and exert antileukemia activity in xenograft models. (A) NOD/scid-IL2RGnull mice were injected IV with 0.5 to 1 × 10⁶ Nalm-6-luciferase cells. On day 3, mice were given T cells expressing either anti-CD19 CAR alone (85% CAR expression) or mbaIL6 plus CAR (“DUAL”; 79% CAR expression) (20 × 106/mouse IV); all mice received 20 000 IU IL-2 IP every 2 days. Ventral images from the Xenogen IVIS-200 system after D-luciferin injection are shown (captured with enhanced sensitivity on day 3 to visualize Nalm-6 engraftment; full set of ventral and dorsal images is shown in supplemental Figure 7). (B) Luminescence measurements (photons per second) in the mice. Each point corresponds to a measurement in 1 mouse. (C) Levels of GFP+ CD3+ CAR–T cells in blood 50 days after CAR–T cell injection in a subset of the mice. (D) Kaplan-Meier curves of overall survival for the mice shown in panel A, euthanized when the total bioluminescence signal reached 1 × 10¹⁰ photons/second. **P < .01 by log-rank test. (E) T cells expressing either anti–CD19 CAR or anti–CD19 CAR plus mbaIL6 were injected IV in NOD/scid-IL2RGnull mice (2-10 × 106/mouse); 3 days later, 50 ng of human IL-6 was injected IP. After 2 hours, mice were euthanized, and serum was collected by cardiac puncture to measure levels of human IL-6 by using ELISA. Each symbol corresponds to data from 1 mouse; bars show mean (±SD). **P < .01. (F) Mice from the experiments shown in panel E were divided according to the number of T cells that were administered: 2 to 4 × 10⁶ (“low”) and 5 to 10 × 106 (“high”). Values correspond to the percentage of IL-6 that was removed from serum in each mouse, using as a reference the mean value of IL-6 measured in mice that received IL-6 with no prior injection of T cells. *P = .035 for CAR low vs DUAL low, P = .045 from CAR high vs, DUAL low, P = .013 for DUAL low vs DUAL high; ***P < .001. (G) Daudi-luciferase cells were injected IP in NOD/scid-IL2RGnull mice (20 × 106/mouse), followed 3 days later by THP-1 and/or T cells IP (20 × 106 for both cell types). Tumor engraftment was measured by in vivo imaging (supplemental Figure 8). Mice were euthanized 48 hours after THP-1 and/or T-cell injection. Symbols show IL-6 levels measured by using ELISA in peritoneal lavage, according to percentage of tumor reduction. *P = .032 for CAR vs no T cells; P = .046 for CAR vs DUAL. (H) IL-6 binding to T cells from the peritoneal lavage of 4 mice, 2 injected with CAR–T cells and 2 injected with T cells expressing both CAR and mbaIL6. Cells were stained with anti-mouse CD45-PE-Cy7, anti-human CD45-PerCP, anti-human CD3-APC, and anti-human IL-6-PE; the plots show selectively gated mouse CD45–, human CD45+, and human CD3+ cells.
We next assessed whether mbaIL6 could reduce levels of human IL-6 in vivo. To this end, we injected IV 2 to 10 × 106 CAR–T cells with or without mbaIL6 into NOD/scid-IL2RGnull mice, followed by IP injection of human IL-6 (50 ng) 3 days later. Mice that received CAR–T cells with mbaIL6 had significantly lower IL-6 levels in the serum compared with those injected with T cells expressing CAR alone (Figure 7E-F). Importantly, percentage and absolute number of human T cells in mouse blood were not significantly different between the 2 groups: percent CD3+/human CD45+ cells among all (human plus mouse) CD45+ cells was 0.43% ± 0.40% (n = 10) in the mbaIL6-CAR group and 0.47% ± 0.51% (n = 10) in the CAR only group (P = .84); absolute numbers were 6.9 ± 4.4 vs 6.6 ± 5.9 cells/μL, respectively (P = .89).
Finally, we tested whether CAR–T cells expressing mbaIL6 could reduce levels of human monocyte-derived IL-6 in vivo. To this end, we developed a model in which NOD/scid-IL2RGnull mice were first injected IP with the CD19+ non-Hodgkin lymphoma cell line Daudi. Three days later, mice were injected IP with T cells and the monocytic cell line THP-1; after another 2 days, mice were imaged and euthanized. Despite only 3 days of activity, CAR–T cells and those with both receptors exhibited an antitumor effect, although this finding was variable (supplemental Figure 8). We performed a peritoneal lavage and measured levels of IL-6. As shown in Figure 7G, IL-6 levels in the lavage of mice that received CAR–T cells were markedly higher than in mice that did not, and these were related to the degree of tumor reduction. Mice that received T cells transduced with both CAR and mbaIL6, however, had significantly lower IL-6 levels compared with mice that received CAR–T cells, even when tumor reduction was >50%. Finally, staining of cells harvested from the lavage showed that T cells expressing both CAR and mbaIL6 had bound IL-6 (Figure 7H).
Discussion
For patients with B-lymphoid malignancies and multiple myeloma refractory to chemotherapy, CAR–T cells represent a potentially curative intervention.3-13 The intervention can, however, trigger CRS, a potentially life-threatening complication that can also significantly increase the costs related to CAR–T cell infusion.14-17 The current study developed an approach to equip CAR–T cells with the capacity to reduce levels of IL-6 in their microenvironment. We found that an anti–IL-6 receptor (mbaIL6) expressed on the surface of T cells could rapidly and drastically decrease levels of IL-6. IL-6 removal was proportional to the number of cells expressing mbaIL6 and, hence, increased with T-cell proliferation. Transduction of T lymphocytes with a construct that allows simultaneous expression of mbaIL6 and CAR triggered powerful T-cell antitumor activity. Importantly, CAR–T cell proliferation driven by CAR engagement was not prevented by IL-6 neutralization, and these cells exerted antitumor activity in xenograft models which was as effective as that of CAR–T cells without anti–IL-6 activity. These results indicate that CAR–T cells with onboard IL-6 quenching capacity should provide the level of antitumor activity associated with CAR–T cells while containing the development of CRS.
T cells expressing mbaIL6 suppressed IL-6 activity. Thus, IL-6–driven signal transduction in monocytes was prevented, and growth of the IL-6–dependent cell line DS-1 decreased. Moreover, IL-6 secretion from macrophages triggered by CAR–T cells in vitro and in an in vivo model of CRS was significantly reduced. One advantage of mbaIL6-CAR–T cells is that they are active immediately after CAR–T cell infusion and anti–IL-6 capacity is proportional to CAR–T cell expansion. Although peak levels of serum IL-6 after CAR–T cells are typically <200 pg/mL, they can exceed 1000 pg/mL in patients with grade 4 CRS.6,11,33 The number of CAR–T cells in peripheral blood, which represents only a fraction of total CAR–T cells expanding in vivo, has been measured to reach levels between 0.1 to 1 × 10⁶/mL.6,33,34 We found that 0.1 × 10⁶ T cells expressing mbaIL6 could clear 1000 pg of IL-6 in 24 hours and that clearance further increased with T-cell proliferation. Therefore, the number of CAR–T cells equipped with mbaIL6 expanding in vivo should have the capacity to maintain levels of IL-6 below those associated with severe CRS. Patients who neurotoxicity associated with CAR–T cells have high levels of IL-6 in the cerebrospinal fluid (CSF).19,35 Preemptive administration of tocilizumab has been shown to reduce the occurrence of severe CRS.36 However, it did not abrogate it, and it is generally ineffective for CAR–T cell–driven neurotoxicity, another serious side effect of CAR–T cell therapy.37 To this end, experiments in rhesus macaques has suggested that intraventricular tocilizumab administration could be more effective.38 Because CAR–T cells are clearly detectable in the CSF,34 another potential feature of mbaIL6 is the capacity to lower CSF IL-6 levels.
Simultaneous expression of CAR and mbaIL6 can be effectively accomplished with a bicistronic vector. Therefore, it would fit seamlessly into current protocols for clinical-grade CAR–T cell production, without additional vectors or gene-editing procedures. Other approaches recently reported to potentially reduce CRS include diminishing the affinity of the CAR39 or its signaling potency.40 Although initial clinical data suggest that antitumor activity is not affected by these modifications, larger studies would be required to ensure that efficacy is not impaired. Simultaneous expression of both mbaIL6 and CAR genes could lower CAR expression, and the CD8α hinge, shared by both receptors, could lead to mbaIL6 dimerizing with the CAR and hindering its function. These theoretical concerns, however, are dispelled by the results of our study, which clearly indicate that when the CAR is simultaneously expressed with mbaIL6 it retains its full functionality; mbaIL6/CAR–T cells expanded and targeted tumor cells in vitro and in vivo as well as their counterparts lacking mbaIL6. Another possible drawback is that adding mbaIL6 might increase the risk of immunogenicity of the genetically modified cells, leading to their premature rejection. However, we believe that this scenario is unlikely as all components of mbaIL6 are of human origin, and the scFv portion of the receptor was developed from a fully human anti-IL6 antibody. Because CAR–T cells can have long persistence and IL-6 has been associated with multiple cell functions in diverse organ systems,41 it is possible that long-term IL-6 downregulation by mbaIL6 may lead to adverse clinical manifestations. To this end, 2 patients with inborn loss of IL-6 receptor function were recently described.42 The patients (15 and 29 years of age) had atopic dermatitis, elevated IgE levels, reduced inflammatory responses, and recurrent skin and lung infections but no defective acute-phase response. Considering that expression of mbaIL6 is unlikely to produce a complete loss of IL-6 signaling, we believe that these risks are outweighed by the potential benefits of reducing CRS. Nevertheless, it would be desirable to develop an inducible receptor that can be downregulated after the post–CAR–T cell infusion phase when CRS is most likely.
The data that have emerged from clinical trials of CAR–T cell therapies are compelling,3-13 and it is likely that the indication for this treatment will be progressively widened to patients with less advanced disease than those who are currently enrolled. Consequently, the risks associated with the procedure will have an increasing weight in treatment decisions. The approach described in this study maintains CAR–T cell antitumor activity while quenching IL-6, a key determinant of CRS and neurotoxicity. Although the involvement of IL-6 in these adverse effects is clear, other cytokines have also been implicated. In mouse models, for example, blockade of monocyte-derived IL-1 is more effective than IL-6 suppression to alleviate neurotoxicity.43,44 Using a strategy similar to the one described for IL-6, other inflammatory cytokines could also be neutralized by onboard receptors in CAR–T cells. Although our study used CRS associated with CAR–T cells to determine the effectiveness of cellular IL-6 inhibition, IL-6 is involved in the pathogenesis of multiple autoimmune diseases,41,45,46 including graft-versus-host disease.47-49 The role of T cells genetically modified with inhibitory receptors against IL-6 and other proinflammatory cytokines in reducing their severity warrants further exploration.
All data requests should be submitted to the corresponding author (Dario Campana; e-mail: paedc@nus.edu.sg).
Acknowledgments
The authors thank Yi Tian Png and Desmond Wong from the National University of Singapore laboratory for advice and assistance; Guo Hui of the Flow Cytometry Laboratory, Immunology Program, National University of Singapore, for help with cell sorting; and Lee Shu Ying of the Confocal Microscopy Unit, National University of Singapore, for help with microscopy.
This work was supported by grant NMRC/STaR/0025/2015a from the National Medical Research Council of Singapore.
Authorship
Contribution: A.H.J.T. developed the mbaIL6 receptor, performed experiments, and analyzed data; N.V. performed experiments and analyzed data; and D.C. designed the study, analyzed data, and wrote the manuscript with A.H.J.T. and N.V.
Conflict-of-interest disclosure: A.H.J.T. and D.C. are coinventors in a patent application describing the technologies used. D.C. is scientific founder, stockholder, and consultant of Unum Therapeutics, Nkarta Therapeutics, and MediSix Therapeutics. N.V. declares no competing financial interests.
Correspondence: Dario Campana, Department of Pediatrics, Yong Loo Lin School of Medicine, National University of Singapore, Centre for Translational Medicine, 14 Medical Dr, Level 9 South, Singapore 117599; e-mail: paedc@nus.edu.sg.

