

Key Points
Pediatric PEL is rare and associated with poor overall survival.
NUP98 fusions are increased in acute erythroid leukemias, especially those with PELs, per the 2008 World Health Organization classification.

Abstract
Acute erythroid leukemia (AEL) is a rare subtype of acute myeloid leukemia (AML) primarily affecting older adults and was previously classified into erythroid/myeloid and pure erythroid subtypes. In this pediatric AEL study, we evaluated morphologic, immunophenotypic, cytogenetic, molecular, and clinical data of 24 (1.2%) cases from all cases undergoing central pathology review in Children’s Oncology Group trials AAML0531 and AAML1031. Of 24 cases, 5 had a pure erythroid phenotype, and 19 had an erythroid/myeloid phenotype. NUP98 fusions were highly enriched in patients with AEL, occurring in 7 of 22 cases for which molecular data were available (31.8% vs 6.7% in other AML subtypes). Of 5 cases of pure erythroid leukemias (PELs), 3 had NUP98 fusions, and 4 had complex karyotypes. Erythroid/myeloid leukemias were reclassified by using the 2017 World Health Organization hematopathology classification as: myelodysplastic syndrome (MDS) with excess blasts-1 (n = 3), MDS with excess blasts-2 (n = 7), AML (nonerythroid, n = 5), and unknown MDS/AML (n = 4); the 5 cases of nonerythroid AML included 1 with an NUP98–NSD1 fusion, 2 with myelodysplasia-related changes, and 1 with a complex karyotype. Three cases of MDS with excess blasts-2 also had NUP98 rearrangements. WT1 mutations were present in 5 of 14 cases, all erythroid/myeloid leukemia. Outcomes assessment revealed statistically poorer overall survival (5-year, 20% ± 36% vs 66% ± 23%; P = .004) and event-free survival (5-year, 20% ± 36% vs 46% ± 23%; P = .019) for those with PEL than those with erythroid/myeloid leukemia. Our study supports that AEL is a morphologically and genetically heterogeneous entity that is enriched in NUP98 fusions, with the pure erythroid subtype associated with particularly adverse outcomes.
Introduction
Acute myeloid leukemia (AML) has an incidence of 8.8 per 1 million children aged 0 to 19 years,1 with acute erythroid leukemia (AEL) being the rarest AML subtype. Historically, AEL has been classified into 2 subtypes: (1) pure erythroid leukemia (PEL), defined as a bone marrow with >80% immature (undifferentiated or pro-normoblastic) erythroid cells and lacking 20% myeloblasts (also previously classified as French–American–British [FAB]) M6b); and (2) erythroid/myeloid leukemia, defined as a bone marrow with >50% erythroid cells and myeloblasts accounting for >20% of all nonerythroid cells (also previously classified as FAB M6a).2-4 This classification is confusing, and some authors have questioned whether cases of acute erythroid/myeloid leukemia with <20% myeloblasts of all cells should be classified as myelodysplastic syndrome (MDS) with excess blasts.5-9 The most recently revised 2017 World Health Organization (WHO) classification eliminated the erythroid/myeloid leukemia subtype; currently, only the PEL subtype remains, defined as >80% immature erythroid precursors, of which ≥30% are proethryoblasts.10
Even before the erythroid/myeloid subtype was eliminated, AEL (AML-M6) accounted for <5% of cases of AML and was the most uncommon AML FAB type in both children and adults (3%-5%).11,12 In the Children’s Cancer Group (CCG) AML clinical trial CCG-2891, cases of AML-M6 represented 2.2% of all de novo MDS and AML.11 A slight male predominance has been noted.11,13 AML-M6 patients also have a worse prognosis, with lower overall survival (OS) and event-free survival (EFS) than FAB M0-M5 patients.11 The reason for this poor prognosis remains to be identified and potentially includes the actual pathologic diagnosis, karyotype, and/or the molecular genotype.
In the current study, we report the morphologic, immunohistochemical, cytogenetic, and molecular features of non–Down syndrome AEL in patients enrolled in the Children’s Oncology Group (COG) trials AAML0531 and AAML1031 with the goal of determining if any of these factors affect prognosis.
Methods
Patients
AAML0531 was a COG phase 3 trial that administered intensive chemotherapy to children, adolescents, and young adults with newly diagnosed AML. Participants were randomized to receive or not receive gemtuzumab ozogamicin (Mylotarg; Pfizer Inc, New York, NY) during the first cycle (for all patients) and the fourth cycle (for those who did not undergo hematopoietic stem cell transplantation).14 Details of the treatment regimen have been previously reported. The trial included 1022 eligible patients (age range, 1 month to 29.99 years) with de novo AML enrolled between August 2006 and June 2010 from participating COG institutions (n = 181). Eleven of the included patients from this trial analyzed herein were also included in the analysis of acute erythroleukemia by Iacobucci et al.15 AAML1031 was also a COG phase 3 randomized trial comparing standard chemotherapy with or without bortezomib in individuals with de novo AML and without Down syndrome. In addition, sorafenib was given to consenting participants with a high FLT3 internal tandem duplication (ITD) allelic ratio (>0.4).16 This trial increased risk stratification based on minimal residual disease, FLT3 ITD allelic ratio, NPM1 mutations, and CEBPα mutations to identify patients who would benefit from hematopoietic stem cell transplantation. The trial included 1231 eligible patients with de novo AML (age range, 1 month-29.99 years) enrolled between June 2011 and July 2017 from participating COG institutions (n = 193). Because there were no statistically significant differences in OS or EFS between these studies, we combined all of the patients with AEL.
These studies were approved by the National Cancer Institute’s central Institutional Review Board, and the institutional review boards of all participating institutions. All patients or their parents gave written informed consent or assent, according to institutional regulations. Patients’ age at diagnosis and their sex were recorded.
Morphologic assessment
All cases with an institutional diagnosis of AEL were identified from the AAML0531 and AAML1031 databases. Blood smears, bone marrow aspirate, bone marrow core biopsies, flow cytometry reports, and immunohistochemistry reports underwent central pathology review to confirm diagnosis. Slides were re-reviewed for the presence of multilineage dysplasia. Central pathology review was performed on 864 (84.5%) of all cases in AAML0531 and 1070 (86.9%) of all cases in AAML1031. Patients were excluded if material was not available or insufficient for central pathology review. Because AAML0531 and AAML1031 were conducted when the 2001 WHO and 2008 WHO classifications of hematopoietic tumors, respectively, were used,4,17 AEL included PEL and erythroid/myeloid leukemia subtypes. Cases included were morphologically AEL even if multilineage dysplasia and/or an 11q23 genetic abnormality were present.
AML reclassification
Included cases were reclassified by using the 2017 WHO definitions of AML, not otherwise specified (NOS), AML with recurrent genetic abnormalities, and AML with myelodysplasia-related changes (AML-MRC).10,18,19 Accordingly, as the erythroid/myeloid subtype of AEL has been eliminated, these cases were reclassified as AML or MDS with excess blasts 1 or 2 (EB-1 or EB-2).20
Cytogenetic and molecular assessments
Results of cytogenetic analyses for both studies were centrally reviewed and recorded by using the International System of Human Cytogenetic Nomenclature. The number and types of cytogenetic abnormalities were noted, including the presence or absence of inv(16)/t(16;16), t(8;21), and 11q23/KMT2A abnormalities. Screening for FLT3 ITD and other mutations in FLT3, NPM1, CEBPα, and WT1 were performed as previously described.21-24 Fusion transcripts were detected by RNA-sequencing (RNA-seq) with fusion detection algorithms STAR-Fusion v1.1.0 and TransABySS v1.4.10. RNA-seq was completed for total RNA from primary patient samples purified by using the AllPrep DNA/RNA/miRNA Universal Kit (#80224; Qiagen, Valencia, CA), using the QIAcube system. The messenger RNA libraries were prepared for 75 bp strand-specific, paired-end sequencing by using the ribodepletion 2.0 protocol by the British Columbia Genome Sciences Centre (Vancouver, BC, Canada). STAR-Fusion was run by using default parameters with the premade GRCh37 resource library with Gencode v19 annotations (https://data.broadinstitute.org/Trinity/CTAT_RESOURCE_LIB/).25 TransABySS parameters were set to retain fusions with breakpoint reads ≥1, flanking pairs ≥2 counts, and spanning reads ≥2 counts.26 Transcriptomic data are available through the dbGaP TARGET: Acute Myeloid Leukemia study (accession, phs000465.v19.p8).27
Outcomes assessment
Data from AAML0531 and AAML1031 were current as of 31 March 2019. Variables included morphologic classifications, presence or absence of multilineage dysplasia, complex karyotypes, identified genetic mutations, and identified fusions. The Kaplan-Meier method28 was used to estimate OS (defined as time from study entry to death) and EFS (time from study entry until failure to achieve complete remission [CR] during induction, relapse, or death). Relapse risk (RR) was calculated by cumulative incidence methods and defined as time from the end of induction I for patients in CR to relapse or death, in which deaths without a relapse were considered competing events.29 Patients who withdrew from therapy due to relapse, persistent central nervous system disease, or refractory disease with ≥20% bone marrow blasts by the end of induction I were categorized as induction I failures.
Statistical analyses
Statistical analyses were performed on the following variables: ages at diagnosis, morphologic classifications, presence or absence of multilineage dysplasia, certain karyotypic abnormalities [specifically inv(16)/t(16;16), t(8;21), 11q23/KMT2A abnormalities, and complex karyotypes], identified genetic mutations, and identified fusions. Given the small size of some of these subgroups and because the comparisons are ad hoc analyses, the study was more exploratory in nature. The χ2 test was used to test the significance of observed differences in proportions, and Fisher’s exact test was used when data were sparse. The Student t test was used to compare means and distributions of 2 groups. The significance of predictor variables was tested with the log-rank statistic for OS and EFS and with Gray’s statistic for RR. All estimates are reported with 2 times the Greenwood standard errors. Children lost to follow-up were censored at their date of last known contact. Testing the interaction of the comparison variable with the log of the survival time indicated that the proportional hazards assumption was not violated for any of the comparisons. A value of P < .05 was considered statistically significant.
Results
Leukemia morphologic and immunophenotypic classifications
For the 2 COG trials, 24 (1.2%) of 1934 cases that underwent central pathology review were confirmed as AEL (PEL or acute erythroid/myeloid leukemia). According to morphology and immunophenotype, there were 5 cases of PEL and 19 of erythroid/myeloid leukemia. As depicted in Table 1, at least one erythroid antigen (CD71, glycophorin A, CD36, PAS, and E-cadherin) was present in each case. Myeloid markers such as myeloperoxidase, CD13, CD33, CD34, CD117, and HLA-DR were more often expressed in the erythroid/myeloid subtype than in the pure erythroid subtype. Similar to other AML, aberrantly expressed antigens included CD4 and CD7. Rarely, megakaryocytic antigens such as CD41, CD42b, and CD61 were also positive. Of the 24 cases, 8 had multilineage dysplasia, all of which were previously classified as the erythroid/myeloid subtype. In total, the 24 cases were reclassified morphologically as follows: PEL (n = 5), MDS-EB-1 (n = 3), MDS-EB-2 (n = 7), AML (nonerythroid leukemia) (n = 3), AML-MRC (by multilineage dysplasia) (n = 2), and MDS/AML unknown due to an unknown percentage of total myeloid blasts (n = 4).10,20
Comparison of pathologic findings between morphologic subtypes of AEL
| Morphologic classification | PEL | Erythroid/myeloid subtype: MDS-EB-1 | Erythroid/myeloid subtype: MDS-EB-2 | Erythroid/myeloid subtype: AML (not pure erythroid) | Erythroid/ myeloid subtype: AML with multilineage dysplasia | Erythroid/myeloid subtype: unknown MDS/AML |
|---|---|---|---|---|---|---|
| No. of cases | 5 | 3 | 7 | 3 | 2 | 4 |
| Multilineage dysplasia, n/N (%) | 0/5 (0) | 2/3 (67) | 4/7 (57) | 0/3 (0) | 2/2 (100) | 0/4 (0) |
| Age, y | ||||||
| Median | 2.3 | 13.5 | 16.0 | 15.2 | 6.4 | 14.6 |
| Range | 0.5-2.6 | 11.4-16.4 | 1.3-21.0 | 1.0-16.2 | 6.4-6.4 | 9.00-19.0 |
| Male:female ratio | 2:3 | 2:1 | 3:4 | 2:1 | 1:1 | 1:3 |
| Flow cytometry/immunohistochemistry, n/N (%) | ||||||
| CD36 | 1/1 (100) | NA | 1/2 (50) | 1/1 (100) | NA | 1/1 (100) |
| CD71 | 2/2 (100) | 2/2 (100) | 2/2 (100) | 2/2 (100) | 1/1 (100) | 2/2 (100) |
| Glycophorin A | 3/3 (100) | 1/1 (100) | 2/2 (100) | NA | 0/1 (0) | 2/2 (100) |
| PAS | 2/2 (100) | NA | NA | 1/1 (100) | 1/1 (100) | NA |
| E-cadherin | 1/1 (100) | NA | NA | NA | NA | NA |
| CD4 | 2/3 (67) | 1/2 (50) | 1/2 (50) | 2/2 (100) | 1/1 (100) | NA |
| CD7 | 0/3 (0) | 1/3 (33) | 3/4 (75) | 1/1 (100) | 0/1 (0) | 2/2 (100) |
| CD13 | 2/5 (40) | 3/3 (100) | 5/5 (100) | 2/2 (100) | 1/1 (100) | 3/3 (100) |
| CD33 | 1/4 (25) | 3/3 (100) | 5/5 (100) | 2/2 (100) | 1/1 (100) | 4/4 (100) |
| CD34 | 0/4 (0) | 3/3 (100) | 3/5 (80) | NA | 1/1 (100) | 2/3 (67) |
| CD38 | 1/3 (33) | 1/1 (100) | 1/1 (100) | 2/2 (100) | 1/1 (100) | 4/4 (100) |
| CD41 | 1/2 (50) | 0/1 (0) | 1/1 (100) | 1/1 (100) | 0/1 (0) | NA |
| CD42b | 1/1 (100) | NA | NA | NA | 0/1 (0) | NA |
| CD61 | 2/2 (100) | 0/2 (0) | 2/3 (66) | 1/1 (100) | 0/1 (0) | NA |
| CD45 | 4/5 (80) | 1/1 (100) | 2/2 (100) | NA | 1/1 (100) | 1/1 (100) |
| CD64 | 0/3 (0) | 0/1 (0) | 1/3 (33) | 2/2 (100) | 0/1 (0) | 1/1 (100) |
| CD117 | 1/5 (20) | 2/2 (100) | 5/6 (83) | 2/2 (100) | 1/1 (100) | 4/4 (100) |
| HLA-DR | 3/5 (60) | 3/3 (100) | 2/5 (40) | 1/2 (50) | 1/1 (100) | 4/4 (100) |
| MPO | 0/5 (0) | 3/3 (100) | 2/2 (100) | 2/3 (66) | 1/1 (100) | 1/3 (33) |
MPO, myeloperoxidase; NA, not available.
Patient characteristics
The 24 cases of morphologic AEL were split evenly between male and female subjects (male:female ratio, 13:11) (Table 1). The median age of patients was 10.2 years (range, 0.5-21.0 years). However, patients with PEL were significantly younger (median, 2.3 years; range, 0.5-2.6 years) than those with erythroid/myeloid leukemia (median, 13.5 years; range, 1.0-21.0; P < .01).
Cytogenetic assessment
For all 24 cases, cytogenetics was confirmed by central cytogenetics review. Compared with all other centrally reviewed cases of AML, these cases of AEL lacked the classic cytogenetic findings of inv(16)/t(16;16), t(8;21), and 11q23/KMT2A abnormalities, the last finding being statistically significant (P = .012) (Figure 1). Figure 2 displays the spectrum of cytogenetic findings identified in cases of AEL. Overall, 9 cases had normal karyotypes, 8 of which were erythroid/myeloid leukemias; 4 of these cases showed multilineage dysplasia. Seven cases had complex karyotypes, defined as ≥3 chromosomal abnormalities, all occurring in patients aged 1.0 to 2.6 years. Only 1 other patient was aged <6 years (a 6-month-old child with PEL and a normal karyotype); the remaining 4 cases of PEL had complex karyotypes. Of the total 7 cases of complex karyotypes, only 1 MDS-EB-2 had multilineage dysplasia. Deletions of 13q were prevalent in those with complex karyotypes (5 of 7 complex karyotype cases). One case of MDS-EB-2 having multilineage dysplasia did not have a complex karyotype but had an MDS-defining cytogenetic abnormality of t(3;21)(q26;q22). There were no cases of monosomy 5/del(5q), monosomy 7/del(7q), or abnormalities of 12p. The most common aneuploidies were trisomy 6 (13%), trisomy 8 (21%), and trisomy 21 (13%), which were present in cases of PEL, MDS-EB-1, MDS-EB-2, and AML (nonerythroid).
Final 2017 WHO classifications
Considering morphology and karyotype, the 5 cases of PEL would be recategorized by the 2017 WHO classification as AML-MRC (n = 4) and AML, NOS PEL (n = 1). The 19 cases of erythroid/myeloid subtype would be classified as MDS-EB-1 (n = 3), MDS-EB-2 (n = 7), AML-MRC (n = 2 due to multilineage dysplasia and n = 1 due to complex karyotype), AML, NOS, nonerythroid subtype (n = 2), and unknown MDS/AML (n = 4, due to unknown percentage of total myeloid blasts).
Genetic mutations and fusions
Figure 2 lists the prognostic markers used for cases of leukemia. FLT3 ITD was identified in 4 (17%) cases, all of which were erythroid/myeloid leukemia. Allelic ratios ranged from 0.01 to 0.09 and were not considered high. All 4 were aged >6 years (range, 6.4-16.4 years), and 3 had normal karyotypes. No FLT3 or CEBPα point mutations were identified in those cases tested. There was only 1 case with an identified NPM1 mutation (ie, an erythroid/myeloid leukemia). However, 36% (5 of 14) of tested cases had identified WT1 mutations, all of which were erythroid/myeloid leukemias; in fact, most of these 5 erythroid/myeloid leukemias had more than one WT1 mutation. These mutations are listed in the dbGaP TARGET: Acute Myeloid Leukemia study (accession, phs000465.v19.p8).27 Finally, in the 11 cases with TP53 mutation testing, only one had a single mutation (p.P47S), a case of MDS-EB-1.
In addition to karyotype analysis, RNA-seq analysis was performed for 22 patients with AEL for expression and fusion profiling. In these sequenced cases, 9 fusions were identified, of which 7 involved NUP98, for a total percentage of 32% with NUP98 fusions (Figures 1 and 2). The 7 cases with NUP98 rearrangements had fusion partners of KDM5A (n = 4), NSD1 (n = 2), and SET (n = 1). Notably, 3 (60%) of 5 cases of PEL had NUP98 fusions. Of the 4 cases with NUP98–KDM5A translocations, 2 had PEL and 2 had MDS-EB-2 (erythroid/myeloid subtype). Of these NUP98–KDM5A cases, 3 had complex karyotypes and 1 had a normal metaphase karyotype (age range, 1.4–6.0 years). The 2 cases of NUP98–NSD1 translocations (ages 6.4 and 16.0 years) had erythroid/myeloid leukemia. Another alternative NUP98 fusion was identified with SET in a case of PEL. Two additional fusions were identified: a variant t(3;5)(q25.3;q35.1) (NPM1–MLF1) identified in a case of erythroid/myeloid leukemia and a t(3;21)(q26;q22) (RUNX1–MECOM) identified in a case of MDS-EB-2. There were no rearrangements of KMT2A.
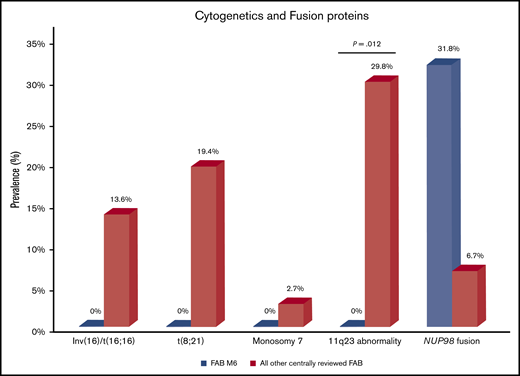
Cytogenetics and fusion proteins in pediatric AEL versus other pediatric AMLs. Compared with all other centrally reviewed AMLs, AEL had fewer cytogenetic abnormalities of inv(16)/t(16;16), t(8;21), monosomy 7, and 11q23 abnormalities (the last being statistically significant). However, AEL was enriched in NUP98 fusions compared with the other subtypes of AML (analyzed from the AAML1031 cohort).
Cytogenetics and fusion proteins in pediatric AEL versus other pediatric AMLs. Compared with all other centrally reviewed AMLs, AEL had fewer cytogenetic abnormalities of inv(16)/t(16;16), t(8;21), monosomy 7, and 11q23 abnormalities (the last being statistically significant). However, AEL was enriched in NUP98 fusions compared with the other subtypes of AML (analyzed from the AAML1031 cohort).
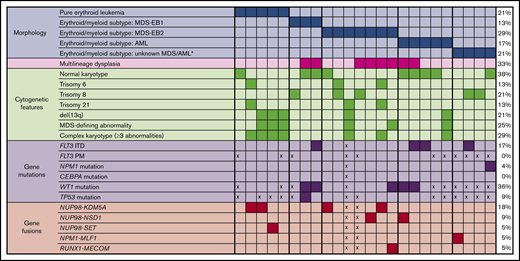
Cytogenetic and molecular features of AEL. Cases are separated according to morphology of PEL and erythroid/myeloid subtypes, with 2017 WHO classification used for MDS and AML. *2017 WHO classification could not be determined, as the total percentage of myeloid blasts in all cells (not just nonerythroid cells) was not recorded. PM, point mutation; x, not performed.
Cytogenetic and molecular features of AEL. Cases are separated according to morphology of PEL and erythroid/myeloid subtypes, with 2017 WHO classification used for MDS and AML. *2017 WHO classification could not be determined, as the total percentage of myeloid blasts in all cells (not just nonerythroid cells) was not recorded. PM, point mutation; x, not performed.
Outcomes
Table 2 details the 5-year OS and 5-year EFS of all risk factors in this group of 24 AEL patients. Comparison of the entire AEL cohort vs that of all other FAB subtypes who underwent central pathology review (n = 1910) revealed no statistically significant differences in OS, EFS, or RR in those who achieved CR. Only 4 of the 19 patients with known transplant status underwent stem cell transplant, all with erythroid/myeloid leukemia; the rate of transplantation in the cases of AEL did not differ between trials, nor did outcomes between those who did and did not undergo transplant. Including all 24 cases, when cases of pure erythroid and erythroid/myeloid subtypes of AEL (Figure 3A-B) were separated, there was no significant difference in OS or EFS for those with erythroid/myeloid leukemias or other FAB subtypes. However, patients with PEL had significantly lower OS than those with erythroid/myeloid leukemia (5-year, 20% ± 36% vs 66% ± 23%; P = .004) as well as EFS (5-year, 20% ± 36% vs 46% ± 23%; P = .019). In addition, the RR in those who achieved CR was higher in patients with PEL than those with erythroid/myeloid leukemia (5-year, 67% ± 0% vs 55% ± 32%; P = .035). None of the cases of PEL underwent transplant in this study.
Outcome measures in pediatric AEL
| Variable | n | 5-y OS, % ± 2SE% | 5-y EFS, % ± 2SE% |
|---|---|---|---|
| Morphology | |||
| M0-M5, M7 FAB | 1910 | 65 ± 2* | 50 ± 2* |
| M6 FAB | 24 | 56 ± 21 | 41 ± 20 |
| PEL | 5 | 20 ± 36† | 20 ± 36† |
| Erythroid/myeloid leukemia | 19 | 66 ± 23* | 46 ± 23* |
| MDS (new WHO classification) | 10 | 56 ± 33 | 48 ± 33 |
| AML (new WHO classification) | 5 | 80 ± 36 | 40 ± 44 |
| Multilineage dysplasia | |||
| Absent | 16 | 48 ± 26 | 38 ± 24 |
| Present | 8 | 73 ± 33 | 50 ± 35 |
| Karyotype | |||
| Not complex | 17 | 55 ± 26 | 34 ± 24 |
| Complex | 7 | 57 ± 37 | 57 ± 37 |
| Mutations | |||
| WT1 wild type | 9 | 53 ± 35 | 56 ± 33 |
| WT1 mutation | 5 | 60 ± 44 | 20 ± 36 |
| TP53 wild type | 10 | 57 ± 23 | 40 ± 31 |
| TP53 mutation | 1 | 0 ± 0 | 0 ± 0‡ |
| Fusion status | |||
| No fusions | 13 | 45 ± 28 | 38 ± 27 |
| Fusion positive | 9 | 65 ± 33 | 30 ± 33 |
| NUP98 fusion positive | 7 | 54 ± 40 | 43 ± 37 |
| NUP98–KDM5A positive | 4 | 25 ± 43 | 25 ± 43 |
| NUP98–NSD1 positive | 2 | 100 ± 0 | NA |
| NUP98–SET positive | 1 | 100 ± 0 | 100 ± 0 |
| NPM1–MLF1 positive | 1 | NA | 0 ± 0 |
| RUNX1–MECOM positive | 1 | NA | 0 ± 0 |
| Morphology + fusion | |||
| PEL without NUP98 fusion | 2 | 0 ± 0 | 0 ± 0 |
| PEL with NUP98 fusion | 3 | 33 ± 54 | 33 ± 54 |
| PEL with NUP98–KDM5A fusion | 2 | 0 ± 0 | 0 ± 0 |
| MDS with NUP98 fusion | 3 | 50 ± 71 | 67 ± 54 |
| MDS with NUP98–KDM5A fusion | 2 | 50 ± 71 | 50 ± 71 |
| AML (nonerythroid) with NUP98–NSD1 fusion | 1 | 100 ± 0 | 0 ± 0 |
SE, standard error.
Significantly better compared with PEL.
Significantly worse compared with M0-M5, M7 FAB group and erythroid/myeloid leukemia cohort.
Significantly worse compared with those without TP53 mutations.
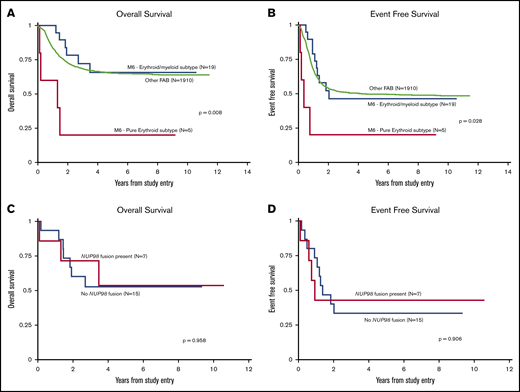
Kaplan-Meier curves. OS (A) and EFS (B) according to morphologic subtype. All other centrally reviewed leukemias were compared with the AEL of the pure erythroid subtype and the AEL of the erythroid/myeloid subtype. As shown, cases with PEL subtype had a significantly worse OS and EFS than those of the erythroid/myeloid subtype. OS (C) and EFS (D) of AEL cases according to the presence or absence of NUP98 fusion.
Kaplan-Meier curves. OS (A) and EFS (B) according to morphologic subtype. All other centrally reviewed leukemias were compared with the AEL of the pure erythroid subtype and the AEL of the erythroid/myeloid subtype. As shown, cases with PEL subtype had a significantly worse OS and EFS than those of the erythroid/myeloid subtype. OS (C) and EFS (D) of AEL cases according to the presence or absence of NUP98 fusion.
The presence of any fusion protein did not affect 5-year OS or EFS, nor did the presence of a NUP98 fusion (Figure 3C-D). The PEL with NUP98–SET fusion and the 2 erythroid/myeloid leukemias with NUP98–NSD1 fusions had a 5-year OS of 100% ± 0%. However, the 4 cases with NUP98–KDM5A fusions had much worse 5-year OS and EFS (both 25% ± 43%), although these results were not statistically significant compared with all cases without NUP98–KDM5A fusions (5-year OS and EFS, 59% ± 24% and 38% ± 23%, respectively). Of the 4 cases with NUP98–KDM5A fusions, 2 had PEL, and both died of the disease. Part of the poor prognosis seen in cases of PEL could be due to increased rate of NUP98–KDM5A fusions, but this fusion does not account for all the events and deaths in this small group.
Discussion
In the current study, 24 cases of AEL from 2 recent COG trials were evaluated for morphology, cytogenetics, and molecular features. Of the 5 PEL, 4 had complex karyotypes, and 3 had NUP98 fusions (60%), including 2 with KDM5A fusion partners. These PEL cases had significantly poorer 5-year OS and EFS than the 19 leukemias previously classified as erythroid/myeloid leukemia. These 19 erythroid/myeloid leukemias, at least 10 of which would now be classified as MDS using the 2017 WHO classification, included 8 cases with multilineage dysplasia and 6 cases with identified fusion proteins (4 having NUP98 rearrangements). These 19 cases did not have significantly worse outcomes compared with the rest of the AML subtypes in these 2 COG trials.
AEL is a rare subtype of AML in children. In these 2 COG trials, only 24 (1.2%) of all central pathology review cases of AML had the AEL immunophenotype. Because this disease usually affects older individuals, studies on childhood AEL are rare. Despite the small number of patients in the current study, it is one of the largest on children and young adults with AEL, and one of the few that uses the current WHO standards of classification. The previous COG trial (CCG-2891) reported 19 cases of AML FAB M6 (2.2% of the study).11 Of note, that COG study included both erythroid/myeloid and pure erythroid subtypes of M6 but required that myeloblasts constitute >30% of all nonerythroid cells, and it therefore may have underestimated the number of cases of AEL.17 Median ages of cases were similar for the previous CCG-2891 trial and the current study (both, 10.2 years).11
The CCG-2891 pediatric MDS/AML trial reported a 5-year OS and EFS of 31.6% ± 21% and 21.1% ± 19%, respectively, in cases of AEL.11 However, that cohort included both pure erythroid and erythroid/myeloid subtypes. The current study shows that patients with PEL have markedly poorer outcomes than those with erythroid/myeloid leukemia. Although previous studies report reduced survival for patients with PEL in adult and mixed cohorts,15,30 to the best of our knowledge, our study is the first to show this finding in a mainly pediatric cohort. Although this small cohort of PEL cases had a high rate of complex karyotypes (80%), the presence of a complex karyotype did not affect outcomes, suggesting that other factors drive the poor prognosis associated with those with PEL.
Of the 22 cases analyzed by using RNA-seq, 9 (41%) had identified fusions, 7 (32%) of which involved NUP98. This finding is substantially higher than the rate of 3.8% (22 of 574) reported in a pediatric AML cohort,31 the rate of 6.6% (82 of 1231) in all pediatric AML cases in AAML1031, and the rate of 20% (7 of 35) in pediatric AEL reported by Iacobucci et al15 (although 4 of the NUP98 fusion patients included in the study by Iacobucci et al are also present in our study). Specifically, the rate of NUP98 fusions in patients with morphologic PEL was 60% in the current study (none of whose fusions were identified in the study by Iacobucci et al). The supplemental data from Iacobucci et al identified 2 of 4 pediatric PEL with NUP98 fusions, also supporting this increased rate of NUP98 fusions in this specific type of pediatric leukemia. Presence of NUP98 fusions has been associated with poor OS in patients with AEL, with a 5-year OS of 35.7% reported in a small pediatric series (n = 7) by Iacobucci et al. In both the study by Iacobucci et al and our series, the most common NUP98 fusion partner was KDM5A, although NUP98 is known to have multiple fusion partners. Again, we note that there was some overlap of cases between the current study and that by Iacobucci et al, including 4 shared cases that had NUP98 fusions (two NUP98–NSD1 and two NUP98–KDM5A). The specific NUP98–KDM5A cryptic fusion is typically found in acute megakaryoblastic leukemias32-35 but rarely identified in FAB M0, M2, M5, and M6 leukemias.31,33,36 Interestingly, 2 of the NUP98–KDM5A cases reported in the current cohort expressed megakaryocytic antigens such as CD41, CD42b, and CD61 in addition to erythroid antigens glycophorin A and CD71. The incidence of NUP98–KDM5A for all pediatric leukemias is 1.4%,33 but it is enriched in acute megakaryoblastic leukemias with rates of 9% to 11.5%.33,34,36,37 The median age of patients with acute megakaryoblastic leukemia and this translocation is 1.8 to 1.9 years (range, 0.8-8.5 years)33,34 similar to the median and age range of the 4 cases in our cohort. In the study by Hara et al,36 3 of the 4 cases of NUP98–KDM5A fusion were associated with complex karyotypes and 1 had a normal karyotype, which is the same as the ratio reported in our series. The prognosis of patients with acute megakaryoblastic leukemia and NUP98–KDM5A fusions is reportedly poor, with one cohort by de Rooij et al34 having a 4-year OS of 36% ± 13%, another cohort of de Rooij et al37 reporting a 5-year OS of 35% ± 16%, and a third cohort of de Rooij et al33 reporting a 5-year OS of 22% ± 14%.34,36 Our series show a similar 5-year OS of 25% ± 43% for cases of AEL with NUP98–KDM5A fusions. In general, this particular fusion may portend as a poor prognosis for AEL as it did in these prior studies of acute megakaryoblastic leukemia.
Given that there is immunophenotypic overlap between some of our NUP98–KDM5A fusion cases and acute megakaryoblastic leukemia, and that this fusion is associated with such a poor prognosis, the diagnosis of AML with NUP98–KDM5A may warrant being classified as a recurrent genetic abnormality. Although the 4 cases of leukemia with NUP98–KDM5A did not have a statistically significant difference in outcome in our series compared with those without this specific fusion, this finding is most likely hampered by the small number of cases in our series and will need to be validated in a larger cohort. If confirmed, this fusion seems to be more important than the morphologic and immunophenotypic findings.
Alternatively, as megakaryocytic antigens were identified in 3 additional cases (including the PEL with NUP98–SET fusion), there may just be more immunophenotypic overlap between AEL and acute megakaryoblastic leukemia. Of note, the rates of expression of these antigens may be underrepresented due to the manner of data collection for COG trials and/or the lack of these antigens on initial leukemia panels, as 14 cases did not have megakaryocytic antigens reported. Rare cases of AML with mixed megakaryoblastic and erythroblastic origin have been reported,38,39 and shared messenger RNAs have been found to be expressed in these different leukemia subtypes.40
Although this study is one of the largest cohorts of children and young adults with AEL, it is still hampered by small numbers, especially when analyzing those with PEL. Given the small size of these groups, this study is more exploratory, and the comparisons being made are ad hoc analyses. In addition, we combined patients from 2 different clinical trials; the combination of cases from these trials was feasible, as they did not have statistically significant differences in OS or EFS.16 However, we cannot determine if there were similar enrollment biases in the AAML0531 compared with those in AAML1031 that were previously reported.41 Although our subgroups of PEL and erythroid/myeloid leukemias had outcomes similar to those of prior studies, our findings of increased NUP98 fusions, especially in those with PEL, will need to be validated in a larger study. In addition, we were unable to compare our cohort of newly classified MDS cases to a similar MDS cohort, as neither COG trial included cases with <20% blasts unless they were classified as AEL or with a specific recurrent genetic abnormality. Similarly, we did not perform case-control analyses using AEL with other AML from these trials.
In summary, although we could not determine the exact etiology underlying the poor prognosis of children with PEL, our study did find that 2 of 5 cases of PEL had NUP98–KDM5A fusions, and both were associated with poor outcomes. The poor outcomes were not related to presence of a complex karyotype, any NUP98 fusion, or multilineage dysplasia. However, our study did not include a large number of PEL cases, and we therefore could not perform a comprehensive statistical analysis. We recommend that future studies analyze larger cohorts that include data on transcriptomic and epigenetic changes to identify the underlying causes for poor outcomes in these patients.
De-identified individual participant data for the results reported in this paper are available in supplemental Table 1. Data-sharing requests may also be sent to the corresponding author (Karen M. Chisholm; e-mail: karen.chisholm@seattlechildrens.org).
Acknowledgments
The authors thank Vani Shanker from the Department of Scientific Editing (St. Jude Children’s Research Hospital, Memphis, TN), for her thorough reading and editing of the manuscript. They also thank the patients and families for participating in these COG trials.
This research was supported by COG Chairs grant U10CA098543, NCTN Network Group Operations Center grant U10CA180886, Statistics and Data Center grant U10CA098413, and NCTN Statistics and Data Center grant U10CA180899 from the National Institutes of Health, National Cancer Institute; St. Baldrick’s Foundation; Seattle Children’s Hospital Mark Alan Bomgardner Endowment (K.M.C.); and Canada Research Chair in Pediatric Oncology Supportive Care (L.S.).
Authorship
Contribution: A.E.H.-M., J.K.C., and S.B.K. performed central pathology reviews; K.M.C., A.E.H.-M., J.K.C., and S.B.K. reviewed cases for multilineage dysplasia; B.A.H. and S.C.R. performed central cytogenetic reviews; J.S. and R.E.R. screened molecular and fusion results; T.A.A. and Y.-C.W. performed statistics; K.M.C., T.A.A, and Y.-C.W. analyzed the data; A.S.G., R.A., S.M., and L.S. were COG study chairs and vice chairs; K.M.C. wrote the manuscript; and all authors edited and approved the final version of the manuscript.
Conflict-of-interest disclosure: The authors declare no competing financial interests.
Correspondence: Karen M. Chisholm, Seattle Children’s Hospital, Department of Laboratories, 4800 Sand Point Way NE, OC.8.720, Seattle, WA 98105; e-mail: karen.chisholm@seattlechildrens.org.

