

Key Points
Lower gene richness and a lower abundance of Blautia and A muciniphila were associated with subsequent aGVHD.
Myeloablative conditioning was associated with aGVHD as well as a reduction in gene richness and abundance of Blautia and A muciniphila.

Abstract
Acute graft-versus-host disease (aGVHD) is a leading cause of transplantation-related mortality after allogeneic hematopoietic stem cell transplantation (aHSCT). 16S ribosomal RNA (16S rRNA) gene-based studies have reported that lower gut bacterial diversity and the relative abundance of certain bacteria after aHSCT are associated with aGVHD. Using shotgun metagenomic sequencing and a large cohort, we aimed to confirm and extend these observations. Adult aHSCT recipients with stool samples collected from day −30 to day 100 relative to aHSCT were included. One sample was selected per patient per period (pre-aHSCT (day −30 to day 0), early post-aHSCT (day 1 to day 28), and late post-aHSCT (day 29 to day 100)), resulting in 150 aHSCT recipients and 259 samples. Microbial and clinical factors were tested for differences between time periods and an association with subsequent aGVHD. Patients showed a decline in gut bacterial diversity posttransplant, with several patients developing a dominance of Enterococcus. A total of 36 recipients developed aGVHD at a median of 34 days (interquartile range, 26-50 days) post-aHSCT. Lower microbial gene richness (P = .02), a lower abundance of the genus Blautia (P = .05), and a lower abundance of Akkermansia muciniphila (P = .01) early post-aHSCT was observed in those who developed aGVHD. Myeloablative conditioning was associated with aGVHD along with a reduction in gene richness and abundance of Blautia and A muciniphila. These results confirm low diversity and Blautia being associated with aGVHD. Crucially, we add that pretransplant conditioning is associated with changes in gut microbiota. Investigations are warranted to determine the interplay of gut microbiota and conditioning in the development of aGVHD.
Introduction
Allogeneic hematopoietic stem cell transplantation (aHSCT) is one of the most intense forms of immunotherapy and is performed in more than 25 000 patients annually.1 However, full use of aHSCT is limited because of its life-threatening complications, including graft-versus-host disease (GVHD).2 GVHD, including acute GVHD (aGVHD), is a leading cause of nonrelapse mortality in aHSCT3,4 caused by allogeneic donor T cells attacking target organs of the host.5
Clinical risk factors previously associated with the development of aGVHD include graft source, the sex of the donor or recipient, HLA mismatch, the relationship between donor and recipient, and high-dose conditioning regimens.6,7 Yet these factors can only partially explain the risk of aGVHD. Recent research has described an extensive cross-talk between gut microbiota and the host immune system, including the impact of gut microbiota on anticancer immune responses and chemotherapy.8-11 Because aGVHD is an immunologic disease with the gastrointestinal tract being one of its main target organs, it is hypothesized that the gut microbiota may also play an important role in the development of aGVHD.12
Previously, removal or partial removal of gut microbiota through gut decontamination was considered to lower the risk of aGVHD.13,14 However, growing evidence has indicated the opposite,15-17 and several studies show that a diverse gut flora may be beneficial to recipients of aHSCT.12 Specifically, these studies indicate that lower bacterial diversity within the first weeks after aHSCT increases risk of aGVHD-related outcomes,18,19 including aGVHD-related mortality,20,21 overall mortality,20-22 and disease relapse.23
However, despite accumulating evidence that supports associations between the gut microbiome and aHSCT outcomes, there are still relatively few studies evaluating the influence of gut microbiota in an aHSCT setting with aGVHD as their main outcome. Within these studies, an analysis of the clinical risk factors associated with aGVHD and the gut microbiome is also lacking. Furthermore, studies with adult cohorts have exclusively used 16S ribosomal RNA (16S rRNA) gene sequencing data that provides information on variance within the 16S rRNA gene and often describes bacterial taxonomy only at the genus level. In comparison, shotgun metagenomic sequencing assesses all genes within a particular sample (allowing for further analysis of these genes, including assessment of potential metabolic pathways) and provides more accurate species-level taxonomy.24 Therefore, by using shotgun metagenomic sequencing, we aimed to characterize the dynamics of the gut microbiota during aHSCT and explore the associations between gut microbial and clinical factors and the development of aGVHD in a large cohort of aHSCT recipients.
Methods
Patients and treatment regimens
Adults (age 18 years or older) who underwent a first aHSCT at the Stem Cell Transplantation Unit, Department of Hematology, Rigshospitalet, University of Copenhagen (Copenhagen, Denmark) between 1 January 2016, and 1 October 2018, were prospectively included. All patients gave written informed consent to the storage and use of stool samples for research. The study was performed in compliance with the Declaration of Helsinki and approved by the Danish Ethics Committee of the Capital Region (Journal No. H-16047481) as well as the Danish Data Protection Agency (RH-2017-67, I-suite 05320).
All patients underwent either myeloablative or nonmyeloablative conditioning before transplantation. The main myeloablative conditioning regimens were fludarabine-treosulfan-, cyclophosphamide with total body radiation (TBI) of 1200 Gy, or cyclophosphamide with TBI (1200 Gy) and anti-thymocyte globulin (ATG). The main nonmyeloablative conditioning regimen was TBI (≤400 Gy) and fludarabine. Gut decontamination was not performed prior to a HSCT. Patients received antibiotics when neutrophil counts were <0.5 × 10⁹/L prior to aHSCT (myeloablative conditioning: ceftazidime 2 g IV 3 times per day; nonmyeloablative conditioning: ciprofloxacin 500 mg orally 2 times per day) until neutrophil counts were >0.5 × 10⁹/L. All patients received sulfamethoxazole (400 mg) and trimethoprim (80 mg) orally once per day from day 0 until the end of immunosuppressive treatment. For additional information, see supplemental Methods and supplemental Table 1.
Data sources
Patient demographic, clinical, and paraclinical data were retrieved from the Personalised Medicine for Infectious Complications in Immune Deficiency (PERSIMUNE)25 data lake. The PERSIMUNE data lake contains data from multiple electronic health data repositories in Denmark. For additional information, see supplemental Methods.
Sample collection and preprocessing
Fecal samples were collected by the patient or nursing staff using the OMNIgene.GUT (DNA Stabilized-frozen Inc., Ottawa, Ontario, Canada) stabilization tube according to the manufacturer’s instructions. Samples were frozen for a median of 6 days (interquartile range, 3-8 days) after sampling. Of all the samples, 17 of 259 had a missing sampling date and they were given the freezing date (ie, the date the sample was frozen) as a proxy sample date. All samples were stored at −80°C until shipment for sequencing. Samples underwent shotgun metagenomic sequencing on the Illumina Hi-Seq platform.
After sequencing, reads underwent preprocessing and quality control steps, including trimming of reads, removal of reads with <50 base pairs, and removal of all reads mapping to the human genome (GRCh38). Samples with <1 million reads remaining after quality control steps were removed from further analysis. For additional information, see supplemental Methods.
Microbial factors
Taxonomical annotation was assigned using MOCAT226 and the National Center for Biotechnology Information database.27 Alpha diversity was measured using the inverse Simpson index, based on molecular operational taxonomic units from MOCAT2,26 and using R (v3.5.0)28 phyloseq.29 Gene richness (the number of unique genes) was calculated by mapping reads to the Integrated Gene Catalogue30 using bowtie2.31 Individual gene abundance was calculated using the mapping output. Metabolic richness (the number of unique potential metabolic pathways) was calculated by first using MOCAT226 functional profiling, evolutionary genealogy of genes: Non-supervised Orthologous Groups (eggNOG),32 and Kyoto Encyclopedia of Genes and Genomes (KEGG) ontology33-35 to assign KEGG ontology profiles. These profiles were then assigned to gut metabolic module profiles using the Omixer-RPM reference pathway mapper.36 Heatmap visualizations were conducted using R (v3.5.0)28 ComplexHeatmap.37
Statistical analysis
Patients were included if they had at least 1 sample that passed quality assessment and which was collected between day −30 and day 100. Samples were grouped into the following time periods: pre-aHSCT (day −30 to day 0), early post-aHSCT (day 1 until and including day 28), and late post-aHSCT (day 29 until and including day 100). One sample per patient per period was selected. For patients with multiple samples per period, the median time of sampling in patients with 1 sample was calculated, and the sample closest to this median time (15 days for early post-aHSCT and 34 days for late -post-aHSCT) was selected.
First, descriptive analyses were performed to compare microbial factors (diversity measures and taxonomical bacterial abundance) in the 3 periods. Comparisons of diversity measures (alpha diversity, gene richness, and metabolic richness) were performed using Kruskal-Wallis and pairwise Wilcoxon tests without correction for multiple testing. The abundance of bacterial genera and species was then compared between periods by using a discovery (non-hypothesis–driven) method. This discovery method consisted of the mean-based DESeq238 R (v.3.5.0)28 and the median-based Wilcoxon test (taking into account compositionality),39 with a combined significance cutoff of a false discovery rate (FDR) <0.1 and P ≤ .05, respectively.
Hereafter, analyses of samples were conducted that examined potential microbial risk factors for the development of aGVHD pre-aHSCT and early post-aHSCT. We excluded samples collected after aGVHD development and samples from late post-aHSCT because they were biased toward those who had not developed aGVHD. aGVHD was diagnosed and graded according to the modified Glucksberg-Seattle criteria;40,41 cases were defined as having grade 2 or greater aGVHD. There was complete ascertainment regarding aGVHD diagnosis.
Microbial factors that were tested for an association with aGVHD included diversity measures, individual gene abundance, and metabolic modules and pathways. Metabolic pathways were tested using Wilcoxon tests. There were 14 predefined bacteria based on a priori research findings (supplemental Table 2), and they were tested using Kruskal-Wallis tests without correcting for multiple testing and univariable logistic regression. To discover potentially new bacteria associated with aGVHD, the discovery method was used.
Clinical variables that were tested for an association with the development of aGVHD included conditioning regimen, donor sex, recipient and donor age, Charlson comorbidity score, underlying disease, year of aHSCT, relationship (related/unrelated) with the donor, HLA match, graft source, cytomegalovirus risk, and TBI dose. All clinical factors found to be significant (P < .1) in the univariable analyses were tested in a multivariable model using logistic regression analysis. Those that were significant (P < .05) remained in the final clinical multivariable model.
Clinical variables found to be associated with aGVHD were tested (using Kruskal-Wallis tests) for an association with significant microbial factors (ie, if donor age and bacteria X were both separately associated with aGVHD, we tested for a potential association between donor age and bacteria X). Logistic regression was used to combine significant clinical and microbial factors into one combined multivariable model for risk of developing aGVHD. For additional information, see supplemental Methods.
Results
Patient characteristics and samples
A total of 163 patients delivered 399 stool samples in conjunction with their aHSCT between January 2016 and October 2018. After quality assessment of samples, 150 patients had 259 samples eligible for further analysis. Patients were heterogeneous (Table 1), with acute leukemia being the most common underlying disease (n = 58) and the majority having undergone nonmyeloablative conditioning (n = 88).
Patient characteristics
| Characteristic | No. (%) |
|---|---|
| Total patients | 150 (100) |
| Male sex | 80 (53) |
| Male donor | 96 (64) |
| Median age (IQR), y | 57 (50-65) |
| Median donor age (IQR), y | 28 (22-40) |
| Donor | |
| Related | 33 (22) |
| Unrelated | 117 (78) |
| Graft source | |
| Peripheral blood stem cell | 131 (87) |
| Bone marrow | 19 (13) |
| HLA match | |
| MRD 10/10 allele matched | 30 (20) |
| MUD 10/10 + 9/10 allele matched | 98 (65) |
| MUD 1 antigen mismatch | 19 (13) |
| Haploidentical | 3 (2) |
| Underlying disease* | |
| Acute leukemia | 58 (39) |
| Other | 92 (61) |
| Disease risk† | |
| High | 51 (34) |
| Low | 99 (66) |
| Karnofsky score at aHSCT | |
| <90 | 25 (17) |
| 90-<100 | 72 (48) |
| 100 | 51 (34) |
| NA | 2 (1) |
| Conditioning regimen | |
| Myeloablative | 62 (41) |
| Nonmyeloablative | 88 (59) |
| Radiation | |
| None | 38 (25) |
| ≤400 Gy | 88 (59) |
| ≥1200 Gy | 24 (16) |
| T-cell depletion | |
| Yes | 17 (11) |
| No | 133 (89) |
All data are no. (%) unless otherwise stated.
IQR, interquartile range; MRD, matched related donor; MUD, matched unrelated donor; NA, not available.
Underlying diseases include acute lymphoblastic leukemia (ALL), acute myeloblastic leukemia, acute nonlymphocytic leukemia, acute myelomonocytic leukemia, acute monocytic leukemia, and chronic ALL.
Factors for high risk of disease include greater than first complete remission or primary induction failure for acute leukemia, non-Hodgkin leukemia, Hodgkin l, chronic lymphocytic leukemia, myelodysplastic syndrome (MDS) with refractory anemia and excess blasts, prolymphocytic leukemia (PLL), and severe aplastic anemia. Factors for low risk of disease include first complete remission of acute leukemia; biphenotypic, bilineage, or hybrid leukemia; chronic myeloblastic leukemia; Diamond-Blackfan anemia; MDS (minus refractory anemia with excess blasts); precursor T-cell lymphoblastic lymphoma; peripheral T-cell lymphoma; splenic marginal zone B-cell lymphoma; PLL T-cell lymphoma, and PLL B-cell lymphoma.
There were 86 samples from the period pre-aHSCT, 112 from the early post-aHSCT period, and 62 from the late post-aHSCT period. There were 27 patients who had samples during all 3 periods and 82 patients who had samples during 2 of the 3 periods. For gene richness analyses, the quality-control read number cutoff was more stringent, resulting in 64 patients with samples pre-aHSCT, 67 patients with samples early post-aHSCT, and 33 with samples late post-aHSCT. For an overview of samples, see supplemental Figure 1. Patient characteristics were similar across sampling periods (supplemental Table 3).
Dynamics of gut microbiota
There were significant differences in diversity of gut microbiota among the 3 time periods relative to aHSCT (Kruskal-Wallis P < .01 for all diversity measures; alpha diversity, gene richness, and metabolic richness). Diversity was lower in the early post-aHSCT period (median inverse Simpson index, 2.34; median gene richness, 5.2 × 10⁴; median metabolic richness, 82) compared with the pre-aHSCT period (median inverse Simpson index, 5.13; median gene richness, 1.6 × 10⁵; median metabolic richness, 89). Diversity increased in the late post-aHSCT period, but only metabolic richness recovered to pre-aHSCT levels (Figure 1). When assessing consecutive samples derived from the same patient (n = 27), a similar pattern was observed (supplemental Figure 2).
![Dynamics of gut diversity relative to aHSCT. Diversity measures (the inverse Simpson index on a –log10 scale [A]), gene richness [B], and metabolic richness [C]) of samples for each period (pre-aHSCT, early post-aHSCT, and late post-aHSCT). Overall Kruskal-Wallis analysis was performed on the 3 periods within each diversity measure; thereafter, pairwise Wilcoxon tests were performed for differences in diversity between each period (ie, pre-aHSCT and early post-aHSCT; pre-aHSCT and late post-aHSCT; and early post-aHSCT and late post-aHSCT). ymin lower whisker is smallest observation greater than or equal to lower hinge − 1.5 * IQR; ymax upper whisker is largest observation less than or equal to upper hinge + 1.5 * IQR.](https://ash.silverchair-cdn.com/ash/content_public/journal/bloodadvances/4/22/10.1182_bloodadvances.2020002677/1/m_advancesadv2020002677f1.png?Expires=1767720422&Signature=H-InrEmaRo4WTtz9Mv3CugWxE85RNttMjt2mZBEObHyDDN50BboRoLcFARjzD00mQGNNCFmekCKuNp6LZW1JNrH2Ub~DKHaVj7SP2yNgoLqEQyDLTQO0ftYescp48S5pxl-YEFUJTzZ-BiYWHMemrVotmdI56FrHDOPugjgbdyMP58pAVW4AU56TUt~-FO91k1Aw8CRbW5Zobk~h~VV1b1vK54WUtaI~OcTBacnwkOGlb0UXgafSWw1Ev4AtBufcP0bWTXsTCdBWTs04L74M8HTQ1m5Klx-hzAW7dmwdfOdDdhopZU8fz2JhqfXIhVnJP9XUMczzS0XUS0zekaMk6Q__&Key-Pair-Id=APKAIE5G5CRDK6RD3PGA)
Dynamics of gut diversity relative to aHSCT. Diversity measures (the inverse Simpson index on a –log10 scale [A]), gene richness [B], and metabolic richness [C]) of samples for each period (pre-aHSCT, early post-aHSCT, and late post-aHSCT). Overall Kruskal-Wallis analysis was performed on the 3 periods within each diversity measure; thereafter, pairwise Wilcoxon tests were performed for differences in diversity between each period (ie, pre-aHSCT and early post-aHSCT; pre-aHSCT and late post-aHSCT; and early post-aHSCT and late post-aHSCT). ymin lower whisker is smallest observation greater than or equal to lower hinge − 1.5 * IQR; ymax upper whisker is largest observation less than or equal to upper hinge + 1.5 * IQR.
Dynamics of gut diversity relative to aHSCT. Diversity measures (the inverse Simpson index on a –log10 scale [A]), gene richness [B], and metabolic richness [C]) of samples for each period (pre-aHSCT, early post-aHSCT, and late post-aHSCT). Overall Kruskal-Wallis analysis was performed on the 3 periods within each diversity measure; thereafter, pairwise Wilcoxon tests were performed for differences in diversity between each period (ie, pre-aHSCT and early post-aHSCT; pre-aHSCT and late post-aHSCT; and early post-aHSCT and late post-aHSCT). ymin lower whisker is smallest observation greater than or equal to lower hinge − 1.5 * IQR; ymax upper whisker is largest observation less than or equal to upper hinge + 1.5 * IQR.
In addition to diversity, there was also a shift in the specific microbial composition between the pre-aHSCT and the post-aHSCT periods (Figure 2). The bacterial genera Staphylococcus, Eggerthella, Streptococcus, and Lactobacillus increased significantly in relative abundance (1.2 to 5 log2 fold-change) from pre-aHSCT to early post-aHSCT and pre-aHSCT to late post-aHSCT periods (DESeq2 FDR <0.001, Wilcoxon P < .01 adjusted for compositionality). Several patients also acquired bacterial dominance (>30% relative abundance) of Enterococcus (n = 41 of 112) or Streptococcus (n = 10 of 112) early post-aHSCT, with the main driving species being E faecium and S thermophilus. There were an additional 21 bacterial genera and 51 bacterial species with significant changes in abundance between time periods (Figure 2).

Significant changes in bacterial abundance relative to aHSCT. Heatmap of bacterial abundance in each period (pre-aHSCT, early post-aHSCT, and late post-aHSCT). The bacterial genera and species shown are only those found to be significantly different in abundance between the pre-aHSCT and early post-aHSCT periods and/or the pre-aHSCT and late post-aHSCT periods and those present in ≥10% of samples tested, at a minimum of 0.01% relative abundance. Clustering by row (ie, by bacteria) is based on Pearson clustering distances and has been performed separately for genera and species. Clustering by column (ie, by sample) is based on Euclidean distances and has been performed separately for each time period.
Significant changes in bacterial abundance relative to aHSCT. Heatmap of bacterial abundance in each period (pre-aHSCT, early post-aHSCT, and late post-aHSCT). The bacterial genera and species shown are only those found to be significantly different in abundance between the pre-aHSCT and early post-aHSCT periods and/or the pre-aHSCT and late post-aHSCT periods and those present in ≥10% of samples tested, at a minimum of 0.01% relative abundance. Clustering by row (ie, by bacteria) is based on Pearson clustering distances and has been performed separately for genera and species. Clustering by column (ie, by sample) is based on Euclidean distances and has been performed separately for each time period.
Gut microbiotic diversity and aGVHD
Among the 150 patients included in our cohort, 36 developed aGVHD with a median time to development of 34 days (interquartile range, 26-50 days) post-aHSCT. Samples taken after aGVHD diagnosis and late post-aHSCT samples were removed to avoid biasing the results (see “Methods” and supplemental Figure 1).
No significant association was observed between diversity measures and aGVHD in samples from the pre-aHSCT period (Figure 3). However, in the early post-aHSCT period, patients who later developed aGVHD had a significantly lower gene richness compared with those who did not develop aGVHD (median gene richness, 2.1 × 10⁴ vs 5.7 × 10⁴, respectively; Kruskal-Wallis P = .02). There was also lower metabolic richness in those who developed aGVHD, although this difference was not statistically significant (median metabolic richness, 78 vs 83 in those who did not develop aGVHD; Kruskal-Wallis P = .07). There was no significant difference between aGVHD groups when using alpha diversity as a diversity measure (Kruskal-Wallis P = .74; Figure 3).

Gut diversity and associations with aGVHD. Gut microbial diversity in inverse Simpson index (A), gene richness (B), and metabolic richness (C) in those who developed vs those who did not develop aGVHD pre-aHSCT and early post-aHSCT samples. Kruskal-Wallis tests were performed per diversity measure and period. ymin lower whisker is smallest observation greater than or equal to lower hinge − 1.5 * IQR; ymax upper whisker is largest observation less than or equal to upper hinge + 1.5 * IQR.
Gut diversity and associations with aGVHD. Gut microbial diversity in inverse Simpson index (A), gene richness (B), and metabolic richness (C) in those who developed vs those who did not develop aGVHD pre-aHSCT and early post-aHSCT samples. Kruskal-Wallis tests were performed per diversity measure and period. ymin lower whisker is smallest observation greater than or equal to lower hinge − 1.5 * IQR; ymax upper whisker is largest observation less than or equal to upper hinge + 1.5 * IQR.
In addition to gene richness, we assessed differences in the abundance of individual genes pre-aHSCT and early post-aHSCT with regard to aGVHD. A total of 1267 and 1289 genes were present in significantly different amounts among those who developed aGVHD vs those who did not develop aGVHD pre-HSCT and early post-aHSCT, respectively (DESeq2, FDR < 0.05). Of these genes, 24 overlapped between the 2 time periods, all being significantly higher in abundance among those who did not develop aGVHD (Figure 4A). Interestingly, 1 gene (O2.CD1-0-PT_GL0039283) had a >3 log fold-change in both periods and is known to function as a ζ toxin (PetZ), triggering bacterial autolysis in pathological bacteria. We further assessed whether specific metabolic pathways were expressed in significantly different amounts with regard to aGVHD. However, none were significant after multiple testing correction (Figure 4B).

Gut microbial gene abundance and metabolic pathways associations with aGVHD. (A) Log2 fold-changes of genes found in significantly higher amounts among those who do not develop aGVHD both pre-aHSCT and early post-aHSCT. (B) Discovery analysis of metabolic pathways found in at least 10% of samples tested at an abundance of 1000 copies per 1 million reads in pre-aHSCT and early post-aHSCT samples.
Gut microbial gene abundance and metabolic pathways associations with aGVHD. (A) Log2 fold-changes of genes found in significantly higher amounts among those who do not develop aGVHD both pre-aHSCT and early post-aHSCT. (B) Discovery analysis of metabolic pathways found in at least 10% of samples tested at an abundance of 1000 copies per 1 million reads in pre-aHSCT and early post-aHSCT samples.
Specific gut bacteria and aGVHD
When assessing potential differences in the abundance of certain bacteria, we first assessed 14 predefined bacteria on the basis of data from previous literature (supplemental Table 2) for associations with the development of aGVHD. No significant differences in bacterial abundance among the predefined bacteria were observed in those who developed vs those who did not develop aGVHD in samples from the pre-aHSCT period. In the early post-aHSCT period, 2 of the 14 predefined bacteria were significantly lower in abundance in those who developed vs those who did not develop aGVHD; Blautia (P = .05) and A muciniphila (P = .008); Figure 5A-B; supplemental Figure 3). Further logistic regression found that the absence of Blautia (odds ratio [OR], 3.21; 95% confidence interval [CI], 1.18-8.78) and Bacteroides (OR, 3.08; 95% CI, 1.03-9.20) was associated with an increased odds of aGVHD, whereas E faecium (OR, 0.27; 95% CI, 0.07-0.98) was associated with a decreased OR. A muciniphila was not present in any of the samples from patients who developed aGVHD; thus, logistic regression was not performed.
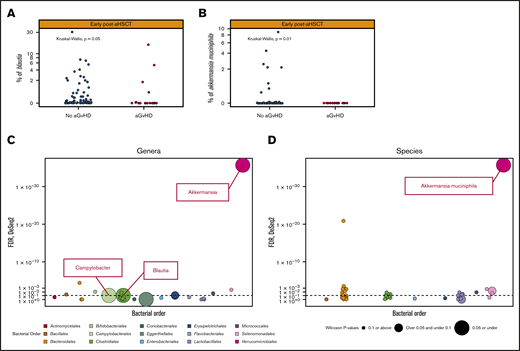
Bacterial species and genera associated with subsequent development of aGVHD. (A-B) The relative abundance (% on a –log10 scale) of the significant predefined bacteria, Blautia and A muciniphila, respectively, among those who do not develop aGVHD vs those who do develop aGVHD early post-aHSCT. (C-D) Our discovery method for bacterial genera and species (present in ≥10% of samples tested at a minimum of 0.01% relative abundance, colored by bacterial order) in early post-aHSCT samples. Those under the dotted line have not passed the DESeq2 threshold of an FDR of P < .01. Those depicted by a larger dot have a lower P value from the Wilcoxon test taking into account compositionality. Those with the largest dot (P ≤ .05) and above the dotted line are the significant bacteria based on our discovery model. The only bacterial genera that have passed this are Blautia, Campylobacter, and Akkermansia, which are shown as the labeled dot on the top of the graph and for species A muciniphila. To see all bacteria passing either threshold (DESeq or Wilcoxon), see supplemental Figure 4.
Bacterial species and genera associated with subsequent development of aGVHD. (A-B) The relative abundance (% on a –log10 scale) of the significant predefined bacteria, Blautia and A muciniphila, respectively, among those who do not develop aGVHD vs those who do develop aGVHD early post-aHSCT. (C-D) Our discovery method for bacterial genera and species (present in ≥10% of samples tested at a minimum of 0.01% relative abundance, colored by bacterial order) in early post-aHSCT samples. Those under the dotted line have not passed the DESeq2 threshold of an FDR of P < .01. Those depicted by a larger dot have a lower P value from the Wilcoxon test taking into account compositionality. Those with the largest dot (P ≤ .05) and above the dotted line are the significant bacteria based on our discovery model. The only bacterial genera that have passed this are Blautia, Campylobacter, and Akkermansia, which are shown as the labeled dot on the top of the graph and for species A muciniphila. To see all bacteria passing either threshold (DESeq or Wilcoxon), see supplemental Figure 4.
By using our discovery method (including all bacterial genera and species if present in ≥10% of samples with an abundance ≥0.01%; see “Methods”), we found that no bacteria were associated with aGVHD in the pre-aHSCT period. In the early post-aHSCT period, the genera Blautia, Akkermansia, and Campylobacter, as well as the specific species A muciniphila were all significantly associated with aGVHD (DESeq2 FDR P < .01; Wilcoxon test adjusted for compositionality P ≤ .05; Figure 5C-D). For all bacteria passing 1 of these 2 criteria, see supplemental Figure 4.
Blautia and A muciniphila were the only 2 bacteria to be confirmed in both the predefined and discovery analyses. In both analyses, a lower abundance of these bacteria was associated with an increased risk of developing aGVHD (Figure 5A-B). A muciniphila was significant at both species and genus levels. The specific species found within the Blautia genus were B obeum, B hydrogenotropica, and B hansenii. Of these, B hydrogenotropica was found only in those who did not develop aGVHD (supplemental Figure 5).
Clinical factors and aGVHD
When assessing clinical factors associated with aGVHD, all 150 patients were included and 36 experienced aGVHD. Radiation dose, graft source, conditioning regimen, and donor sex were significantly associated with aGVHD in univariable analyses. Radiation and graft source were highly correlated with conditioning regimen. Therefore, only donor sex and conditioning regimen were included in the final multivariable model, with female donor (OR, 2.21; 95% CI, 1.01-4.86) and myeloablative conditioning (OR, 2.95; 95% CI, 1.35-6.47) associated with an increased odds of aGVHD (Figure 6; for univariable and multivariable analyses, see supplemental Table 5).
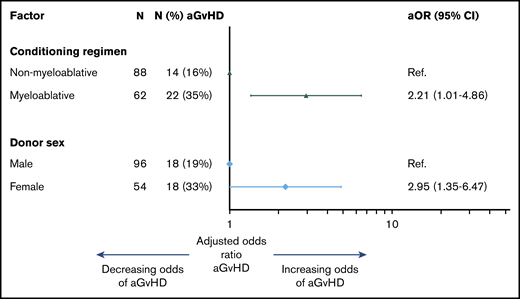
Clinical factors associated with aGVHD. Multivariable logistic regression model of clinical factors associated with the development of aGVHD. aOR, adjusted odds ratio; Ref, reference.
Clinical factors associated with aGVHD. Multivariable logistic regression model of clinical factors associated with the development of aGVHD. aOR, adjusted odds ratio; Ref, reference.
Clinical and microbial aGVHD risk factors
Next, we assessed associations between the clinical risk factors and the gut microbiome factors (gene richness and abundance of Blautia and A muciniphila) significantly associated with aGVHD. There were no significant (P < .05) differences between the use of female vs male donors regarding microbial factors. However, we found a significant difference in gene richness between conditioning groups, with those who underwent myeloablative conditioning having a significantly lower gene richness compared with those who underwent nonmyeloablative conditioning (Kruskal-Wallis P<.001; Figure 7A).

Conditioning type and associations with microbial factors early post-aHSCT. (A) The gene richness (number of unique genes) for those who underwent nonmyeloablative conditioning vs those who underwent nonmyeloablative conditioning early post-aHSCT. (B) Relative abundance (% shown on a –log10 scale) of the bacterial genus Blautia early post-aHSCT in those who underwent nonmyeloablative vs those who underwent myeloablative conditioning. (C) Relative abundance (% shown on a –log10 scale) of the bacterial species A muciniphila early post-aHSCT in those who underwent nonmyeloablative vs those who underwent myeloablative conditioning. ymin lower whisker is smallest observation greater than or equal to lower hinge − 1.5 * IQR; ymax upper whisker is largest observation less than or equal to upper hinge + 1.5 * IQR.
Conditioning type and associations with microbial factors early post-aHSCT. (A) The gene richness (number of unique genes) for those who underwent nonmyeloablative conditioning vs those who underwent nonmyeloablative conditioning early post-aHSCT. (B) Relative abundance (% shown on a –log10 scale) of the bacterial genus Blautia early post-aHSCT in those who underwent nonmyeloablative vs those who underwent myeloablative conditioning. (C) Relative abundance (% shown on a –log10 scale) of the bacterial species A muciniphila early post-aHSCT in those who underwent nonmyeloablative vs those who underwent myeloablative conditioning. ymin lower whisker is smallest observation greater than or equal to lower hinge − 1.5 * IQR; ymax upper whisker is largest observation less than or equal to upper hinge + 1.5 * IQR.
In addition to gene richness, the abundance of Blautia and A muciniphila were both significantly different between conditioning groups, with lower abundance in the myeloablative group compared with the nonmyeloablative group (Kruskal-Wallis P < .001 and P = .01, respectively; Figure 6B-C). There were no significant differences in the abundance of either bacterium between female and male donors.
When both clinical and microbial risk factors were combined in a multivariable model for aGVHD, the significance of gene richness in Blautia and A muciniphila were lost. Because of a lack of power, we were unable to perform a mediation analysis to assess the potential mediation of microbial diversity from myeloablative conditioning on the development of aGVHD.
Discussion
To our knowledge, this is the first study to use shotgun metagenomic sequencing in a large cohort of adults undergoing aHSCT. We found substantial changes in gut microbiota relative to aHSCT, with relation to both gut microbial diversity and the abundance of different bacteria, especially from pre-aHSCT to early post-aHSCT periods. Furthermore, lower gene richness as well as a lower abundance of Blautia and A muciniphila early post-aHSCT were associated with the subsequent development of aGVHD. These microbial risk factors were also strongly associated with conditioning: those who underwent myeloablative conditioning had lower gene richness and lower abundance of Blautia and A muciniphila.
Previous studies have described a decline in gut microbial diversity within the early posttransplantation period, with an increase of, and in certain patients a dominance of, Enterococcus,22,42-46 Streptococcus,22,43,44 Lactobacillus,22,44 or Staphylococcus44,47 (among others). We found a similar pattern, but because of the depth of our data, we could also observe that the driving species within these dominating genera were E faecium, S thermophilus, L delbrieckii, and S epidermidis. With our shotgun metagenomic data, we could also assess gene richness (the number of unique genes) and the potential metabolic richness (the number of metabolic pathways), data which have not previously been investigated in aHSCT patients. Here, we found that these diversity measures, similar to the 16S rRNA gene-based diversity measures, decrease post-aHSCT. However, metabolic richness seems to recover after the first month post-aHSCT.
When examining microbial factors associated with the development of aGVHD, we found that early post-aHSCT (1-28 days) seems to be a crucial period for gut microbiota in relation to later aGVHD development. Earlier studies have described that lower diversity within the first weeks after aHSCT or close to engraftment is associated with aGVHD,18,47,48 aGVHD severity,19 and aGVHD-related mortality.20 In our study, gene richness was the sole diversity measure that was significantly associated with the development of aGVHD. A decrease in gene richness could imply a general loss of bacteria but may also describe a loss of complexity in the remaining bacteria. When delving further into our gene analysis, we found that 1 gene, with the highest log2 fold-change across both pre-aHSCT and early post-aHSCT periods, encodes a ζ toxin known to be used by pathological bacteria for autolysis.49,50 This novel finding requires validation in future cohorts.
In addition to lower diversity, a lower abundance of Blautia and A muciniphila was also associated with the development of aGVHD early post-aHSCT. Blautia has previously been associated with aGVHD in only 1 other study18 ; however, there have been associations with aGVHD severity19 and aGVHD-associated mortality.20 Here, we were able to confirm the association of Blautia with later development of aGVHD. A muciniphila was also found to be protective in our cohort. Previous literature has suggested an opposite effect.51 However, this could be the result of methodologic differences because the results from the aforementioned study were based on murine models at the time of aGVHD. In addition, studies focusing on other diseases have described a protective or anti-inflammatory effect of A muciniphila.52,53
There have been several other bacteria found to be associated with aGVHD in previous studies,18-20,42,54 although few have been validated more than once. These inconsistent findings could be a result of different taxonomy levels applied, unclear preprocessing quality steps, inclusion of samples after the outcome in question, and/or undefined statistical or bioinformatic methods. Finally, given the number of bacteria assessed and the small sample sizes used in microbiome studies, there is a substantial risk of false positives.
To overcome these issues, we have used samples only from before aGVHD diagnosis and in an early period posttransplant. Furthermore, we have chosen to first validate potential bacteria on the basis of previous studies. Then, we used a discovery method to assess bacteria at genera and species levels by combining 2 types of testing to provide the first shotgun-based associations with a clearly defined phenotype. Blautia and A muciniphila were found to be consistently associated with aGVHD in both hypothesis-based and discovery methods, leading us to believe that these findings are robust. This does not exclude that the genus Campylobacter found solely through our discovery method nor E faecium from our hypothesis-based testing may be involved in the development of, or associated with, aGVHD. However, these bacteria need to be validated in independent cohorts.
Among the clinically significant factors associated with aGVHD from our study, conditioning was also significantly associated with microbial factors, and patients undergoing the more intensive myeloablative treatment developed significantly lower diversity and lower abundance of Blautia and A muciniphila, the 3 microbial factors associated with aGVHD. Associations between conditioning and the microbiome in the literature are inconsistent, with conflicting data on microbiome diversity and conditioning intensity.18,44 This could reflect the variation in conditioning types and regimens between centers. At our center, we use a low-dose truly nonmyeloablative regimen and an intensive myeloablative regimen; therefore, there may be larger differences in treatment intensity between myeloablative and nonmyeloablative conditioning regimens at our center compared with others. Myeloablative and nonmyeloablative conditioning regimens also receive different prophylactic antibiotics and could potentially receive different amounts of broad-spectrum antibiotics. Unfortunately, we did not have access to the exact dose and type of antibiotics administered in our cohort. Different antibiotic usage could be a confounding factor for microbial differences between groups. However, regardless of the cause, the results presented in this article show that conditioning affects the gut microbiome post-aHSCT, including the specific microbiome factors that are associated with aGVHD (gene richness, Blautia, and A muciniphila).
What is not clear from our results is whether myeloablative conditioning modulates risk of aGVHD through alteration of the microbiome or whether the changes in the microbiome are merely bystander affects. However, it is not inconceivable that a lower gene richness would promote a more inflammatory enterotype conducive to aGVHD. Although it is difficult to pinpoint what a healthy microbiome is, previous studies have shown that less rich microbiome profiles are associated with increased inflammation55,56 and that a general loss of diversity can negatively affect immunity.57,58 Therefore, in our cohort, the less rich microbiome observed after the intense myeloablative conditioning could be driving a pro-inflammatory environment, increasing risk of aGVHD through either bacterial or metabolite translocation or cross talk between bacteria in the gut and the gut mucosal immune cells. Blautia is known to be involved in butyrate production,59 which is important for inducing regulatory T cells,60 reducing inflammatory responses,61 and aiding the gut barrier through being an important energy source for enterocytes.62 Therefore, a decrease of Blautia could lead to a more inflammatory gut with less healthy enterocytes and thereby an increased risk of aGVHD.
Limitations of this study include the collection of samples from a single center. However, our clinical practices are generally comparable to others, and we have a large cohort with complete ascertainment of aGVHD. Because this is the first study among adult aHSCT recipients that uses shotgun metagenomic sequencing, we are also limited in comparison to other studies. However, we have used a conservative statistical approach and have been clear when describing discovery- or hypothesis-driven results, and therefore we believe our findings are robust.
In conclusion, we found that microbiome factors, including lower gene richness and lower abundance of the bacteria Blautia and A muciniphila were associated with a higher risk of aGVHD in a large aHSCT cohort by using shotgun metagenomic sequencing. We also observed that these same microbial factors were associated with more intense conditioning, highlighting the susceptibility of the gut microbiome to changes induced by aHSCT–associated treatments. However, further studies are required to determine whether the associations between microbial factors and aGVHD are being mediated through conditioning or whether these changes are directly involved in the pathogenesis of aGVHD.
The data sets generated and analyzed during this study are derived from patients treated in Denmark. The data sets contain sensitive patient data governed by General Data Protection Regulation and Danish law. Because of Danish legislation (Act No. 502 of May 23, 2018) and approvals granted by the Danish Data Protection Agency, it is not possible to upload raw data to a publicly available database. However, access to these data can be made available from the corresponding author (Emma E. Ilett at emma.elizabeth.ilett.01@regionh.dk) on reasonable request, provided a data transfer agreement is entered into according to current regulations.
Acknowledgments
Members of the Germans Trias i Pujol Research Institute (IGTP) Genomics and Bioinformatics Core Facilities (Maria Pilar Armengol, Lauro Sumoy, and Iñaki Martínez) helped with the metagenomic sequencing of samples. Those at the PERSIMUNE biobank at Rigshospitalet (Erik Sørensen, Betina Poulsen, and Charlotte Matthews) helped organize and collect the samples. The staff and patients in the Hematology Department at Rigshospitalet were essential for this study as they provided the samples for our research.
This study was funded by grants from the Danish Research Foundation (DNRF126), the Lundbeck Foundation (R218-2016-1482), the Danish Cancer Society (R167-A108665-17-S2), Novo Nordisk Foundation (NNF15OC0014158), and the Svend Anderson Foundation. IrsiCaixa is supported by a grant from the Red de Sida (RD16/0025/0041) co-financed by the Instituto de Salud Carlos III (ISCIII) and the European Regional Development Fund (ERDF) “Investing in your future.”
None of the funding bodies had any influence on designing the study, collecting, analyzing, or interpreting the data, or writing the manuscript.
Authorship
Contribution: H.S., J.L., J.R., D.D.M., M.H., M.N.-J., C.M., and E.E.I. designed the study; M.N.-J. and R.P. performed the sequencing; M.J., M.N.-J., C.M., and E.E.I. wrote the computer pipeline; J.R., H.S., J.L., M.J., M.N.-J., C.M., D.D.M., R.P., and E.E.I. contributed to the framework and statistical plan of the study; E.E.I. wrote the first draft of the article; M.J. and J.R. contributed to creating the figures; H.S. and J.R. jointly supervised the study; and all authors made substantial contributions to the analysis of data, were involved in drafting the manuscript, and have read and approved the final manuscript.
Conflict-of-interest disclosure: The authors declare no competing financial interests.
Correspondence: Emma E. Ilett, PERSIMUNE Centre of Excellence, Rigshospitalet, Øster Allé 56, 2100 Copenhagen, Denmark; e-mail: emma.elizabeth.ilett.01@regionh.dk.

