

Key Points
Idasanutlin treatment of patients with PV promotes expansion of TP53 mutant subclones.
After cessation of idasanutlin treatment, the majority of TP53 mutant clones stabilize and decrease in size.

Abstract
Activation of the P53 pathway through inhibition of MDM2 using nutlins has shown clinical promise in the treatment of solid tumors and hematologic malignancies. There is concern, however, that nutlin therapy might stimulate the emergence or expansion of TP53-mutated subclones. We recently published the results of a phase 1 trial of idasanutlin in patients with polycythemia vera (PV) that revealed tolerability and clinical activity. Here, we present data indicating that idasanutlin therapy is associated with expansion of TP53 mutant subclones. End-of-study sequencing of patients found that 5 patients in this trial harbored 12 TP53 mutations; however, only 1 patient had been previously identified as having a TP53 mutation at baseline. To identify the origin of these mutations, further analysis of raw sequencing data of baseline samples was performed and revealed that a subset of these mutations was present at baseline and expanded during treatment with idasanutlin. Follow-up samples were obtained from 4 of 5 patients in this cohort, and we observed that after cessation of idasanutlin, the variant allele frequency (VAF) of 8 of 9 TP53 mutations decreased. Furthermore, disease progression to myelofibrosis or myeloproliferative neoplasm blast phase was not observed in any of these patients after 19- to 32-month observation. These data suggest that idasanutlin treatment may promote transient TP53 mutant clonal expansion. A larger study geared toward high-resolution detection of low VAF mutations is required to explore whether patients acquire de novo TP53 mutations after idasanutlin therapy.
Introduction
Dysregulation of the P53 pathway is a common mechanism underlying the development and evolution of hematologic malignancies.1 TP53 mutations are prevalent in therapy-related myeloid neoplasms and have been associated with alkylating agents and other cytotoxic therapies.2,3 The disruption of P53 activity can also result from alterations in P53 regulatory proteins, most notably MDM2, a negative regulator of P53.
Small molecule inhibitors of MDM2, termed nutlins, are currently being evaluated for the treatment of TP53 wild-type myeloid malignancies, with promising results. Nutlins occupy the P53-binding site in MDM2 and block P53–MDM2 interactions, resulting in stabilization and activation of P53 and subsequent growth arrest or apoptosis.4 There are concerns that these agents may induce new TP53 mutations or promote progressive and irreversible expansion of preexisting TP53 mutant clones, potentially leading to disease progression.5 Notably in this regard, resistance to MDM2 inhibitors has been observed in solid tumor cell lines and has been attributed to either the emergence of de novo TP53 mutations or selection of TP5 mutant clones.6,7 The mono- and bi-allelic mutations of TP53 have been linked to poor therapeutic responses, poor patient outcomes, and decreased overall survival.3,8,9
We have previously shown that MDM2 is upregulated in PV CD34+ cells and that nutlins selectively target PV hematopoietic stem/progenitor cells.10,11 We recently reported the results of a phase 1 trial of the MDM2 antagonist idasanutlin in patients with PV.12 Idasanutlin was well tolerated and led to a high overall response rate. In that study, next-generation sequencing (NGS) revealed that 1 of 12 treated patients had a hotspot TP53 mutation (p.R248W) with a baseline VAF of 5.5%. This patient was a nonresponder to idasanutlin. The current study reports data showing that idasanutlin therapy promotes transient clonal expansion of TP53 mutant subclones. Idasanutlin seems to provide a selective advantage for the associated hematopoietic stem/progenitor TP53 mutant subclones and facilitates their subsequent expansion, which appears to be reversible.
Methods
Sequencing
Sequencing was performed by using a targeted sequencing panel, including 156 genes associated with hematologic malignancies, as previously described.8 Libraries were sequenced on an Illumina HiSeq 2500 with 2 × 125 bp paired-end reads with an average depth of ∼940×.13-15 Sequencing reads were aligned to human genome (hg19) using BWA-MEM algorithm (v. 1-14-0),16 and data quality was assessed by using FastQC.17
Identification of substitutions and small insertion/deletions
Mutations were called by using CAVEMAN (1.7.4),18 Mutect (4.0.1.2),19 Strelka (2.9.1),20 and PINDEL (1.5.4)19,21 and were subsequently annotated with Ensembl Variant Effect Predictor (version 86)22 and OncoKb.23 A subset of all candidate mutations that passed confidence criteria or matched a known somatic mutation were retained for manual review. The variants presented in this study are those that were identified as pathogenic or likely pathogenic. For postcessation samples, NGS was performed on patient specimens at variable times after the cessation of idasanutlin therapy by Genoptix using a panel of 237 genes with an average mean sequencing depth of 500×. One patient (patient 2) was followed up at the Hôpital Saint-Louis (by B.C.) with a capture-based NGS panel from Sophia Genetics (with 36 genes). Median sequencing depth of the provided results was 3302 reads (ranging between 2183 and 5107 reads).
Copy number analysis
We used the CNACS algorithm to assess copy number alterations based on NGS sequencing data.14 This algorithm is optimized for targeted assays and uses a panel of normals for allele-specific detection of copy number changes as well as regions of copy number neutral loss of heterozygosity (LOH).
Cytogenetic analysis
Chromosomal analysis was performed on direct and 24-hour cultured peripheral blood or bone marrow cells as described previously.24 All cytogenetic Wright-Giemsa stained slides were scanned for metaphases using a Leicas GSL scanner (Leica Microsystems Inc, Buffalo Grove, IL), and high-resolution metaphases were captured for analysis by using CytoVision software (Leica Microsystems Inc). The clonality criteria and the description of karyotypes followed the recommendations of the 2016 International System for Human Cytogenomic Nomenclature.25
Clonality analysis
The VAFs of oncogenic/likely mutations were corrected for copy number aberrations and LOH, and subsequently converted to estimates of cancer cell fractions (CCFs).26,27 The fish plot package of R was used to visualize mutation clonality and to investigate the tumor evolution during the treatment timeline.28
Long-term bone marrow cultures
Long-term bone marrow cultures (LTBMCs) with preformed adherent stromal layers were conducted as previously described.29 Mononuclear cells from 6 PV patients without known TP53 mutations were cultured with and without the addition of idasanutlin (500 nM) for 6 weeks. DNA from hematopoietic colonies present in the nonadherent cell fraction of these LTBMCs were plucked and pooled and then analyzed for TP53 mutations using NGS (limit-of-detection [LOD]) of 2% VAF).
The Mount Sinai School of Medicine institutional review board approved the request for a waiver of authorization for use and disclosure of protected health information (PHI) for this project on 24 January 2020. This request was reviewed and approved via expedited review procedures. The institutional review board determined that the waiver of authorization satisfies the following criteria: (1) the use or disclosure of PHI involves no more than a minimal risk to the privacy of individuals, based on, at least, the presence of (a) an adequate plan to protect the identifiers from improper use and disclosure, (b) an adequate plan to destroy the identifiers at the earliest opportunity consistent with the conduct of research, unless there is a health or research justification for retaining the identifiers or such retention is otherwise required by law, and (c) the Principal Investigator has provided adequate written assurances that the PHI will not be reused or disclosed to any other person or entity, except as required by law, for authorized oversight of the research study or for other research for which the use or disclosure of PHI would be permitted by the Privacy Regulations; (2) the research could not practicably be conducted without the waiver; and (3) the research could not practicably be conducted without access to and use of the PHI.
Results
Comparison of idasanutlin-treated patients with and without TP53 mutations
Results of the phase 1 trial of idasanutlin in patients with PV have been previously reported.12 Table 1 summarizes the clinical characteristics of the patients who were found to have TP53 mutant subclones, and Table 2 compares the features of treated patients with and without TP53 mutant subclones. The patients with evidence of TP53 mutant clonal expansion were on the trial longer (77.4 weeks) compared with the median duration of study for those without TP53 mutations (54.2 weeks). Patients with TP53 mutant subclones were more likely to have experienced more cycles of therapy and to have received higher doses of idasanutlin, possibly indicating that dose dependence exists in the expansion of TP53 mutant subclones. All patients except one in each group had previous exposure to hydroxyurea.
Summary of clinical feature of patients with PV treated with idasanutlin with TP53 mutant clones
| Patient | Age, y | Sex | Time on study, wk | No. of TP53 mutations | Clinical response | Prior therapy |
|---|---|---|---|---|---|---|
| 1 | 68 | Female | 105.1 | 1 | PR | HU, IFN |
| 2 | 48 | Male | 85.1 | 5 | PR | IFN |
| 3 | 52 | Female | 90.9 | 1 | CR | HU |
| 4 | 65 | Male | 70.1 | 3 | CR | HU |
| 5 | 83 | Female | 37.1 | 2 | NR | HU |
Clinical responses were assessed by using European LeukemiaNet criteria.
CR, complete response; HU, hydroxyurea; IFN, interferon; NR, no response; PR, partial response.
Comparison of idasanutlin trial patients with and without TP53 mutations
| Characteristic | Presence of TP53 mutation | |
|---|---|---|
| No (n = 7) | Yes (n = 5) | |
| Age, y | ||
| Mean ± SD | 57.1 ± 13.50 | 63.9 ± 13.74 |
| Median | 61.7 | 65.6 |
| Range | 32.8, 69.5 | 49.0, 83.8 |
| Initial diagnosis, n (%) | ||
| Essential thrombocythemia | 1 (14.3) | 0 (0.0) |
| PV | 6 (85.7) | 5 (100.0) |
| Sex, n (%) | ||
| Female | 4 (57.1) | 3 (60.0) |
| Male | 3 (42.9) | 2 (40.0) |
| Disease duration (before study), mo | ||
| Mean ± SD | 58.9 ± 32.43 | 58.6 ± 54.58 |
| Median | 60.9 | 43.9 |
| Range | 14.9, 94.2 | 21.0, 154.3 |
| HU intolerance/resistance, n (%) | ||
| HU-intolerant | 5 (71.4) | 3 (60.0) |
| HU-resistant | 1 (14.3) | 1 (20.0) |
| No exposure | 1 (14.3) | 1 (20.0) |
| Planned dose cohort, n (%) | ||
| 100 mg | 5 (71.4) | 1 (20.0) |
| 150 mg | 2 (28.6) | 4 (80.0) |
| Cycles, n | ||
| N | 5 | 12 |
| Mean ± SD | 9.3 ± 3.20 | 14.4 ± 4.28 |
| Median | 9 | 14 |
| Range | 5.0, 14.0 | 9.0, 20.0 |
| Duration on study,wk | ||
| Mean ± SD | 52.4 ± 38.36 | 77.7 ± 25.86 |
| Median | 36.3 | 85.1 |
Mutational analysis of idasanutlin-treated patients
Mutational analyses of the trial patients revealed that in addition to the aforementioned TP53-mutated patient reported in Mascarenhas et al,12 an additional 4 patients harbored a newly recognized somatic TP53 mutation at the end of the idasanutlin trial time point. Further analysis of these 5 patients identified 26 oncogenic or likely oncogenic mutations in 9 cancer-related genes in addition to TP53, including DNMT3A and ASXL1. As denoted in Figure 1, the number of somatic mutations per patient ranged between 2 and 7 (median, 5). JAK2V617F was present in all patients. In addition, 4 of 5 patients also had copy number-neutral LOH of 9p that includes the JAK2 gene, resulting in bi-allelic mutation of JAK2 in 75% of this cohort.
![Genomic profile of somatic mutations, copy number variants (CNVs), and LOH in all samples during idasanutlin therapy. The columns (n = 14) indicate samples for each patient, from baseline to the last evaluable time point in the therapy (4-33 months), sorted according to the patient’s number and his or her timeline samples (eg, patient_1 baseline, C7D1, cycle 19 day 1 [C19D1]). Each row in the top panel (“Substitutions/Indels”) represents a gene that is mutated (n = 10). In the middle panel, each row represents the results of cytogenetic analysis of each related samples. Samples that had no cytogenetic analysis are highlighted by gray color (N_E). The bottom panel indicates CNAC-detected aberration (all LOH) events. The upper bar plot indicates the number of somatic mutation(s) per sample, colored according to the type of the detected mutation, as denoted in the legend. The right bar plot shows the number of somatic mutations per gene or copy number and LOH event. The frequency of mutations in the entire cohort (14 samples) is listed on the left border of the figure. cnLOH, copy number neutral LOH.](https://ash.silverchair-cdn.com/ash/content_public/journal/bloodadvances/4/22/10.1182_bloodadvances.2020002379/2/m_advancesadv2020002379f1.png?Expires=1765965605&Signature=gC-b50l3TpDByPIOh3pg5wyUYyL35TiVqnGF5Jgmgl~xzhKSUdc4yK0BeRfb9cmfQzQJrKiG8HCfz0oQPtxy8hgYxx8PWwh8TlILHwE~GDOS5WQDFeiLh3FmtI9u3xZUtFVrLcTjHdc9Dh9Ifb~SMrBXvXOepehwZjkB4IavSaB~LpNbZsswR3Q6GcR8gcouW6F8oApnwcuW8gw3Fr-yN-OxTES-iTISeDBGnWelZ7ydWvMLkMaYrLqDOlIwdJQEzQADQHCxwxDW6tpdDFR4ifVB1S75YVLBM34D75SAq0eTwvgtrbFlz-Ubb-oMdzRKeqXHlnViPdXy2nWtPCDaHA__&Key-Pair-Id=APKAIE5G5CRDK6RD3PGA)
Genomic profile of somatic mutations, copy number variants (CNVs), and LOH in all samples during idasanutlin therapy. The columns (n = 14) indicate samples for each patient, from baseline to the last evaluable time point in the therapy (4-33 months), sorted according to the patient’s number and his or her timeline samples (eg, patient_1 baseline, C7D1, cycle 19 day 1 [C19D1]). Each row in the top panel (“Substitutions/Indels”) represents a gene that is mutated (n = 10). In the middle panel, each row represents the results of cytogenetic analysis of each related samples. Samples that had no cytogenetic analysis are highlighted by gray color (N_E). The bottom panel indicates CNAC-detected aberration (all LOH) events. The upper bar plot indicates the number of somatic mutation(s) per sample, colored according to the type of the detected mutation, as denoted in the legend. The right bar plot shows the number of somatic mutations per gene or copy number and LOH event. The frequency of mutations in the entire cohort (14 samples) is listed on the left border of the figure. cnLOH, copy number neutral LOH.
Genomic profile of somatic mutations, copy number variants (CNVs), and LOH in all samples during idasanutlin therapy. The columns (n = 14) indicate samples for each patient, from baseline to the last evaluable time point in the therapy (4-33 months), sorted according to the patient’s number and his or her timeline samples (eg, patient_1 baseline, C7D1, cycle 19 day 1 [C19D1]). Each row in the top panel (“Substitutions/Indels”) represents a gene that is mutated (n = 10). In the middle panel, each row represents the results of cytogenetic analysis of each related samples. Samples that had no cytogenetic analysis are highlighted by gray color (N_E). The bottom panel indicates CNAC-detected aberration (all LOH) events. The upper bar plot indicates the number of somatic mutation(s) per sample, colored according to the type of the detected mutation, as denoted in the legend. The right bar plot shows the number of somatic mutations per gene or copy number and LOH event. The frequency of mutations in the entire cohort (14 samples) is listed on the left border of the figure. cnLOH, copy number neutral LOH.
We detected 12 TP53 mutations in 9 distinct loci in these 5 patients after treatment, ranging from 1 to 5 independent TP53 mutation(s) per patient. There were only 2 recurrent TP53 mutations in this cohort, both present in the R248 codon. The recurrent R248Q and R248W mutations were observed in 3 and 2 patients, respectively. It must be noted that TP53 amino acid residue R248 is a known somatic hotspot that leads to acquisition of new oncogenic functions (gain-of-functions).8,30 The gain-of-function mutations in TP53 are highly associated with progressive disease and drug resistance.30,31 All other detected TP53 mutations have also previously been reported to be involved in tumorigenesis (Figure 2; supplemental Table 1).8,30,32-34
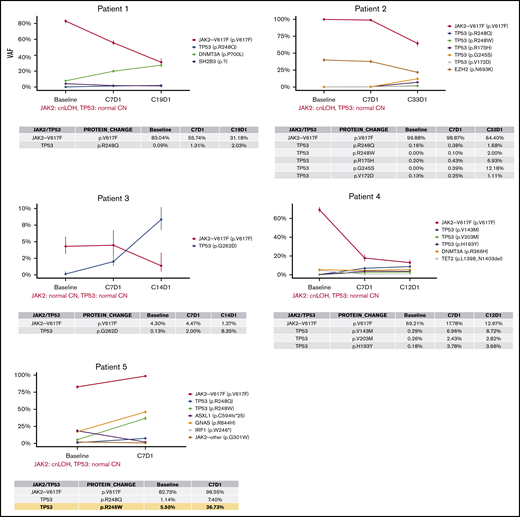
Timeline profile of somatic mutations during idasanutlin therapy. Each panel depicts the VAF of somatic mutations in baseline and subsequent samples up to the last evaluable treatment time point during the therapy (4-33 months). The table below each graph details the VAFs of JAK2V617F and somatic TP53 mutations at each time point. The confidence intervals are calculated based on the sequencing depth at each locus, which are also listed in supplemental Table 1. In the data table for patient 5 (bottom left), the yellow highlights the largest increase in TP53 mutation VAF during the treatment that was observed in the cohort (R248W, ∼5.6 fold increase from baseline to C7D1). cnLOH, copy number neutral LOH.
Timeline profile of somatic mutations during idasanutlin therapy. Each panel depicts the VAF of somatic mutations in baseline and subsequent samples up to the last evaluable treatment time point during the therapy (4-33 months). The table below each graph details the VAFs of JAK2V617F and somatic TP53 mutations at each time point. The confidence intervals are calculated based on the sequencing depth at each locus, which are also listed in supplemental Table 1. In the data table for patient 5 (bottom left), the yellow highlights the largest increase in TP53 mutation VAF during the treatment that was observed in the cohort (R248W, ∼5.6 fold increase from baseline to C7D1). cnLOH, copy number neutral LOH.
Subsequent reanalysis of raw sequencing data of baseline samples from these same patients revealed that 2 (16%) of 12 mutations were not previously detected in baseline samples (patient 2, R248W and V172D), 2 of 12 (16%) were present at baseline with VAFs >1% (patient 5: 248Q with 1.1% and 248W with 5.5%), and 8 (67%) of 12 mutations were present at very low allele burden (VAFs <1%, patients 1-4). In the latter group (<1%), a minor TP53 mutant subclone may have already existed and was subsequently expanded during the idasanutlin treatment; however, due to the limitations associated with detection sensitivity, we cannot be certain of the presence or absence of these mutations. We also detected no evidence that supported the presence of 2 other TP53 mutations before treatment that were observed at the end of the study with VAFs of 2% (R248W) and 12% (G245S); these mutations may have either arisen de novo during the therapy or were not detected at baseline due to LOD.
All these aforementioned TP53 mutation VAFs showed a relative increase during the course of treatment (Figure 2). Collectively, these data reveal that the average somatic TP53 mutation VAFs from baseline to the last evaluable point during the treatment (4-33 months) increased from 0.1% (0% to 5.5%) to 7.8% (1.1% to 36.7%), respectively. The most significant increase was observed in patient 5, who we had previously reported to harbor an R248W mutation at baseline (VAF = 5.5%).12 The analysis of the data at cycle 7 day 1 of therapy (C7D1) revealed a second TP53 mutation on the same codon (R248Q, VAF = 7.4%) in this patient. Tracing back R248Q mutation, we determined that it was also present with 1.1% VAF in the baseline sample (depth = 963). The VAF of both of these hotspot mutations of the R248 codon increased by more than fivefold by C7D1 and reached 7.4% (R248Q) and 36.7% (R248W), respectively. It must be noted that this patient was also the only individual in this cohort who exhibited primary resistance to idasanutlin.
Analysis of TP53 mutation allele burden after cessation of idasanutlin therapy
From the 5 patients in this study, 4 were available for resequencing 4 to 14 months after discontinuation of idasanutlin (patients 1, 2, 3, and 5). The data presented in Figure 3 revealed that after cessation of idasanutlin, 8 of the 9 TP53 mutations decreased in VAF after the study ended, with 1 returning to baseline and 4 below the baseline levels. The TP53 mutation VAF found in patient 1 was 2% at the end of study but was 3% seven months after discontinuation of the drug. Additional evaluations at more distant times from idasanutlin cessation will be required to determine the fate of this subclone. For patient 2, there were multiple time points of sequencing after cessation of idasanutlin, which allowed us to observe that the VAF of all 5 mutations decreased over time; by 9 months postcessation, 3 TP53 mutations were undetectable. Importantly, the reduction of VAF was also observed in patient 5 (who had clinical resistance to idasanutlin) and who had the largest increase in TP53 mutant subclones during the treatment (fivefold increase). The R248W mutation VAF initially increased to ∼37% with idasanutlin therapy (C7D1), but 20 months after discontinuation of the drug, the R248W VAF was 5%. The second R248 hit in this patient (R248Q), which was detected at 7.4% at CD71, was at VAF 0.21% at 20-month follow-up.
![Timeline VAF profile of JAK2V617F and TP53 mutants from baseline to follow-up. The panels present the timeline profile of JAK2V617F and TP53 mutations throughout the entire study for 4 patients who were available for follow-up. The VAF estimates (y-axis) during therapy are according to data from Memorial Sloan Kettering Cancer Center (International Working Group [IWG] panel), and the follow-up data are either from Genoptix (patients 1 and 3-5) or Saint-Louis Hospital (patient 2). The VAF error bars denote the confidence intervals as estimated by the sequencing depth (where available). The details of VAFs and depth at these mutation loci are presented in supplemental Table 1.](https://ash.silverchair-cdn.com/ash/content_public/journal/bloodadvances/4/22/10.1182_bloodadvances.2020002379/2/m_advancesadv2020002379f3.png?Expires=1765965605&Signature=kft5C3ghqgNpqNJNhLcZOUjqwHYaRB3x77H75rr~X109ankCu6N84NhHkFJZnlQB~eQwqM9p8hc7qF5XMNDMAoBwukArwfWyXXLLQj-nQfpMtkYxYvtnI2F6YbI-Qqp~mvCLXZa~XuWgdWUiHqT6MU7KAk38yy3IKedPdcMebJ1XDaUInX67RQQFiZ2ohJoD1OIN1cvHcKYMjnWw~HVjlYJQPMCjqpHOyJAwie4R4V7JaPnvU98o9uRI07lTSTRuAX9MZPJ~lkvmk6V53vAY2VM2w7sirqqG-DvbSNE-JjKflUSD2-~V6SHpEiG1gXqJ2OkNLicpVVO290iQbAWjWQ__&Key-Pair-Id=APKAIE5G5CRDK6RD3PGA)
Timeline VAF profile of JAK2V617F and TP53 mutants from baseline to follow-up. The panels present the timeline profile of JAK2V617F and TP53 mutations throughout the entire study for 4 patients who were available for follow-up. The VAF estimates (y-axis) during therapy are according to data from Memorial Sloan Kettering Cancer Center (International Working Group [IWG] panel), and the follow-up data are either from Genoptix (patients 1 and 3-5) or Saint-Louis Hospital (patient 2). The VAF error bars denote the confidence intervals as estimated by the sequencing depth (where available). The details of VAFs and depth at these mutation loci are presented in supplemental Table 1.
Timeline VAF profile of JAK2V617F and TP53 mutants from baseline to follow-up. The panels present the timeline profile of JAK2V617F and TP53 mutations throughout the entire study for 4 patients who were available for follow-up. The VAF estimates (y-axis) during therapy are according to data from Memorial Sloan Kettering Cancer Center (International Working Group [IWG] panel), and the follow-up data are either from Genoptix (patients 1 and 3-5) or Saint-Louis Hospital (patient 2). The VAF error bars denote the confidence intervals as estimated by the sequencing depth (where available). The details of VAFs and depth at these mutation loci are presented in supplemental Table 1.
Analysis of TP53 mutant and JAK2V617F subclones
By using a CNACS allele-specific copy-number algorithm, we discovered that 4 of 5 patients harbored JAK2 LOH at baseline and end-of-study samples, highlighting that 75% of our cohort had bi-allelic JAK2 mutations (supplemental Figure 1). However, none of the patients with TP53 mutations had LOH or other copy number aberrations affecting TP53 locus (17p). To further study the clonality pattern of somatic mutations and investigate clonal dynamics of TP53 and JAK2 mutations, we used copy number and LOH results to convert mutation VAFs to CCFs, the fraction of cancer cells within which the variant is present.26 The CCF and their confidence interval were used to investigate the dynamics of TP53 mutations with respect to JAK2V617F subclones.
The fish plots in Figure 4 illustrate a selected set of possible models for clonal evolution of somatic mutations during the treatment. As previously shown in Figure 1 and also observed in these fish plots, the TP53 mutant in all patients is a minor subclone compared with the JAK2V617F clones. The trend is observed in all samples at baseline and remains the same throughout the treatment in all patients, except patient 3. In this patient, we observed that the allele burden of TP53-G262D surpasses that of JAK2V617F, which responded to therapy with a significant reduction in its JAK2 mutant clone. This is the only case that we can deduce with certainty that these 2 mutations are in completely separate subclones. In patients 1, 2, and 4, two models were presented, one in which the TP53 mutant is a minor subclone embedded in JAK2V617F, and the other in which it is a separate independent subclone. For patient 5, the size of the JAK2-mutated clone (CCF = 100%) implies that the TP53-mutated cells (as well as all other somatic mutations in this patient) are minor subclones that belong to the major JAK2V617F clone. In contrast to the observed expansion of TP53 subclones during idasanutlin therapy, the JAK2V617F subclones were reduced in almost all patients.

Clonal evolution analysis of each of the 5 patients during idasanutlin therapy. Fish plots show the selected models for clonal evolution history of 5 patients during idasanutlin therapy. The width of clones in each time point represents the estimated CCFs of each subclone population. For patient 1 (A-B), patient 2 (C-D), and patient 4 (F-G), two models are shown. The first model presents a scenario in which TP53 mutations are a minor subclone of JAK2V617F (A,C,F), and the second model represents a scenario in which the TP53 mutant and JAK2V617F exist in 2 independent subclones. Patient 3 (E) is the only patient whose data imply the existence of 2 independent TP53- and JAK2V617–mutated subclones. Patient 5 (H) is the only patient in whom mutated TP53 is unequivocally a subclone of the JAK2V617F founder clone. It must be noted that due to the relatively small number of somatic mutations in each sample, there are multiple models per patient, and the models presented are selected solely based on the relationship of TP53 and JAK2 mutations.
Clonal evolution analysis of each of the 5 patients during idasanutlin therapy. Fish plots show the selected models for clonal evolution history of 5 patients during idasanutlin therapy. The width of clones in each time point represents the estimated CCFs of each subclone population. For patient 1 (A-B), patient 2 (C-D), and patient 4 (F-G), two models are shown. The first model presents a scenario in which TP53 mutations are a minor subclone of JAK2V617F (A,C,F), and the second model represents a scenario in which the TP53 mutant and JAK2V617F exist in 2 independent subclones. Patient 3 (E) is the only patient whose data imply the existence of 2 independent TP53- and JAK2V617–mutated subclones. Patient 5 (H) is the only patient in whom mutated TP53 is unequivocally a subclone of the JAK2V617F founder clone. It must be noted that due to the relatively small number of somatic mutations in each sample, there are multiple models per patient, and the models presented are selected solely based on the relationship of TP53 and JAK2 mutations.
Clinical follow-up
Four of the 5 patients with TP53 mutations were observed since ending their participation in the idasanutlin trial. These patients exhibited no clinical evidence of progression to myelofibrosis or myeloproliferative neoplasm (MPN) blast phase 19 to 32 months after discontinuation of idasanutlin therapy. Three of the four patients have had stable peripheral blood counts, with no evidence of peripheral blood blasts and enlargement of spleen size. One patient has developed a leukocytosis with <5% blasts in the peripheral blood (patient 2). This patient at end of study had developed a complex karyotype, providing evidence of clonal cytogenetic evolution (Figure 2). Alternate therapies for PV (including phlebotomy, hydroxyurea, interferon, and ruxolitinib in 3 of these patients) were implemented, which could confound their clinical outcomes results. We did not have access to follow-up histopathologic or cytogenetic data. At this time, due to the limited number of patients being studied and minimal length of follow-up, the prognostic significance of the TP53 mutations observed in these patients remains uncertain.
LTBMC of PV hematopoietic cells with idasanutlin
To investigate whether idasanutlin might induce de novo TP53 mutations, we performed LTBMC with PV patient CD34+ cells cultured with and without idasanutlin for 6 weeks. In the clinical trial, patients were treated with idasanutlin for the first 5 days of each month cycle. Therefore, continuous treatment of CD34+ cells with idasanutlin for 6 weeks would be equivalent to 8.4 months of idasanutlin therapy. Hematopoietic colonies at week 6 of the LTBMCs were plucked, cloned, and pooled. Sequencing with a sensitivity of 2% VAF was performed on DNA from colonies pooled from idasanutlin-treated and untreated PV CD34+cell–initiated LTBMCs, and revealed no evidence of TP53 mutations. Thus, direct exposure of MPN CD34+ cells to idasanutlin in culture did not provoke de novo TP53 mutations that could be detected at a sensitivity of 2% VAF.
Discussion
Low allelic-burden TP53 mutations have been reported in ∼15% of patients with chronic MPN.35 However, the specificity of these mutations to MPN is confounded by the fact that TP53 is a frequently mutated gene in clonal hematopoiesis of indeterminate potential (CHIP).36 Clonal hematopoiesis is a consequence of hematopoietic stem cells acquiring somatic mutations. CHIP increases with age and is associated with an increased risk of hematologic neoplasms such as myelodysplastic syndrome, MPN, and acute myeloid leukemia.37 Previous studies have reported rapid expansion of TP53 mutations and TP53 LOH associated with evolution to MPN blast phase, with 17% to 19% of MPN blast phase patients having TP53 mutations.38 Thus, exposure to idasanutlin therapy may have served to uncover or expand CHIP-related mutations, or to induce subclones with the potential to expand and ultimately cause disease progression upon acquisition of other mutations.
Previous studies have evaluated resistance mechanisms developed by solid malignancies treated with MDM2 inhibitors. The presence of a TP53 mutation is considered to be a main resistance mechanism, although there are conflicting data as to whether MDM2 inhibition induces formation of de novo TP53 mutations or promotes expansion of these low-lying mutant subclones. Here, we report that in PV, idasanutlin therapy promotes expansion of TP53 mutant subclones, with our results indicating that a hotspot TP53 mutation (R248W) detected with ∼37% VAF at the end of idasanutlin therapy was present at baseline with 5.5% VAF. Another hotspot with a VAF (R248Q) mutation was also detectable at baseline at 1.1% VAF.
From the remaining mutations detected at end of study, 8 may have been present at baseline with very low VAF (<1%). Evidence that supported the presence of 2 other TP53 mutations that were observed at the end of study with 2% (R248W) and 12% (G245S) were not present before treatment and VAFs decreased to 0% and 2% respectively. The latter mutations may have been either de novo that arose during the therapy, or were not detected at baseline due to LOD. We also showed that in vitro idasanutlin treatment of PV progenitor cells did not result in occurrence of de novo TP53 mutations. However, it must be noted that the in vitro studies could not directly recapitulate the treatment schedule used in the trial due to experimental limitations and because the LOD sensitivity of these mutations was 2%, and therefore did not exclude the appearance of TP53 subclones with lower VAFs.
It is well known that myeloid malignancies undergo clonal evolution under the selective pressure of chemotherapy. The TP53 mutant cells that appear after cytotoxic therapies have been shown to persist and expand, possibly due to the TP53 mutant clone conferring a survival advantage,39 a scenario that was not observed with idasanutlin therapy. After cessation of idasanutlin, expansion of TP53 mutant subclones ceased and the size of these subclones decreased, some to the point of being undetectable at follow-up. This observation could be due to the TP53 mutations being present exclusively at a progenitor cell level rather than a stem cell level. Progenitor cells and stem cells have extensive proliferative potential, but progenitor cells lack the capacity to self-renew, a quality that is unique to stem cells. In fact, the VAF of the TP53 mutations was reduced with increasing distance from the exposure to idasanutlin, suggesting that the frequency of the mutated progenitors was reduced when the pressure created by idasanutlin was removed. It is currently unknown as to whether the increased TP53 mutation allele burden in the patients treated with idasanutlin will have clinical ramifications. Absence of accompanied LOH for the other allele bearing wild-type TP53 in these patients could explain the lack of progression to myelofibrosis or MPN blast phase thus far. The presence of TP53 mutations and 17p LOH are linked and known to be associated with aggressive tumor biology.9,40
Although the JAK2V617F mutation reportedly instigates homologous recombination and genetic instability, it is unknown whether JAK2V617F can promote TP53 mutation acquisition.41 We have provided evidence that the JAK2V617F and TP53 mutations can either exist in the same clones or originate in distinct clones (Figure 4). This is new information and must be highlighted. Irrespective of their clonal origins, the clinical significance of these idasanutlin-induced perturbations in VAFs has not been apparent; however, the ultimate consequences are still unknown. In >40% of patients with MPN that transforms to acute leukemia, leukemic transformation originates in clones that lack the MPN driver mutation.42 In addition, Beer et al43 has reported that TP53 mutations that occur in MPN blast phase are frequently present in clones that lack a driver mutation. Therefore, patients with the presence of any TP53 mutant subclone will require careful monitoring.
Overall, these data indicate that idasanutlin treatment might be associated with the expansion of prior existing single or multiple TP53 mutations, although the emergence of de novo TP53 mutations cannot be completely excluded. Importantly, the majority of TP53 mutant subclones seem to decrease after the drug is discontinued. The lack of change in clinical behavior of the patient’s underlying PV with increasing allele burden of TP53 mutations might be due to an absence of loss of the second allele encoding the wild-type TP53 that characterized these patients.44 Despite these observations, the consequence of more prolonged inhibition of MDM2 remains unclear. The patients described here will need very close follow-up, and these results will require further investigation and corroboration in much larger cohorts of nutlin-treated PV patients, as well as patients with other MPNs. Presently, there are clinical trials evaluating nutlin therapies in PV, myelofibrosis, and MPN blast phase (NCT03669965, NCT03662126, and NCT04113616). Close monitoring of TP53 mutant subclones, as well as acquired copy number aberration and LOH of wild-type TP53 in these patients, is required to further clarify the clinical implications of our findings.
The sequencing data have been deposited into the BioSample database (accession numbers SAMN14408513, SAMN14408514, SAMN14408515, SAMN14408516, SAMN14408517, SAMN14408518, SAMN14408519, SAMN14408520, SAMN14408521, SAMN14408522, SAMN14408523, SAMN14408524, SAMN14408525, and SAMN14408526).
Acknowledgments
This work was supported by the National Institutes of Health, National Cancer Institute (MPN Research Consortium grant 2PO1CA108671-10A1; and 1K08CA188529-01) (R.K.R.), and Cancer Center Support Grant/Core Grant to Memorial Sloan Kettering Cancer Center (P30 CA008748).
Authorship
Contribution: B.K.M., R.H., N.F., R.K.R., J.-J.K., B.C., and J.M. designed the study and analyzed the results; N.F., R.K.R., E.M., B.C., E.V., E.M., M.P., J.M.-M., M.F.L., J.E.A.O., Y.Z., J.H., and M.M. were involved in sequencing studies; H.K. and A.D. provide statistical support; B.K.M. and M.L. performed LTBMCs; M.R. analyzed sequencing of LTBMC samples; B.K.M, R.H., N.F., and R.K.R. prepared the manuscript; and J.-J.K., J.M., and B.C. edited the manuscript.
Conflict-of-interest disclosure: R.K.R. has received consulting fees from Constellation, Incyte, Celgene, Promedior, CTI, Jazz Pharmaceuticals, Blueprint, Stemline, Galecto, PharmaEssentia; and research funding from Incyte, Constellation, and Stemline. J.-J.K. is on advisory boards for Novartis, Celgene, and AOP Orphan. J.M. has received research funding paid to the institution from Incyte, CTI BioPharma, Roche, Merck, Novartis, Janssen, Promedior, Merus, Arog, and Kartos; and honorarium from Incyte, Roche, Celgene, and Prelude. M.R. is employed by Sema4. The remaining authors declare no competing financial interests.
Correspondence: Ronald Hoffman, Memorial Sloan Kettering Cancer Center, 1 Gustave L. Levy Pl, Box 1079, New York, NY 10029; e-mail: ronald.hoffman@mssm.edu.

