

Key Points
CD200 marks LSCs in AML patient samples expressing CD200 on ≥10% of blasts.
CD200 captures both CD34– and CD34+ LSCs from individual AML patient samples.

Abstract
The leukemia stem cell (LSC) populations of acute myeloid leukemia (AML) exhibit phenotypic, genetic, and functional heterogeneity that contribute to therapy failure and relapse. Progress toward understanding the mechanistic basis for therapy resistance in LSCs has been hampered by difficulties in isolating cell fractions that enrich for the entire heterogeneous population of LSCs within individual AML samples. We previously reported that CD200 gene expression is upregulated in LSC-containing AML fractions. Here, we show that CD200 is present on a greater proportion of CD45dim blasts compared with more differentiated CD45high cells in AML patient samples. In 75% (49 of 65) of AML cases we examined, CD200 was expressed on ≥10% of CD45dim blasts; of these, CD200 identified LSCs within the blast population in 9 of 10 (90%) samples tested in xenotransplantation assays. CD200+ LSCs could be isolated from CD200+ normal HSCs with the use of additional markers. Notably, CD200 expression captured both CD34– and CD34+ LSCs within individual AML samples. Analysis of highly purified CD200+ LSC-containing fractions from NPM1-mutated AMLs, which are commonly CD34–, exhibited an enrichment of primitive gene expression signatures compared with unfractionated cells. Overall, our findings support CD200 as a novel LSC marker that is able to capture the entire LSC compartment from AML patient samples, including those with NPM1 mutation.
Introduction
Acute myeloid leukemia (AML) is organized as a hierarchy sustained by a minor population of leukemia stem cells (LSCs) with self-renewal capacity that drive disease. Although standard chemotherapy for AML can induce remission in as many as 80% of patients, disease relapse and subsequent death are common. There is genetic evidence linking functionally defined LSC subsets present at diagnosis to therapy failure and relapse origin.1 In addition, LSC-specific gene expression programs are associated with survival outcomes across many clinical cohorts.2,3 However, there is also evidence that many LSCs are targeted by common chemotherapy drugs, including cytarabine.4,5 One explanation for these differing findings is the concept that LSCs within an individual patient exhibit considerable heterogeneity and only a subset of LSCs survive therapy and drive relapse. This concept is supported by lineage-tracking studies showing heterogeneity in LSC self-renewal.6 Consequently, it is critical to study the properties of all LSCs within an individual sample to develop therapies to target these disease-sustaining cells and improve patient outcomes.
The LSC compartment in an individual AML patient is composed of multiple clones that may be genetically,7 functionally,8 and immunophenotypically9-11 heterogeneous. Early studies suggested that LSCs in AML were restricted to the CD34+CD38– immunophenotype,12,13 similar to hematopoietic stem cells (HSCs) in the normal hematopoietic hierarchy. However, with the development of more immunodeficient mouse models, LSCs have also been shown to exist within the CD34+CD38+ cell fraction and are sometimes found in the CD34– fraction.2,10,11,14 Furthermore, in approximately one-half of de novo AMLs, CD34 is expressed on <20% of leukemic blasts.15,16 In these cases, the LSC compartment is more likely to comprise only CD34– or both CD34– and CD34+ cells.10,17,18 Therefore, identification of LSC activity in AML based solely on expression of CD34 and CD38 is unreliable, and significant effort has been devoted to discovering novel surface markers that can reliably identify LSC activity in AML patient samples. A number of studies have characterized potential LSC markers.19-29 However, functional experiments to evaluate LSC enrichment have typically focused on CD34+ subpopulations rather than the entire CD45dim leukemic blast population,21,26,28 possibly missing biologically important subclones that are present only in other fractions.
We previously characterized an LSC-specific gene expression signature and identified CD200, encoding an immunoglobulin superfamily member, as a gene that was highly correlated with LSC activity.2,3 CD200 is normally expressed on neurons, endothelium, thymocytes, and populations of B- and T-lymphocytes30 and is involved in regulating immune responses through interaction with its receptor expressed on immune cells.31 In AML, high CD200 expression has been associated with poor clinical outcomes in patients.32-34 Here, we show that cell surface expression of CD200 can be used to identify LSC activity in primary AML samples and enables analysis of samples in which the LSCs exhibit low or variable CD34 expression, including cases with NPM1 mutation.
Methods
Collection and processing of primary AML samples and normal hematopoietic tissues
Blood and bone marrow (BM) samples from newly diagnosed AML patients and BM from healthy adults were collected with informed consent according to procedures approved by the University Health Network (UHN) Research Ethics Board. Cord blood (CB) samples were collected according to procedures approved by the UHN Research Ethics Board and the Research Review Team of Trillium Health Centre. Low-density mononuclear cells (MNCs) from all samples were isolated by Ficoll density centrifugation. Lineage-negative (Lin–) cells were obtained from CB and BM using StemSep column-based isolation (Stemcell Technologies Inc). Mononuclear AML cells and Lin– hematopoietic cells were frozen viably in 40% fetal bovine serum (FBS) with 10% DMSO and thawed before use in cell staining and sorting experiments.
CD200 expression studies
CD200 cell surface expression on primary AML samples was detected using purified rat anti-human CD200 (clone 1B9) conjugated to biotin (EZ-Link Sulfo-NHS-Biotinylation Kit, Catalog #21425). Clone 1B9 was previously characterized35 and was kindly provided by Trillium Therapeutics (TTI). Primary AML cells and Lin– BM and CB MNCs were resuspended in phosphate buffered saline (PBS) containing 5% FBS at a concentration of 2 × 10⁶ cells/mL (AML) or 1 × 10⁶ cells/mL (BM or CB MNCs) for primary surface antibody staining with monoclonal antibodies (mAbs) listed in supplemental Table 1. AML cells were secondarily stained (1:200 dilution) with streptavidin-phycoerythrin (BD Bioscience); Lin– BM and CB MNCs were secondarily stained (1:100 dilution) with streptavidin-Qdot 605 (BD Bioscience). Stained cells were resuspended in PBS containing 5% FBS and propidium iodide. Flow cytometry was performed by using a BD LSRII, and data were analyzed by using FlowJo software. For each AML sample and for one representative Lin– BM and CB sample, a fluorescence minus 1 control for CD200 was included for comparison.
Cell sorting and xenotransplantation studies
Primary AML cells were stained in PBS containing 5% FBS with mAbs listed in supplemental Table 2. AML cells were secondarily stained with streptavidin-phycoerythrin (1:200 dilution) and resuspended in propidium iodide before sorting on a FACS ARIA cell sorter. Sorted cells were washed in PBS, and viable cells were counted by trypan blue exclusion before dilution in PBS. NOD.SCID-IL2Rγnull (NSG) mice were bred and housed at the UHN/Princess Margaret Cancer Centre. Animal experiments were performed in accordance with institutional guidelines approved by the UHN/Princess Margaret Cancer Centre Animal Care Committee. NSG mice (age 8-12 weeks) were sublethally irradiated (225 cGy) 24 hours before intrafemoral injection of sorted AML cells. Human cell engraftment in the murine BM (injected femur and noninjected long bones) was assessed 12 to 14 weeks posttransplantation. The level and type of human engraftment were determined by flow cytometry after staining with the anti-human mAbs listed in supplemental Table 3. Human grafts were considered present if human CD45 (hCD45) positive cells composed >0.1% of total viable BM cells. Grafts were classified as leukemic if ≥90% of hCD45+ cells expressed CD33, or multilineage if the hCD45+ cells contained >10% CD19+ B cells and a population of CD33+ myeloid cells. Leukemic blasts in AML44 were CD45–CD33+CD44+, and thus human engraftment in this sample was detected by hCD44 expression.
Analysis of NPM1 and DNMT3a mutations in lymphoid and myeloid cells from xenografts
Xenografts generated by AML2 and AML7 were stained with mAbs listed in supplemental Table 3 before sorting on a FACS ARIA. Human myeloid (CD45+CD33+) cells were sorted from leukemic and multilineage grafts, whereas human B-lymphoid (CD45+CD19+) cells were sorted only from multilineage grafts. Up to 20 000 sorted cells were pelleted and whole genome amplified using the REPLI-g Mini Kit (Qiagen Inc). NPM1 and DNMT3a mutations were detected by droplet digital polymerase chain reaction (Bio-Rad Laboratories Inc) as previously described.36
Gene expression profiling
RNA was extracted from sorted AML fractions (supplemental Table 5) using the RNeasy Mini/Micro Kit (Qiagen Inc). RNA was quantified by using the Fragment Analyzer (Agilent) as per manufacturer’s protocols. Whole transcriptome libraries were prepared by using 100 ng of RNA input and the KAPA RNA Hyper Prep Library Kit (Roche), following manufacturers’ protocols. Prepared libraries were then subjected to quality control measures and quantified by using a Fragment Analyzer and/or shallow sequencing (<100 000 reads) on the Illumina MiSeq Instrument in 2 × 150 read mode according to the manufacturer’s standard protocol. Sequencing of whole transcriptome libraries was performed on an Illumina NovaSeq6000 system to generate 2 ×100 paired reads, targeting a final coverage of 50 M clusters per library. Read counts were normalized in R 3.5.0 using TMM function in edgeR_3.24.3, and differential expression was estimated by comparing the group of CD200+ blasts and the group of CD200– blasts from AMLs. A rank file was generated by ordering genes from highest to lowest level of differential expression in the CD200+ vs CD200– comparison using the formula -log10(P value) × sign(logFC). Gene Set Enrichment Analysis (GSEA; BROAD Institute) was run by using default parameters to estimate enrichment of tumor-derived myeloid and HSC/progenitor-like gene-sets37 in the CD200+ or CD200– groups. Single sample GSEA was run by using the gsva function available from GSVA_1.30.0 using the same tumor-derived gene sets on bulk AML and on sorted blast fractions. Z scores were calculated by using the formula Z = (x – μ)/σ (where μ is the mean of all x values and σ is the standard deviation of all x values) and then normalized to 0 to 1 scale by min-max scaling.
Statistical analysis
Comparisons between 2 different groups were performed by using 2-tailed Student t tests (not significant, P > .05; *P ≤ .05, **P ≤ .01, ***P ≤ .001, ****P ≤ .0001). Data were analyzed by using Prism version 7 for Mac OS X (GraphPad Software).
Results
CD200 is expressed on normal HSCs and primitive AML blasts
To characterize markers associated with LSC activity in AML, we analyzed an LSC-specific gene expression profile obtained by comparing functionally defined LSC-containing and non–LSC-containing cell populations2 and identified CD200 as a gene more highly expressed in LSCs. Because HSCs and LSCs share stemness programs,2,3 we first examined CD200 cell surface protein expression by flow cytometry on normal hematopoietic stem and progenitor cells (HSPCs) obtained from human adult BM (n = 6) and CB (n = 6) samples. CD200 was present on the majority of CD34+CD38− HSPCs from BM (≥90%) and CB (≥98%); however, the proportion of CD200+ cells was lower within CD34+CD38+ committed progenitor populations (supplemental Figure 1A). Among HSPC populations, CD200 staining was most intense on HSCs compared with multipotent progenitors in both BM and CB (RFI 59.1 vs 39.7, respectively for BM, P = .0004; RFI 156 vs 83, respectively for CB, P = .0001); and was even lower on CD34+CD38+ progenitor populations.
We next examined CD200 cell surface expression on 65 AML patient samples by flow cytometry (supplemental Table 4). Because CD200 is expressed on lymphoid lineages,30 we restricted our analysis to CD3−CD19− MNCs. Although the proportion of CD200+ cells was variable within this compartment (mean, 30.4%; range, 0.1%-99%), CD200 was present on a greater proportion of primitive CD45dim blasts compared with more differentiated CD45high cells (54.1% vs 21.3%; P < .0001) (Figure 1A). In many cases, CD45dimCD200+ blasts represented a distinct population that was well separated from CD45high populations as well as CD45dimCD200− blasts (Figure 1B). Notably, CD200 was expressed on both CD34− and CD34+ subpopulations (Figure 1C). There was no linear correlation between the expression of CD34 and CD200 on CD45dim blasts (Figure 1D). In some samples, a higher proportion of CD45dim blasts expressed CD200 compared with CD34, and the greatest differences were observed in cases with lower proportion of CD34 expression. CD34 was often coexpressed with CD200 and was usually absent on CD45dimCD200− blasts (29.4% vs 4.4%; P < .0001) (supplemental Figure 1B). Overall, these observations in normal HSPCs and immunophenotypically defined AML blast populations show that CD200 is a marker of primitive cells in both normal and leukemic hematopoiesis.
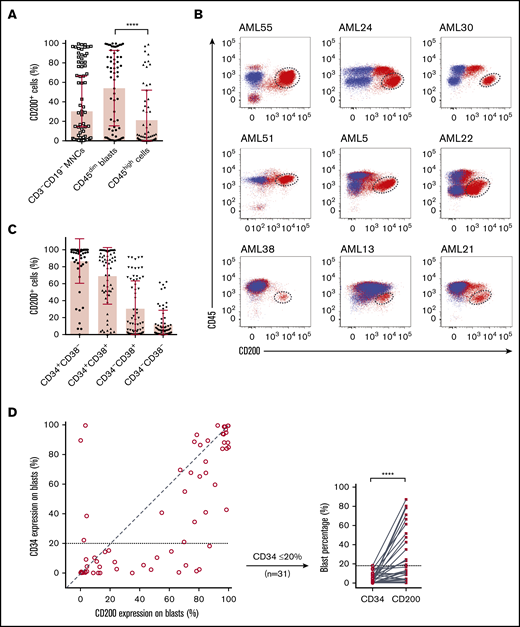
Flow cytometric analysis of CD200 expression on 65 primary AML samples. (A) Proportion of CD200+ cells in the CD3−CD19− MNC and CD45+ (dim/high) populations. (B) CD200 vs CD45 expression profiles of 9 AML cases. Red dots represent CD3−CD19− MNCs stained with anti-human CD200 mAb (clone 1B9). Blue dots represent CD3−CD19− MNCs not stained with anti-human CD200 mAb (fluorescence minus 1 control). CD45dimCD200+ blast populations are indicated by dashed circles. (C) Proportion of CD200+ cells in CD34 and CD38 subpopulations. (D) Correlation between CD34 and CD200 expression on CD45dim blasts (diagonal line represents a correlation of 1) (left panel) and comparison of CD34 and CD200 expression on CD45dim blasts from samples with ≤20% CD34 expression on blasts (right panel). ****P < .0001.
Flow cytometric analysis of CD200 expression on 65 primary AML samples. (A) Proportion of CD200+ cells in the CD3−CD19− MNC and CD45+ (dim/high) populations. (B) CD200 vs CD45 expression profiles of 9 AML cases. Red dots represent CD3−CD19− MNCs stained with anti-human CD200 mAb (clone 1B9). Blue dots represent CD3−CD19− MNCs not stained with anti-human CD200 mAb (fluorescence minus 1 control). CD45dimCD200+ blast populations are indicated by dashed circles. (C) Proportion of CD200+ cells in CD34 and CD38 subpopulations. (D) Correlation between CD34 and CD200 expression on CD45dim blasts (diagonal line represents a correlation of 1) (left panel) and comparison of CD34 and CD200 expression on CD45dim blasts from samples with ≤20% CD34 expression on blasts (right panel). ****P < .0001.
CD200 identifies LSC activity in AML
To determine whether CD200 expression can capture functional LSC activity, we performed xenotransplantation assays of 16 AML patient samples sorted based on CD200 (+/−) and CD45 (mid/high) expression (Figure 2A). This assessment included 10 cases in which the proportion of CD45dim blasts expressing CD200 ranged between 10% and 96% (representing 49 of 65 AML cases in our cohort) and 6 cases in which it was <5% (representing 15 of 65 AML cases in our cohort) (Table 1). Of the 10 cases with CD200 expression on ≥10% of CD45dim blasts (from here on referred to only as blasts), there was one sample (AML22) in which leukemic grafts were generated by both CD200+ and CD200− blasts (supplemental Figures 2A and 3), indicating that CD200 did not enrich for LSC activity in this patient sample. In the remaining 9 cases, only CD200+ blasts generated significant leukemic grafts in recipient mice, whereas transplantation of much higher cell doses from other immunophenotypic fractions did not (Figure 2B). Four representative samples (AML5, AML13, AML21, and AML47) are shown in Figure 2B. In AML13, in which CD200 was expressed on only 4% of MNCs but on 25% of blasts, CD200+ blasts (p2) initiated leukemic grafts after transplantation of as few as 5000 cells. In contrast, transplantation of up to 5×10⁵ CD200− blasts (p1) generated a minimal (1%) leukemic graft in only 1 of 2 mice. Similarly, in AML5, LSC activity was detected in the CD200+ blast population, whereas no human graft was obtained with transplantation of up to 2.5 × 10⁵ CD200− blasts. Interestingly, sample AML47 had 3 distinct blast fractions (CD200−, CD200mid, and CD200high), and LSC activity was detected only within the CD200high fraction. In all 10 of these samples, no leukemic grafts were generated by CD45high cells (p3 and p4). Limiting dilution analysis of AML13 and AML21 showed a 12.5-fold (χ2 = 9.52; P = .002) and 22.9-fold (χ2 = 21.3; P < .0001) enrichment of LSC activity, respectively, in CD200+ blasts compared with MNCs (Figure 2C; supplemental Figure 2B).
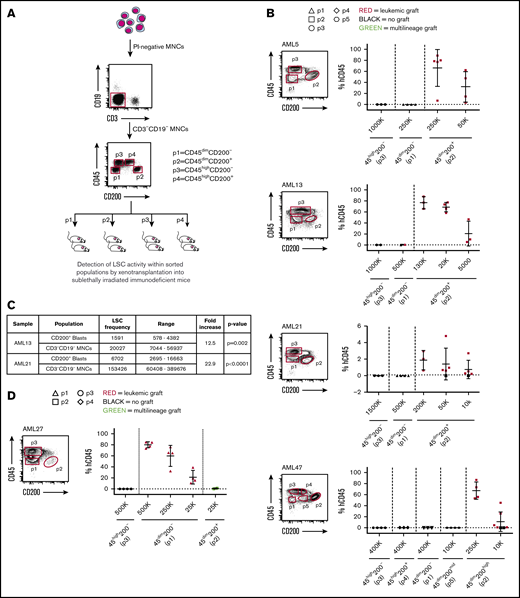
CD200 is a marker of LSC activity measured by xenotransplantation assays. (A) Schematic of experimental protocol showing cell sorting strategy based on CD45 and CD200 expression followed by transplantation into NSG mice. (B) Sorting gates and level of human CD45+ engraftment in injected femur following transplantation at indicated doses of sorted populations from 4 representative AML samples expressing CD200 on ≥10% of CD45dim blasts (AML5, AML13, AML21, and AML47). (C) LSC frequencies in CD45dimCD200+ blasts and CD3−CD19− MNCs for samples AML13 and AML21, calculated using ELDA (extreme limiting dilution analysis) software. (D) Sorting gates and level of human CD45+ engraftment in injected femur following transplantation at indicated doses of sorted populations from a representative AML sample expressing CD200 on <5% of CD45dim blasts (AML27). For panels B and D, each symbol represents 1 mouse; red symbols indicate leukemic grafts, green symbols indicate multilineage grafts, black symbols indicate no engraftment; mean ± standard deviation is shown for each cohort of mice.
CD200 is a marker of LSC activity measured by xenotransplantation assays. (A) Schematic of experimental protocol showing cell sorting strategy based on CD45 and CD200 expression followed by transplantation into NSG mice. (B) Sorting gates and level of human CD45+ engraftment in injected femur following transplantation at indicated doses of sorted populations from 4 representative AML samples expressing CD200 on ≥10% of CD45dim blasts (AML5, AML13, AML21, and AML47). (C) LSC frequencies in CD45dimCD200+ blasts and CD3−CD19− MNCs for samples AML13 and AML21, calculated using ELDA (extreme limiting dilution analysis) software. (D) Sorting gates and level of human CD45+ engraftment in injected femur following transplantation at indicated doses of sorted populations from a representative AML sample expressing CD200 on <5% of CD45dim blasts (AML27). For panels B and D, each symbol represents 1 mouse; red symbols indicate leukemic grafts, green symbols indicate multilineage grafts, black symbols indicate no engraftment; mean ± standard deviation is shown for each cohort of mice.
AML patient samples selected for cell sorting and xenotransplantation studies
| AML | CD200 (% of blasts) | CD34 (% of blasts) | CD45dimCD200+ (% of MNCs) | CD200 sort | Karyotype | NPM1 | FLT3-ITD |
|---|---|---|---|---|---|---|---|
| AML samples expressing CD200 on ≥10% of blasts | |||||||
| 3 | 52 | 10 | 20 | Standard | Normal | Mutated | Positive |
| 5 | 70 | 21 | 28 | Standard | Normal | Mutated | Positive |
| 11 | 10 | 10 | 3 | Standard | Normal | Mutated | Negative |
| 13 | 25 | 3 | 4 | Standard | Normal | Mutated | Negative |
| 21 | 48 | 2 | 4 | Standard | Normal | Mutated | Negative |
| 22 | 35 | <1 | 35 | Standard | Normal | Mutated | Negative |
| 30 | 96 | 84 | 45 | Standard | Normal | WT | Negative |
| 47 | 85 | 75 | 40 | Standard | Abnormal | WT | Negative |
| 51 | 77 | 89 | 76 | Standard | Abnormal | WT | Negative |
| 63 | 77 | 35 | 85 | Standard | unknown | Mutated | Positive |
| AML samples expressing CD200 on <5% of blasts | |||||||
| 27 | 1 | <1 | 1 | Standard | Normal | WT | Negative |
| 36 | <1 | <1 | <1 | Standard | Abnormal | Mutated | Negative |
| 38 | 4 | 4 | 2 | Standard | Abnormal | Mutated | Negative |
| 44 | 3 | 100 | 4 | Standard | Abnormal | WT | Negative |
| 45 | <1 | 90 | <1 | Standard | Abnormal | WT | Negative |
| 54 | <1 | <1 | <1 | Standard | Abnormal | WT | Negative |
| AML samples with mixed leukemic and multilineage grafts | |||||||
| 7 | 42 | 5 | 2 | Expanded | Normal | Mutated | Negative |
| 2 | 61 | 15 | 16 | Expanded | Normal | Mutated | Positive |
FLT3-ITD, Fms-like tyrosine kinase 3–internal tandem duplication.
By contrast, in the 6 AML cases with low CD200 expression (<5% of blasts), LSC activity was not detected in the CD200+ but rather in the CD200− blast population (Figure 2D; supplemental Figures 3 and 4). Interestingly, CD200+ blasts from 5 of these samples generated multilineage human grafts comprising predominantly CD19+ B cells plus a smaller proportion of CD33+ myeloid cells, rather than leukemic grafts. The generation of a multilineage graft from an AML patient sample suggests the presence of HSCs within the CD200+ blast population.26,36 The absence of CD200 expression on LSCs in these 6 patient samples is consistent with the anomalous expression of other usual HSC markers, including CD34, in AML, underscoring the importance of functional validation of phenotypically characterized LSC populations. Nevertheless, our findings show that CD200 expression can fully capture or highly enrich for LSC activity from samples exhibiting CD200 expression on >10% of blasts, which comprise the majority of cases (49 of 65 [75%] in our cohort).
CD200+ LSCs can be prospectively separated from HCSs
Xenotransplantation of bulk cells from AML patient samples usually generates leukemic grafts, enabling study of the properties of graft-initiating LSCs, but xenotransplantation sometimes results in either multilineage or mixed leukemic and multilineage engraftment due to the coexistence of HSCs (pre-leukemic or wild-type),36 confounding functional studies of LSCs in these cases. In AML samples in which <5% of blasts express CD200, CD200− LSCs can be readily separated from CD200+ HSCs; however, separation of CD200+ LSCs from CD200+ HSCs requires the use of additional markers. We therefore developed an expanded CD200-based sorting strategy incorporating CD33 and CD45RA to enable separation of CD200+ LSCs from HSCs (Figure 3A) and tested it on 2 patient samples with CD200 expression on ≥10% of blasts that generated mixed grafts upon xenotransplantation of bulk cells (AML2, A.M., unpublished xenograft data, and AML71 ). In these 2 AML cases, sorted CD200+ blasts that were CD33−CD45RA−CD34+ generated multilineage grafts, while CD200+ blasts depleted of CD33−CD45RA− cells generated leukemic grafts (Figure 3B; supplemental Figure 3). Both AML cases contained a mutation in NPM1 that was detectable in CD33+ cells sorted from the leukemic xenografts, confirming their origin from LSCs. However, CD33+ cells sorted from the multilineage grafts bore wild-type NPM1, indicating that they arose from HSCs that had not acquired the leukemic mutation (supplemental Table 5). Interestingly, both samples also bore a mutation in DNMT3a that was detectable in leukemic xenografts from both AMLs. In contrast to the NPM1 mutation, the DNMT3a mutation was present in both CD19+ and CD33+ cells sorted from multilineage grafts from AML7 but not AML2, confirming in AML7 that these were generated by preleukemic HSCs. These data show that although LSCs and HSCs both express CD200 in some AML patient samples, additional markers can be applied to separate these 2 primitive cell populations for study.
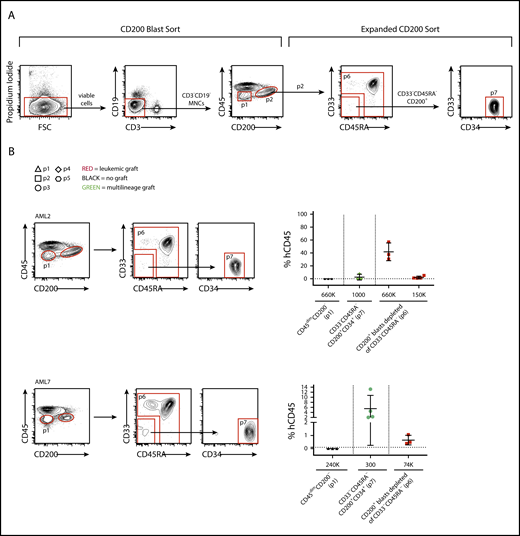
CD200+LSCs can be prospectively separated from HCSs. (A) Flow cytometry plots showing gating strategy used to separate CD200– and CD200+ blasts (CD200 Blast Sort) and to separate CD200+ LSCs from CD200+ HSCs (Expanded CD200 Sort). (B) Human CD45+ engraftment in injected femur following transplantation of sorted populations at indicated doses from samples AML2 and AML7. Each symbol represents 1 mouse; red symbols indicate leukemic grafts, green symbols indicate multilineage grafts, black symbols indicate no engraftment; mean ± standard deviation is shown for each cohort of mice.
CD200+LSCs can be prospectively separated from HCSs. (A) Flow cytometry plots showing gating strategy used to separate CD200– and CD200+ blasts (CD200 Blast Sort) and to separate CD200+ LSCs from CD200+ HSCs (Expanded CD200 Sort). (B) Human CD45+ engraftment in injected femur following transplantation of sorted populations at indicated doses from samples AML2 and AML7. Each symbol represents 1 mouse; red symbols indicate leukemic grafts, green symbols indicate multilineage grafts, black symbols indicate no engraftment; mean ± standard deviation is shown for each cohort of mice.
CD200 captures both CD34– and CD34+ LSCs
Previous studies have reported that LSCs within an individual AML sample can exhibit heterogeneous expression of CD34 and CD38, and LSC activity can be found in both CD34+ and CD34– cell fractions.2,10,11,14 We therefore investigated whether CD200 as a single marker is able to capture LSCs with heterogeneous CD34 expression. In 7 of 9 AML samples from our initial cohort with CD200+ LSCs, CD200+ blasts comprised both CD34− and CD34+ subpopulations of varying proportions (Figure 4A; supplemental Figure 5). In 5 of these 7 cases (AML3, AML5, AML13, AML21, and AML63), the presence of both CD34− and CD34+ LSCs within individual samples was confirmed by xenotransplantation of sorted cell populations (Ng et al3 and Figure 4B). Of note, all 5 of these cases bore NPM1 mutations, consistent with previous reports of CD34– LSCs in NPM1-mutated AMLs.10,17,18 Because engraftment in these 5 cases was generated only by CD200+ blasts, these results indicate that CD200 captured both CD34+ and CD34– LSCs. We performed an additional validation experiment by resorting cells from AML5 based on CD200 and CD34 expression (Figure 4C). Leukemic grafts were generated following transplantation of as few as 5000 CD34−CD200+ or CD34+CD200+ cells, whereas transplantation of up to 5×10⁵ CD34−CD200− cells failed to generate significant grafts. Overall, our findings show that CD200 can capture both CD34+ and CD34– LSCs within individual AML samples, including those with NPM1 mutation.
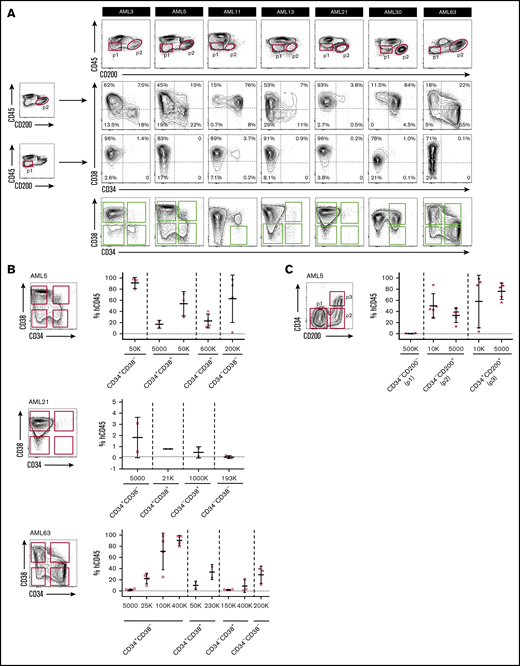
CD200 captures both CD34–and CD34+LSCs. (A) Flow cytometric analysis of CD34 and CD38 expression on CD200+ and CD200− blasts from 7 AML samples with CD200+ LSCs. Engrafting fractions containing LSCs as determined by xenotransplantation assays are indicated by green boxes. (B) Sorting gates and level of human CD45+ engraftment in injected femur following transplantation at indicated doses of sorted populations from samples AML5, AML21 and AML63. (C) Sorting gates and level of human CD45+ engraftment in injected femur following transplantation at indicated doses of sorted populations from sample AML5. For panels B and C, each symbol represents 1 mouse; red symbols indicate leukemic grafts, black symbols indicate no engraftment; mean ± standard deviation is shown for each cohort of mice.
CD200 captures both CD34–and CD34+LSCs. (A) Flow cytometric analysis of CD34 and CD38 expression on CD200+ and CD200− blasts from 7 AML samples with CD200+ LSCs. Engrafting fractions containing LSCs as determined by xenotransplantation assays are indicated by green boxes. (B) Sorting gates and level of human CD45+ engraftment in injected femur following transplantation at indicated doses of sorted populations from samples AML5, AML21 and AML63. (C) Sorting gates and level of human CD45+ engraftment in injected femur following transplantation at indicated doses of sorted populations from sample AML5. For panels B and C, each symbol represents 1 mouse; red symbols indicate leukemic grafts, black symbols indicate no engraftment; mean ± standard deviation is shown for each cohort of mice.
Detection of progenitor programs in CD200+ LSCs from AMLs with NPM1 mutations
Recently, van Galen et al37 performed single-cell transcriptomic profiling of primary AML samples and generated tumor-derived gene signatures of primitive (ie, HSC-like, progenitor-like) and mature (eg, myeloid-like) cell types relative to the normal hematopoietic hierarchy. We used these gene sets as a reference to characterize the gene expression profiles associated with CD200+ LSC-containing and CD200− non–LSC-containing blast populations from 8 AML samples obtained by RNA sequencing (supplemental Table 6). GSEA revealed that genes associated with primitive HSC/progenitor-like signatures were enriched in CD200+ blasts, whereas CD200− blasts were highly enriched in genes associated with a mature myeloid-like signature (Figure 5A), consistent with our functional engraftment data.
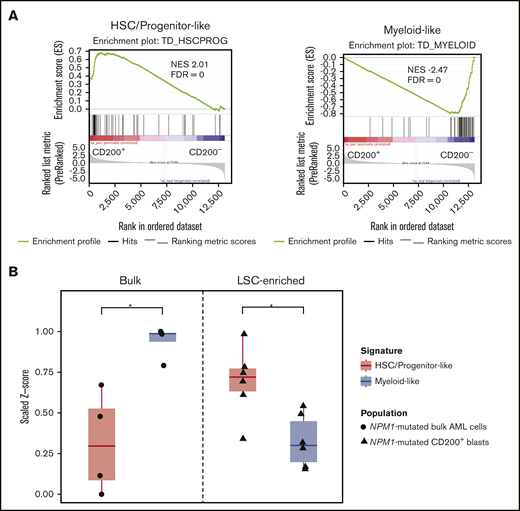
Detection of progenitor programs in CD200+LSCs from AMLs with NPM1 mutations. (A) GSEA of gene expression profiles of CD200+ LSC-containing and CD200− non-LSC-containing blasts from 8 AML samples, using primitive HSC/progenitor-like and mature myeloid-like gene signatures. (B) Single sample GSEA of gene expression profiles of bulk cells from 4 NPM1-mutated AML samples (AML3, AML7, AML13, and AML21) and LSC-enriched CD200+ blasts from 6 NPM1-mutated AML cases (AML2, AML3, AML5, AML7, AML13, and AML21), using HSC/progenitor-like and myeloid-like gene signatures. *P < .05. FDR, false discovery rate; NES, normalized enrichment score.
Detection of progenitor programs in CD200+LSCs from AMLs with NPM1 mutations. (A) GSEA of gene expression profiles of CD200+ LSC-containing and CD200− non-LSC-containing blasts from 8 AML samples, using primitive HSC/progenitor-like and mature myeloid-like gene signatures. (B) Single sample GSEA of gene expression profiles of bulk cells from 4 NPM1-mutated AML samples (AML3, AML7, AML13, and AML21) and LSC-enriched CD200+ blasts from 6 NPM1-mutated AML cases (AML2, AML3, AML5, AML7, AML13, and AML21), using HSC/progenitor-like and myeloid-like gene signatures. *P < .05. FDR, false discovery rate; NES, normalized enrichment score.
Six of the 8 AML samples we profiled by RNA sequencing carried a mutation in NPM1 (supplemental Table 6). We therefore next compared the gene expression profiles of bulk cells vs CD200+ LSC-enriched fractions sorted from NPM1-mutated samples. Single-sample GSEA of data from bulk cells available for 4 cases (AML3, AML7, AML13, and AML21)1 showed dominance of the mature myeloid-like signature over the primitive HSC/progenitor-like signature (P = .0161) (Figure 5B). In contrast, CD200+ blasts exhibited a significant enrichment of the HSC/progenitor-like signature compared with the myeloid-like signature (P = .0234). Together, these findings highlight the value of a CD200 expression-based sorting strategy for the isolation of highly enriched LSC populations, particularly from NPM1-mutated AML samples in which LSCs are commonly CD34–.
Discussion
In this report, we identify the cell surface protein CD200 as a novel LSC marker in AML. CD200 expression marked LSCs, including both CD34− and CD34+ LSCs, from individual samples, in cases in which CD200 was present on ≥10% of blasts, representing the majority (49 of 65 [75%]) of our larger cohort and supporting broad applicability of CD200 as a marker for prospective isolation of LSC activity. Although CD200 is also expressed on normal HSCs, CD200+ LSCs could be readily separated from HSCs through the use of additional cell surface markers. In the minority of cases in which CD200 expression was present on <5% of blasts, LSCs did not express CD200. The absence of CD200, which is present on normal HSCs, on LSCs in these cases may reflect the immunophenotype of the cell of origin and is consistent with the frequent finding of aberrant hematopoietic differentiation marker expression in AML, underscoring the importance of functional validation of immunophenotypically characterized LSC populations. A CD200-based sorting strategy will be particularly valuable for AML cases with low or negative CD34 expression on blasts, such as those with NPM1 mutation, enabling detailed analysis of the molecular profile of LSC-enriched populations that might otherwise be difficult to detect in the bulk sample. Because about three-quarters of the AML samples containing CD200+ LSCs bore NPM1 mutations, further studies of other AML subtypes would be needed to confirm the broad applicability of CD200 as an LSC marker.
A number of previous studies have examined other candidate markers for LSC enrichment, including CD96,21 TIM3,26 GPR56,27 and CD99.28 The majority of these studies carried out functional validation experiments on CD34+ subpopulations rather than on the whole CD45dim blast population, as performed in our study. One reason for this may be that the LSC-containing CD45dim blast population and the more differentiated CD45high AML cell population are often indistinct and difficult to separate on flow cytometric analysis. Additional staining for CD200, which is expressed on both a higher proportion of cells and at higher intensity in the CD45dim blast population, enables ready isolation of this LSC-containing population for downstream studies.
The function of CD200 in normal and malignant hematopoiesis is presently unclear; however, based on our current understanding, it may play an immunomodulatory role. CD200 is an immunoglobulin superfamily member involved in regulating immune responses through its interaction with CD200 receptor (CD200R).31 Expression of CD200R is limited to immune cells, predominantly myeloid cells and subsets of natural killer, B, and T cells.38 CD200 is more ubiquitously expressed and can be found on neurons, endothelium, thymocytes, and populations of B- and T-lymphocytes.30 CD200–CD200R interaction results in immunosuppressive effects that have the potential to influence responses to pathogens, autoimmunity, transplant tolerance, and cancer surveillance.31 In the hematopoietic system, CD200–CD200R signaling may act to minimize autoimmunity against HSCs in healthy individuals; however, LSCs may exploit this mechanism for immune evasion. The role and importance of CD200-CD200R signaling in AML should be further studied in the context of recently described immune-infiltrated and immune-depleted disease subtypes that may confer differential sensitivity to immunotherapy.39 Recently, a phase 1 study was conducted to evaluate targeting of the CD200-CD200R immune checkpoint by an anti-CD200 monoclonal antibody (samalizumab; ALXN6000) in patients with chronic lymphocytic leukemia and multiple myeloma.40 Although CD200 expression on normal HSCs increases the potential for off-target effects, patients in this dose-finding study experienced no significant hematologic adverse effects, and the maximum tolerated dose was not reached. Results of this previous study, together with our findings, support further evaluation of the concept of targeting CD200 on LSCs as a strategy to reduce relapse rates and improve outcomes in AML by eliminating these disease-sustaining cells.
The RNA sequencing data reported in this article have been deposited in the Gene Expression Omnibus database (accession number GSE159323).
Acknowledgments
The authors thank Trillium Therapeutics for kindly providing purified clone 1B9 for this study, the cell-sorting operators at the University Health Network (UHN)–SickKids Flow Cytometry Facility, and members of J.C.Y.W. and J.E.D. laboratories for their comments and review of the manuscript. They also thank Sasan Zandi for performing RNA sequence alignments and Andy Zeng for performing gene expression deconvolution. The authors thank Yogi Sundaravadanam, Gregory Downs, and Abdellatif Daghrach for analyzing targeted sequencing data.
This research was supported by funds to J.C.Y.W. from the Princess Margaret Cancer Foundation and the Ontario Institute for Cancer Research with funding from the Province of Ontario, and to J.E.D. from the Princess Margaret Cancer Centre through funding provided by Ontario Ministry of Health, Canadian Cancer Society (grant #703212), Princess Margaret Cancer Foundation, Ontario Institute for Cancer Research with funding from the Province of Ontario, Canadian Institutes for Health Research (RN380110–409786), Terry Fox New Frontiers Program Project Grant, University of Toronto’s Medicine by Design initiative with funding from the Canada First Research Excellence Fund, and a Canada Research Chair.
Authorship
Contribution: J.M.H. designed the study, performed research, analyzed data, and wrote the manuscript; S.M.D. performed in vivo experiments; V.V. performed bioinformatics analysis; J.M. performed in vivo experiments and RNA extractions; J.A.K. performed droplet digital polymerase chain reactions and analysis; A.M. performed in vivo experiments and generated gene expression data; L.J. generated gene expression data; K.E. performed in vivo experiments and identified CD200 as a candidate LSC marker; G.B. provided conceptual advice; M.D.M provided patient samples and clinical data; J.E.D. provided research support and conceptual advice; J.C.Y.W. supervised the study and wrote the manuscript; and all coauthors reviewed the manuscript and provided comments.
Conflict-of-interest disclosure: J.E.D. has sponsored research agreements with Celgene. M.D.M. is a principal investigator in a clinical trial sponsored by Trillium Therapeutics and receives no funding from the sponsor. There is an existing license agreement between Trillium Therapeutics and University Health Network, and L.J., J.E.D., and J.C.Y.W. may be entitled to receive financial benefits further to this license and in accordance with their institution’s intellectual property policies. The remaining authors declare no competing financial interests.
Correspondence: Jean C. Y. Wang, Princess Margaret Cancer Centre, MaRS PMCRT 8-363, 101 College St, Toronto, ON M5G 1L7, Canada; e-mail: jean.wang@uhnresearch.ca; and Jenny M. Ho, London Health Sciences Centre, 800 Commissioners Rd E, E6-218, London, ON N6A 5W9, Canada; e-mail: jenny.ho@lhsc.on.ca.

