

Key Points
In AML and MDS, a high number of novel gene fusions were found, associated with a high frequency of TP53 mutations and complex karyotype.
Novel fusion was much more common in AML than in MDS; some might be of use for developing markers (eg, for MRD monitoring).

Abstract
Fusion transcripts are frequent genetic abnormalities in myeloid malignancies and are often the basis for risk stratification, minimal residual disease (MRD) monitoring, and targeted therapy. We comprehensively analyzed the fusion transcript landscape in 572 acute myeloid leukemia (AML) and 630 myelodysplastic syndrome (MDS) patients by whole transcriptome sequencing (WTS). Totally, 274 fusion events (131 unique fusions) were identified in 210/572 AML patients (37%). In 16/630 MDS patients, 16 fusion events (15 unique fusions) were detected (3%). In AML, 141 cases comprised entity-defining rearrangements (51% of all detected fusions) and 21 (8%) additional well-known fusions, all detected by WTS (control group). In MDS, only 1 fusion was described previously (NRIP1-MECOM, n = 2). Interestingly, a high number of so-far unreported fusions were found (41% [112/274] in AML, 88% [14/16] in MDS), all validated by cytogenetic and/or whole genome sequencing data. With 1 exception (CTDSP1-CFLAR, n = 2), all novel fusions were observed in 1 patient each. In AML, cases with novel fusions showed concomitantly a high frequency of TP53 mutations (67%) and of a complex karyotype (71%), which was also observed in MDS, but less pronounced (TP53, 26%; complex karyotype, 21%). A functional annotation of genes involved in novel fusions revealed many functional relevant genes (eg, transcription factors; n = 28 in AML, n = 2 in MDS) or enzymes (n = 42 in AML, n = 9 in MDS). Taken together, new genomic alterations leading to fusion transcripts were much more common in AML than in MDS. Any novel fusions might be of use for developing markers (eg, for MRD monitoring), particularly in cases without an entity-defining abnormality.
Introduction
Gene fusions leading to the formation of chimeric fusion transcripts are frequent genetic abnormalities in hematological malignancies. These fusion transcripts can arise by intra-chromosomal (within 1 chromosome) or inter-chromosomal (between 2 chromosomes) events, including inversions, deletions, insertions, or translocations that often contribute to leukemogenesis and play crucial roles for risk stratification, minimal residual disease (MRD) monitoring, and targeted therapy.1 In many hematological malignancies, including acute myeloid leukemia (AML), the identification of recurrent gene rearrangements is critical for risk classification according to World Health Organization and European Leukemia Net (ELN) guidelines.1,2 Generally, AML is characterized by a large number of balanced translocations leading to fusion genes.3,4 By contrast, balanced translocations are rather rare in myelodysplastic syndromes (MDS), where mostly unbalanced alterations are detected, which nevertheless might lead to certain gene fusions.1,5 Moreover, data on recurrent gene mutations increased massively in recent years because of the application of whole exome and whole genome sequencing, revealing that the majority of AMLs harbor 2 or more potential driver mutations affecting classification, prognosis, and therapy.6,7
The current standard diagnostic techniques for the detection of gene fusions (chromosome banding analysis [CBA], fluorescence in situ hybridization [FISH], reverse transcription polymerase chain reaction are only able to predict known and/or noncryptic gene fusions. Examples for limitations of these techniques in AML include the translocation t(5;11)(q35;p15)/NUP98-NSD1, which is cytogenetically cryptic and thus not detectable by CBA,8 or translocations involving KMT2A, for which more than 100 partner genes have been described with numerous different breakpoints, which cannot be fully covered by standard reverse transcription polymerase chain reaction approaches.9 Another challenge constitutes AML with a complex karyotype, for which, often, not all aberrations can be fully resolved by conventional cytogenetics.10 In particular for these cases, detection of (cryptic) genomic lesions, especially gene fusions, might lead to adjustment of treatment regimens by identification of markers applicable for targeted therapy.11,12 To date, the frequency of undetected gene fusions in AML with complex karyotype is unknown.
In recent years, RNA sequencing (RNAseq; including whole transcriptome sequencing (WTS) and targeted exome RNAseq) was successfully established for determination of gene fusion transcripts in hematological malignancies, including AML,12,13 leaving behind the previously mentioned limitations of current standard diagnostic techniques for fusion detection. Moreover, it was applied for detection of rare and/or novel fusion transcripts as well.14,15 In a recent study, RNAseq was also successfully used in AML for the identification of genomic lesions of clinical importance which were undetected or incompletely resolved by cytogenetics, revealing eg, fusions of ETV6-MECOM, NUP98-KDM5A, PICALM-MLLT10, and NUP98-BPTF.16 In a different study, targeted RNAseq resolved ∼60% of rearrangements in cases in which only 1 partner gene was known according to cytogenetics, including rearrangements involving RUNX1, ETV6, PDGFRB, and KMT2A.17 In the same study, a number of novel fusions were detected as well (including RUNX1-PLAG1, KMT2A-ASXL2, ETV6-FOXO1, and NPM1-SETBP1), demonstrating that RNAseq is able to detect recurrent gene fusions at a high frequency and that characterization of rare gene fusions is also possible.17
The aim of the present study was to perform a comprehensive analysis of fusion genes in 572 AML and 630 MDS patients using WTS, with a special focus on detection and characterization of novel fusion transcripts.
Materials and methods
Patients and samples
For diagnostic workup, 572 patients with newly diagnosed AML and 630 patients diagnosed with MDS sent to the MLL Leukemia Laboratory between August 2007 and January 2018 were selected based on sample availability for WTS and WGS. Diagnoses were performed based on morphology, immunophenotype, cytogenetics, and molecular genetics, as previously published.18-20 The AML cohort comprised 262 female (46%) and 310 male (54%) patients with a median age of 68 years (range, 18-93 years) at diagnosis, whereas the MDS cohort included 268 female (43%) and 362 male (57%) patients (median age, 73 years; range, 23-93 years). Further information on AML and MDS cases regarding diagnosis, clinical parameters, karyotype, FISH result, and material used are summarized in supplemental Tables 1 and 2. All patients had given written informed consent to the use of genetic and clinical data according to the Declaration of Helsinki. The study was approved by our internal institutional review board.
Cytogenetics, FISH, and array CGH
Cytogenetic analyses (CBA and/or FISH and/or array comparative genomic hybridization [CGH]) were used for validation of the detected fusion transcripts. CBA was performed for all 1202 cases, as previously described, according to standard methods.18 For classification of abnormalities and karyotypes, the International System for Human Cytogenetic Nomenclature guidelines (2016) were used.21 A complex karyotype was defined as follows: presence of >3 unrelated chromosomal aberrations and absence of favorable cytogenetic rearrangements. The FISH probes used in diagnostic workup were selected based on recommendations, aberrations detected in CBA, and the availability of probes. If required, array CGH analyses were additionally carried out (4 × 180K microarray slides, Agilent Technologies, Santa Clara, CA; details described in supplemental Data).
Library preparation, WTS.
Stranded RNAseq libraries were constructed from ribosomal RNA-depleted RNA using TruSeq Total Stranded RNA kit (Illumina, San Diego, CA, USA). A total of 101-bp paired-end reads were produced on a NovaSeq 6000 system with a yield between 35 and 125 million (median, 50 million) paired reads per sample. FASTQ generation was performed applying Illumina’s bcl2fastq software (v1.8.4). FASTQ files were preprocessed with the RNA-Seq Alignment Fast app from Illumina. Reads were aligned (STAR, version 2.5.0a22 ) to the human reference genome (hg19) and Manta (version 0.28.0) was used for fusion calling with default settings.23 Reciprocal fusion transcripts were counted as 1 fusion event. Fusions were defined as “novel” if they were not found by performing queries against the Mitelman Database of Chromosome Aberrations and Gene Fusions (https://mitelmandatabase.isb-cgc.org/) and ChimerDB.24 For details on filtering procedure, see supplemental Data.
Whole genome sequencing.
Total RNA and genomic DNA were extracted from lysed cell pellet of diagnostic bone marrow (AML, n = 560; MDS, n = 630) or peripheral blood (AML, n = 12; MDS, n = 0) of patients using the MagNA Pure 96 with DNA and Viral Nucleic Acid Large Volume Kit and Cellular RNA Large Volume Kit (Roche, Basel, Switzerland). Whole genome sequencing (WGS) with ×90 coverage was applied for fusion validation on genomic level (for details see supplemental Data).
Statistical analysis
Statistical analyses were performed using SPSS (version 19.0.0) software (IBM Corporation, Armonk, NY); Prism software, version 8.0 (GraphPad Software, Inc., La Jolla, CA); R, version 3.5.1 software (R Foundation for Statistical Computing, Vienna, Austria); and routines from the biostatistics software repository Bioconductor. The 2-sided Fisher’s exact test was used to compare categorical variables, whereas the Wilcoxon-Mann-Whitney test was applied for continuous variables.
Results
Identification of fusion transcripts in AML and MDS
After stringent filtering, a total number of 274 fusion events, corresponding to 131 unique gene fusions, were identified in 210/572 AML patients, whereas in 16/630 MDS patients, 16 fusion events (corresponding to 15 unique gene fusions) were detected (supplemental Tables 1 and 2). Thus, in 37% of AML cases, at least 1 fusion was detected, whereas only 3% of MDS patients showed a gene fusion. In AML, the majority of cases showed 1 fusion event (n = 170; 81%), 26 patients harbored 2 fusions (12%), and 11 patients had 3 fusions (5%). In 1 patient each, 4, 5 and 10 fusions were observed, respectively (supplemental Table 1). In all 16 MDS cases with a fusion, only 1 fusion event was found (Table 1). Generally, only fusions validated by either WGS data and/or cytogenetics (including CBA and/or FISH and/or array CGH) were considered for further evaluation. In more detail, a fusion was considered validated by WGS if the respective breakpoints were also detected on the genomic level and was considered validated by cytogenetics if a translocation, deletion, inversion, or duplication in chromosomal bands correlating to the respective fusions genes was detected by CBA or array CGH, or if the corresponding rearrangement was observed with the respective FISH probe. For AML cases, 235/274 (86%) were confirmed by both WGS and cytogenetics, 32/274 cases (12%) by WGS only, and 7/274 (2%) cases by cytogenetics only. For MDS cases, 10/16 (63%) cases were confirmed by WGS and cytogenetics, 5/16 cases (31%) by WGS only, and 1/16 (6%) cases by cytogenetics only (Table 1). In AML, 42% of fusions were intra-chromosomal (ie, were caused by structural rearrangements within the same chromosome, 114/274) and 58% inter-chromosomal (involved genes that were located on 2 different chromosomes, 160/274), whereas in MDS patients, the vast majority of fusions were intra-chromosomal (12/16, 75%; inter-chromosomal: 4/16, 25%). The median distance of the respective genomic breakpoints of intra-chromosomal fusions in AML patients was 8.5 megabase pairs (Mbp; range, 0.03-117.9 Mbp) and in MDS cases it was 2.0 Mbp (range, 0.03-74.2 Mbp) (supplemental Tables 3 and 4). In AML, the majority of fusions were predicted to encode an in-frame chimeric protein (191/274, 70%) and thus are likely functional (supplemental Table 3). The other fusions comprised frame-shift fusions resulting in a premature stop codon (52/274, 19%) or fusions with no frame information (eg, breakpoint at untranslated region [UTR] or intron; 31/274, 11%). By contrast, in MDS patients, only 5/16 (31%) fusions were in-frame, whereas 7/16 (44%) included frame-shift fusions and 4/16 (25%) fusions had the breakpoints in the 3′ or 5′ UTR (supplemental Table 4).
Summary of gene fusion characteristics detected in AML and MDS
| AML (n = 572) | MDS (n = 630) | |
|---|---|---|
| Total no. of fusions | 274 (131 unique gene fusions) | 16 (15 unique gene fusions) |
| No. of patients with fusion, n/N (%) | 210/572 (37) | 16/630 (3) |
| Validation method, n (%) | ||
| WGS only | 32 (12) | 5 (31) |
| Cytogenetics only | 7 (2) | 1 (6) |
| Both | 235 (86) | 10 (63) |
| Number of fusions, n (%) | ||
| 1 | 170 (81) | 16/16 (100) |
| 2 | 26 (12) | — |
| 3 | 11 (5) | — |
| 4 | 1 (0.6) | — |
| 5 | 1 (0.6) | — |
| 10 | 1 (0.6) | — |
| Chromosomal fusion type, n (%) | ||
| Intra-chromosomal | 114 (42) | 12 (75) |
| Inter-chromosomal | 160 (58) | 4 (25) |
| Type of rearrangement, n (%) | ||
| Entity-defining | 141 (51) | — |
| Previously described | 21 (8) | 2 (13) |
| Novel | 112 (41) | 14 (87) |
| Fusion type, n (%) | ||
| In frame | 191/274 (70) | 5/16 (31) |
| Out of frame (premature stop codon) | 52/274 (19) | 7/16 (44) |
| Other (intronic or breakpoint at UTR) | 31/274 (11) | 4/16 (25) |
| Total no. of novel fusions | 112/274 (41) | 14/16 (88) |
| Validation method, n (%) | ||
| WGS only | 31 (28) | 5 (36) |
| Cytogenetics only | 7 (6) | 1 (7) |
| Both | 74 (66) | 8 (57) |
| Chromosomal fusion type, n (%) | ||
| Intra-chromosomal | 65 (58) | 12 (86) |
| Inter-chromosomal | 47 (42) | 2 (14) |
| Fusion type, n (%) | ||
| In frame | 34 (30) | 5 (36) |
| Out of frame (premature stop codon) | 49 (43) | 7 (50) |
| Other (intronic or breakpoint at UTR) | 29 (27) | 2 (14) |
| Novel fusions, n (%) | ||
| Both fusion partners not reported before in hematological malignancies | 79 (70) | 11 (79) |
| Novel fusion partner of a gene previously reported in hematological malignancies | 33 (30) | 3 (21) |
Known rearrangements detected in AML and MDS cases
As a proof of principle and serving as a control group for fusion detection, the AML cases comprised 141 cases with entity-defining rearrangements (51% of all cases with detected fusions) and 21 cases (8%) with rare but previously described fusions, which were all found before WTS analysis using standard diagnostics (CBA and/or FISH) and which were all detected by WTS. Recurrent known fusions included: PML-RARA (n = 44), CBFB-MYH11 (n = 43), RUNX1-RUNX1T1 (n = 43), KMT2A-MLLT3 (n = 7), DEK-NUP214 (n = 4), KMT2A-MLLT10 (n = 4), KMT2A-MLLT1 (n = 2), NUP98-NSD1 (n = 2), and KMT2A-ELL (n = 2) (Figure 1; supplemental Table 3). In MDS cases, only 1 detected fusion was described previously (NRIP1-MECOM), which was found in 2 patients, and thus constitutes the only recurrent fusion observed in MDS (Figure 1; supplemental Table 4). Of note, the NRIP1-MECOM fusion was additionally the only fusion found in both AML and MDS. Additionally, to detection by standard diagnostics, all known rearrangements in AML and MDS were validated on the genomic level by WGS.
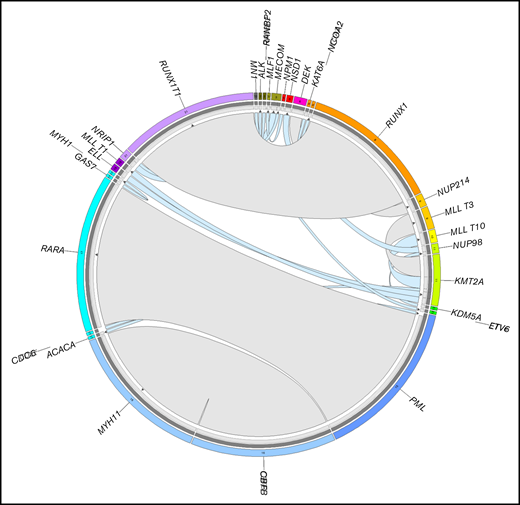
Summary of known fusions detected in 572 AML and 630 MDS patients. The plot was generated by Circos. The width of the connecting arcs reflects the recurrence of the fusion gene with the arrows indicating the transcription orientation from 5′ fusion gene partner to 3′ fusion gene partner. Gray arcs represent canonical fusions (in AML) associated with the entity-defining translocations RUNX1-RUNX1T1, PML-RARA, CBFB-MYH11, KMT2A-MLLT3, and DEK-NUP214, light blue arcs represent other previously reported fusion genes in AML and MDS. The outermost circle indicates the chromosomal location of the unique fusion genes. The inner circle depicts the validation methods of the detected fusion genes. Dark gray, validated by WGS; light gray, validated by CBA/FISH.
Summary of known fusions detected in 572 AML and 630 MDS patients. The plot was generated by Circos. The width of the connecting arcs reflects the recurrence of the fusion gene with the arrows indicating the transcription orientation from 5′ fusion gene partner to 3′ fusion gene partner. Gray arcs represent canonical fusions (in AML) associated with the entity-defining translocations RUNX1-RUNX1T1, PML-RARA, CBFB-MYH11, KMT2A-MLLT3, and DEK-NUP214, light blue arcs represent other previously reported fusion genes in AML and MDS. The outermost circle indicates the chromosomal location of the unique fusion genes. The inner circle depicts the validation methods of the detected fusion genes. Dark gray, validated by WGS; light gray, validated by CBA/FISH.
Identification of novel fusions
Interestingly, a high number of so-far unreported gene fusions were detected both in AML and in MDS cases: in AML, 41% (112/274) fusions were not reported before, in MDS even 88% (14/16) of fusions were to our knowledge not described before (for databases used, see Methods section) (Figure 2). In both AML and MDS, the majority of novel gene fusions comprised intra-chromosomal rearrangements (AML: 65/112, 58%; MDS: 12/14, 86%; Table 1; supplemental Tables 3 and 4). Totally, only 1 fusion (CTDSP1-CFLAR) was detected in 2 patients (in AML); all other novel fusions observed in AML and MDS cases were detected in 1 patient each. Thirty-four of 112 (30%) of the novel fusions in AML and 5/14 (36%) of fusions in MDS were predicted to encode an in-frame chimeric transcript. The remaining fusions either included frame-shift fusions (n = 49 in AML, n = 7 in MDS) or fusions with breakpoints located in UTR or intronic regions (n = 29 in AML, n = 2 in MDS) (Table 1).
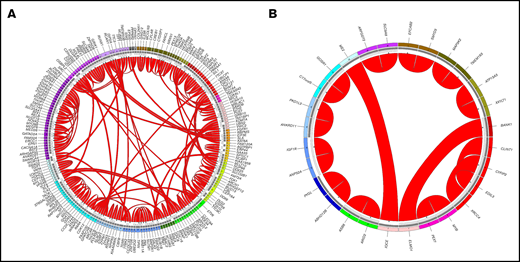
Summary of novel fusions in AML and MDS. The plot was generated by Circos. The outermost circle indicates the chromosomal location of the unique fusion genes. The inner circle depicts the validation methods of the detected fusion genes: dark gray, validated by WGS; light gray, validated by CBA/FISH. The arcs in the middle indicate novel fusions in AML (A) and MDS (B). The width of the connecting arcs reflects the recurrence of the fusion gene with the arrows indicating the transcription orientation from 5′ fusion gene partner to 3′ fusion gene partner.
Summary of novel fusions in AML and MDS. The plot was generated by Circos. The outermost circle indicates the chromosomal location of the unique fusion genes. The inner circle depicts the validation methods of the detected fusion genes: dark gray, validated by WGS; light gray, validated by CBA/FISH. The arcs in the middle indicate novel fusions in AML (A) and MDS (B). The width of the connecting arcs reflects the recurrence of the fusion gene with the arrows indicating the transcription orientation from 5′ fusion gene partner to 3′ fusion gene partner.
Of the 112 novel fusions in AML, 79 (70%) comprised fusions for which both fusion partners have not been reported before in hematological malignancies and 33/112 cases (30%) with a novel partner of a gene previously reported in hematological malignancies, including novel partners for NUP98 (XRN1), ETV6 (BHMT, FAAP100, ARNTL2, SMCO2), RUNX1 (THOC6, EIF3E, OPHN1, TMEM50B), and KMT2A (NCBP1) (supplemental Table 3; Figure 4). In MDS patients, 11/14 (79%) cases comprise both so far undescribed fusion partners, whereas for 3/14 (21%) fusions 1 partner was previously reported to function in hematological neoplasms (eg, MYB-PEX7) (supplemental Table 4).
Characterization of cases with novel fusions
For further analyses, cases were divided into those that only composed novel fusions (AML: n = 50; MDS: n = 14), cases with known fusions (AML: n = 160; MDS: n = 2) and cases in which no fusion was detected by RNAseq (AML: n = 362; MDS: n = 614). It has to be noted that 16/160 cases with a known fusion also included at least 1 novel fusion; nevertheless, these cases were grouped into the “known fusions” category because it can be assumed that the known fusion is the driver for pathogenesis in these cases. Interestingly, in AML, cases with novel fusions were characterized only by a very high frequency of TP53 mutations (67% vs 1% in cases with known fusions and 9% in cases with no detected fusions, P < .001), whereas FLT3-ITD, NPM1, RUNX1, and CEBPA biallelic mutations were rather rare (NPM1: 1% [novel] vs 0% [known] vs 36% [no fusion]; FLT3-ITD: 0% [novel] vs 13% [known] vs 24% [no fusion]; RUNX1: 8% [novel] vs 2% [known] vs 12% [no fusion]; CEBPA: 0% [novel] vs 0% [known] vs 5% [no fusion]). In line with this, a large number of cases with novel fusions depicted a complex karyotype (71% [novel] vs 1% [known] vs 9% [no fusion], P < .001) (Table 2). Regarding age, patients with known fusions were significantly younger than patients with novel fusions or without detected fusions (median age: 54 years [known] vs 72 [novel] vs 70 [no fusion], P < .001). Regarding TP53 mutations and the presence of a complex karyotype in MDS patients, a similar overrepresentation of cases with novel fusions was observed, although it has to be noted that this effect was not as pronounced as in AML patients (TP53: 26% [novel] vs 0% [known] vs 6% [no fusion], P = .015; complex karyotype: 21% [novel] vs 0% [known] vs 1% [no fusion]; P = .009) (Table 2). Additionally, we investigated the AML patients with and without detected fusions according to the ELN 2017 risk classification2 : the favorable risk group comprised 215 cases, of which 118/215 had a gene fusion detected (55%), whereas of the 204 cases from the intermediate risk group, only 20/204 (10%) showed a fusion. The adverse risk group comprised 153 cases; 63 of them harbored a fusion event (41%) (Figure 3A). Looking into more detail into cases with novel fusions only, the vast majority were found to belong to the adverse risk group (45/50, 90%), whereas only 3/50 (6%) and 2/50 (4%) were categorized as intermediate and favorable, respectively (Figure 3B).
Molecular characterization and age of cases with gene fusions in AML and MDS
| Cases with novel fusions only | Cases with known fusions | Cases with no detected fusion | |
|---|---|---|---|
| AML | |||
| TP53 mutations | 67* | 1 | 9 |
| Complex karyotype | 71* | 1 | 9 |
| FLT3-ITD | 0 | 13 | 24 |
| NPM1 mutations | 8 | 0 | 35 |
| RUNX1 mutations | 8 | 2 | 12 |
| CEBPA mutations (biallelic) | 0 | 0 | 5 |
| Median age, y | 72 | 54* | 70 |
| MDS | |||
| TP53 mutations | 26* | 0 | 6 |
| Complex karyotype | 21* | 0 | 1 |
| Median age, y | 67 | 46 | 73 |
Data are percentages unless otherwise noted.
Significant differences.
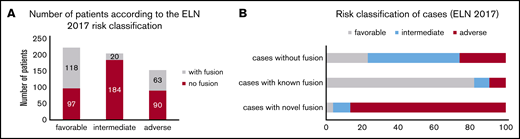
Detected AML fusions classified according to ELN 2017. (A) Cases with fusions (gray bars) and cases without fusions (red bars) were classified using the ELN guidelines2 into the categories favorable, intermediate, and adverse. The numbers indicate the respective number of patients. (B) Cases were divided into cases without fusion (n = 362), cases with known fusions (n = 160), and cases with novel fusions only (n = 50) and analyzed according to the respective ELN subgroup (favorable, intermediate, adverse). The frequency of the ELN risk groups in the respective subcohorts is denoted in %.
Detected AML fusions classified according to ELN 2017. (A) Cases with fusions (gray bars) and cases without fusions (red bars) were classified using the ELN guidelines2 into the categories favorable, intermediate, and adverse. The numbers indicate the respective number of patients. (B) Cases were divided into cases without fusion (n = 362), cases with known fusions (n = 160), and cases with novel fusions only (n = 50) and analyzed according to the respective ELN subgroup (favorable, intermediate, adverse). The frequency of the ELN risk groups in the respective subcohorts is denoted in %.
Moreover, for AML cases, we analyzed the variant allele frequency (VAF) of the respective fusions on the genetic level (using WGS data) to estimate whether the novel fusion might be present in the main clone or in a subclone only (supplemental Table 5). For this analysis, only cases with novel fusions only (96 fusions in 50 cases) were considered, and cases with a novel fusion cooccurring with an entity-defining fusion were excluded. The median of the detected VAF was 0.22 (range, 0.03-0.62), and for 23/96 (24%) of cases, a VAF ≥0.3 was detected, suggesting the presence of the respective fusion in the majority of malignant cells (supplemental Table 5). These novel fusions comprise EIF3E-RUNX1, MSI2-TLK2, RBPMS-FGFR1, CBL-DDX6, TRAK2-CREB1, CBFB-HMGB1, TTBK2-WRAP53, TCF4-SOX5, and BRAP-RCAN1. Of these 23 novel fusions with a high VAF, 8 (35%) comprised 1 gene that was previously described to play a role in hematological malignancies.
Because it can be assumed that the detected novel fusion might contribute to pathogenesis of the disease in cases without a concomitant (1) entity-defining abnormality, (2) complex karyotype, or (3) a TP53 mutation, we selected all cases with novel fusions for these criteria. After this filtering, 7 cases in AML and MDS remained, respectively, comprising the fusions TAF4-NOL4L, RUNX1-TMEM50B, ZMYND8-C20orf203, TMEM242-H2AFZ, CTDSP1-CFLAR, CD164-SLC15A2, MSI2-TLK2 (all detected in AML), GOSR1-C17orf75, ATP13A3-XXYLT1, SMYD3-EFCAB2, ANKRD11-PKD1L3, MAP3K2-TMEM163, XRCC4-CYFIP2, and CLINT1-EDIL3 (all detected in MDS).
Gene networks and functional annotation of genes involved in novel fusions
For MDS cases, for all genes involved in fusions only 1 partner gene was detected. However, for AML cases, for several genes a number of different partner genes were found. The largest network of gene connections was formed by KMT2A, with 7 different partner genes (known: MLLT10, MLLT3, MLLT1, ELL, ACACA, ARHGEF12; novel: NCBP1), followed by ETV6 and RUNX1, with 5 different partner genes, respectively [ETV6: known: MN1, novel: BHMT, FAAP100, ARNTL2, SMCO2; RUNX1: known: RUNX1T1, novel: THOC6, EIF3E, OPHN1, TMEM50B]). Moreover, 3 different rearrangements were found for CBFB (known: MYH11; novel: HMGB1, TTC3), DDX6 (novel: CBL, USP28, CEP164), NUP98 (known: NSD1, KDM5A; novel: XRN1), and PML (known: RARA, CDC6; novel: ZNF106) (Figure 4).
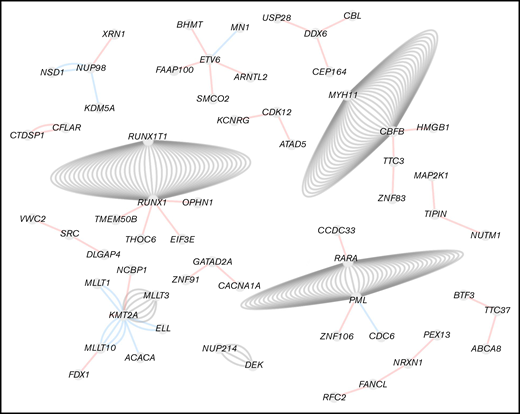
Fusion gene network in AML. Filtered fusions were imported in Cytoscape and visualized as a network where nodes represent genes and edges represent fusions. Unconnected fusions comping only 2 nodes were removed. The color of the edges corresponds to the fusion annotation. Red, novel fusion; blue, known fusion; gray, canonical fusion.
Fusion gene network in AML. Filtered fusions were imported in Cytoscape and visualized as a network where nodes represent genes and edges represent fusions. Unconnected fusions comping only 2 nodes were removed. The color of the edges corresponds to the fusion annotation. Red, novel fusion; blue, known fusion; gray, canonical fusion.
Furthermore, a functional annotation of the genes involved in novel fusions only (see previous section) was performed using the human protein atlas database (https://www.proteinatlas.org/), which provides the protein class the gene product belongs to. This application revealed a large number of potential functional relevant genes in both AML and MDS novel fusions, which were annotated as transcription factors (n = 28 in AML, n = 2 in MDS [eg, ARNTL2, ID1, SOX5, GATAD2A, SMAD2, TGIF1]), enzymes (n = 42 in AML, n = 9 in MDS; [eg, CFLAR, USP28, BCAT1, BRAP, DDX25, BUB1B]) cancer-related (n = 35 in AML, n = 8 in MDS; [eg, ERCC1, DDX6, GNA13, ZFHX3, MSI2, NUTM1]), disease-related in general (n = 57 in AML, n = 10 in MDS; [eg, WNK1, MYO9B, THOC6, SAMD9, PEX13]), RAS pathway members (n = 5 in AML, n = 1 in MDS; [eg, BRAP, PIK3R1, MAP2K1]), or transporters (n = 11 in AML, n = 4 in MDS; [eg, SLC7A9, ABCA8, NRXN1, ANXA6]) (supplemental Figures 1 and 2; supplemental Table 6).
Discussion
In the present study, WTS reliably detected all known fusions in AML and MDS patients that were known before to be present using standard diagnostics and that served as control group for our analyses. Moreover, after this proof of principle, WTS also identified a large number of novel fusions (n = 112 in AML and n = 14 in MDS), which were all validated by WGS and/or cytogenetics (including CBA and/or FISH and/or array CGH). Of these 112 novel fusions in AML, 16 were detected in cases with concomitant entity-defining translocations; thus, 96 novel fusions in 50 cases remained that constitute the “novel fusions only” group. In line with previous data on the fusion landscape in AML and MDS, novel fusion transcripts were also found to be much more common in AML than in MDS patients. Moreover, WTS proved to be especially a powerful tool for detection of cytogenetic cryptic aberrations, and for detection of intrachromosomal fusions, which are often missed by CBA analyses, and thus illustrates the shortcomings of conventional diagnostic methods in these cases. Thus, WTS has the potential to detect new druggable targets and markers for sensitive MRD monitoring, showing its clinical significance particularly in cases so far lacking a respective target or marker. This is underlined by the large number of functional relevant genes involved in the novel fusions, indicating a number of interesting fusions with potential impact on pathogenesis of the respective patients. One example for this is the fusion MSI2-TLK2, detected with a high VAF (0.4) in an AML patient lacking entity-defining alterations or a complex karyotype, comprising 2 genes with interesting functions (MSI2: transcriptional regulator; TLK2: serine/threonine kinase)25-27 ; thus, the respective fusion might be of interest for pathogenesis of this patient. Another example with potential therapeutic relevance is the RBPMS-FGFR1 fusion that was detected in a patient with complex karyotype so far lacking any entity-defining or targetable aberrations; hence, the use of FGFR1 inhibitors might be of use for this patient.
The largest networks of gene connections were mainly detected for genes well known to function in the pathogenesis of myeloid malignancies: KMT2A, ETV6, RUNX1, CBFB, NUP98, and PML. Some novel fusions observed for KMT2A (NCBP1-KMT2A), PML (ZNF106-PML), and CBFB (TTC3-CBFB) were found in cases that also harbored a KMT2A-MLLT3, PML-RARA, and CBFB-MYH11 rearrangement, respectively, which were observed before by cytogenetics and which were also detected by WTS in the control group. This might indicate that these fusions arose from either unbalanced rearrangements involving the 3 respective genes or from complex translocations involving an additional locus because it was described for the CDC6-PML fusion, caused by expression of a chimeric PML-CDC6-RARA messenger RNA in addition to a PML-RARA transcript.28
Cases with novel fusions frequently harbored TP53 mutations and a complex karyotype, especially in AML patients, although it has to be mentioned that the parameters found to be associated with the novel fusions (TP53 mutations, complex karyotype, older age, adverse risk group according to the ELN 2017 guidelines) are all interrelated. Generally, AML with complex karyotype is known to be associated with TP53 mutations and show a very poor outcome.1,10 The AML cohort we investigated included a higher number of cases with complex karyotype compared with the MDS cohort (71/572 vs 11/630 cases). Nevertheless, it can be concluded that the frequency of gene fusions in AML with complex karyotype, which was so far unknown, is high (>50% in our cohort). From the 83 fusions in 38 AML cases with complex karyotype, only 8 fusions derived from typical aberrations including deletions in 5q, 7q, and 17p (GNA13-MYO1D, RAP1GAP2-CCDC144A, RHBDF2-ST6GALNAC2, RPL38-DDX52, BTF3-TTC37, PIK3R1-HAPLN1, PRKAA1-UBLCP1, and EZH2-PUS7). In line with this, the majority of fusions in AML with complex karyotype are inter-chromosomal (48/83, 58%), contributing to the high frequency of translocations between chromosomes in AML patients.
Although the correlation between novel fusions, TP53 mutations and complex karyotype is striking, the cases with novel fusions without the presence of a prognostically relevant parameter (entity-defining alteration, complex karyotype, TP53 mutation) form the group in which the detected novel fusion might most likely function in development of the disease. Applying these parameters, 7 fusions in each AML and MDS cases remain that seem to be the most interesting candidates for further functional investigations. Considering that novel fusions might also play a role for future therapeutic approaches in cases with complex karyotype so far lacking a targetable alteration, we also filtered the novel fusions according to functional criteria; they are: (1) in-frame, (2) have a high VAF (≥0.3), and (3) do not coexist with entity-defining fusions. Applying these criteria, the following fusions fall into that category: MAP2K1-TIPIN, MFSD8-TXK, KMT2A-ARHGEF12, BUB1B-HSD17B6, SRC-VWC2, GNA13-MYO1D, ZNRF1-ZFPM1, DDX6-CEP164, RBPMS-FGFR1, and CACNA1A-GATAD2A. The example of the RBPMS-FGFR1 fusion described above in more detail nicely shows that the detection of novel fusions targetable with already existing therapies (in this case, FGFR1 inhibitors) might improve therapeutic options for patients so far lacking a targetable alteration.
In a recent study investigating chromosomal locations of genes involved in >10,000 fusions using the Mitelman Database of Chromosome Aberrations and Gene Fusions in Cancer, a significant association between gene content of chromosomes and chromosome bands and the number of genes involved in fusions was observed. This suggests that the majority of gene fusions detected nonrecurrently by massively parallel sequencing methods including RNAseq are merely stochastic events and that the respective gene fusions are passengers without a role in pathogenesis.29 However, the detection of potential targetable fusions in our cohort in cases without any detected driver event so far, suggests that identification of certain novel fusions by RNAseq indeed offers novel therapeutic options for the respective patients.
Taken together, we identified a high number of novel fusions especially in AML patients, providing additional insight into the complex genetic landscape of AML. The presence of novel fusions was found to be associated with a high frequency of TP53 mutations and with a complex karyotype. Particularly in cases without an entity-defining abnormality, some of the identified novel fusions hold the potential to provide additional therapeutic options for the respective patients or offer the opportunity for developing markers for patient-sensitive MRD monitoring (on the respective rearrangement on the DNA level). Future functional studies should aim to differentiate which of these fusions are merely passenger events or which might be a driver event playing a role in pathogenesis of the respective patient.
For original data, please contact anna.stengel@mll.com.
Acknowledgments
The authors thank all coworkers at the MLL Munich Leukemia Laboratory for their dedicated work and all the physicians who provided samples, cared for patients, and collected data.
Authorship
Contribution: C.H., R.S., and A.S. designed the study; C.H., R.S., and A.S. interpreted the data; A.S. wrote the manuscript; A.S. and C.H. were responsible for chromosome banding and FISH analyses; W.W., S.H., and M.M. undertook molecular and bioinformatic analyses; W.K. performed immunophenotyping; T.H. undertook cytomorphologic analyses; and all authors read and contributed to the final version of the manuscript.
Conflict-of-interest disclosure: C.H., W.K., and T.H. declare part ownership of Munich Leukemia Laboratory (MLL). A.S., W.W., S.H., and M.M. are employed by the MLL. R.S. received grant support from Torsten Haferlach Leukämiediagnostik Stiftung, Munich, Germany.
Correspondence: Anna Stengel, MLL Munich Leukemia Laboratory, Max-Lebsche-Platz 31, 81377 München, Germany; e-mail: anna.stengel@mll.com.

