

Key Points
NK cell IR robustness leads to lower disease recurrence, whereas CD20+ B cells and CD8+CD11b− T cells lead to lower NRM.
Collective contributions of posttransplant event-related IR and graft source type might yield better posttransplant outcomes in CBT.

Abstract
We evaluated the kinetics of immune reconstitution (IR) after allogeneic hematopoietic cell transplantation (HSCT) and analyzed the clinical effect of IR on posttransplant outcomes. Absolute lymphocyte and its subset counts were measured using flow cytometry on days 28, 100, 180, 365, and 730 after transplantation in 358 adult patients who underwent HSCT between 2009 and 2017. On day 100 after HSCT, 310 surviving patients were analyzed. Bone marrow transplantation (BMT), peripheral blood stem cell transplantation (PBSCT), and cord blood transplantation (CBT) were performed in 119, 55, and 136 patients, respectively. Mature B-cell and differentiated natural killer (NK) cell subset counts significantly increased after CBT. The 2-year overall survival (OS), nonrelapse mortality (NRM), cumulative incidence of relapse, and chronic GVHD in BMT, PBSCT, and CBT were 62%, 67%, and 76% (P = .021); 17%, 17%, and 13% (P = .82); 33%, 40%, and 27% (P = .063); and 43%, 45%, and 28% (P = .025), respectively. Multivariate analysis showed that higher CD16+CD57− NK cell counts correlated with lower disease relapse, whereas higher CD20+ B-cell counts correlated with lower NRM. OS-favoring factors were higher CD16+CD57− NK cell count (hazard ratio, 0.36; 95% confidence interval, 0.22-0.60; P < .001) and CD20+ B-cell count (hazard ratio, 0.53; 95% confidence interval, 0.30-0.93; P < .001) and lower Disease Risk/HCT-Specific Comorbidity index score. Collective contribution of graft source-specific and event-related immune reconstitution might yield better posttransplant outcomes in CBT.
Introduction
Allogeneic hematopoietic stem cell transplantation (HSCT) is a curative therapy for hematological malignancies, as it induces immunological reactions of donor cells against host cells. However, immunity is impaired in the first month, and recovery of cell counts can take years, as immune reconstitution (IR) profiles of the various cell subsets have distinct timelines.1 Successful donor-derived IR is affected by various factors including thymic involution of the host, donor age, conditioning regimen, graft type, stem cell dose, donor-host disparity, graft-versus-host disease (GVHD) prophylaxis, and presence of GVHD/infection. Although successful IR after allogeneic HSCT is compositely associated with superior outcomes,2,3 comprehensive studies investigating the role of variations in immune cell populations and their effect on posttransplant outcomes are lacking.
Multiparameter flow cytometry (FCM) enables the identification of lymphocyte subsets and their maturation during IR as T, B, or natural killer (NK) cells and myeloid-derived effector subsets. Rapid lymphocyte repopulation with T, B, and NK cells, as identified by FCM, reportedly reduces the incidence of infections, GVHD, and disease relapse.4-7 A comparison of graft sources shows that umbilical cord blood (UCB) grafts contain lower total nuclear cell numbers compared with bone marrow (BM) cell/peripheral blood stem cell (PBSC) counts. This difference results in delayed neutrophil/platelet engraftment, associated with posttransplant events and regular IR.1,3,8 In contrast, both B and NK cells appear to recover rapidly after UCB transplantation, resulting in lower mortality risk.9,10 Further, available data on IR after UCB transplantation comprise only few reports with small sample sizes, use of double cords, and various different conditioning intensities.11-14 Waller et al15 recently reported that the kinetics of cell IR predict survival in allogeneic BM and granulocyte colony-stimulating factor mobilized PBSC recipients in a prospective nationwide study that used data from the Blood and Marrow Transplant Clinical Trials Network (BMT CTN) 0201 study. Their findings revealed graft source–related IR disparity among unrelated BM and PBSC donors in terms of timelines and roles of various immune cells in posttransplant outcomes.
All graft sources have unique advantages and disadvantages, and thus, no clear reasons exist for ranking these sources for allogeneic HSCT. Therefore, this study aimed to investigate the kinetics of lymphocyte subsets of the various stem cell sources at different points to provide clarity on the prognosis of cell-dependent outcomes. Hence, we describe the analysis of relatively large data sets on IR and outcomes in patients with hematological malignancies who had undergone allogeneic HSCT. The analysis comprised 4 major aspects: use of easy 2-color FCM, sequential temporal analysis, comparison of IR among various graft sources, and survival outcome.
Patients and methods
Patients
This study included all adult patients (aged ≥18 years; n = 358) with hematological malignancies who underwent their first allogeneic HSCT between April 2009 and December 2017. Clinical data were obtained from the medical charts of the Kanagawa Cancer Centre. Patients who died/experienced graft failure before day 100 after allogeneic HSCT, or were without a peripheral blood (PB) sample on day 100 after allogeneic HSCT were excluded from survival analysis (n = 48). As described here, lymphocyte subsets were identified by FCM, and immunoglobulin G level was measured on days 28, 100, 180, 365, and 730 after allogeneic HSCT. Graft sources included donor UCB, BM, and PBSC and were not modified by in vivo or ex vivo T-cell depletion. The Hematopoietic Cell Transplantation-Specific Comorbidity Index (HCT-CI) and the refined Disease-Risk Index (R-DRI) were employed as previously described.16,17 GVHD prophylaxis mainly consisted of tacrolimus or cyclosporine administration with a short course of methotrexate, and 15 patients were administered antithymocyte globulin combination prophylaxis. Tacrolimus-based GVHD prophylaxis was used for unrelated donor recipients. Posttransplant cyclophosphamide was not used. Diagnosis and grading of acute and chronic GVHD were performed as previously described.18,19 Primary systemic treatment was defined as intervention after an event of chronic GVHD. Myeloablative conditioning regimens were defined as administration of cyclophosphamide (120 mg/kg) and more than 8-Gy total body irradiation or busulfan (>8 mg/kg oral or >6.4 mg/kg IV). Reduced-intensity conditioning (RIC) regimens included fludarabine (125 mg/m2) plus melphalan (80 or 140 mg/m2) with 2- or 4-Gy total body irradiation or busulfan (3.2 mg/kg, IV). RIC regimens were routinely conducted for patients older than 45 years. Human leukocyte antigen (HLA) matching was performed for alleles in BM or PBSC (HLA-A, HLA-B, HLA-C, and DRB1). Minimal HLA typing requirements were at least 4 of 6 HLA matches with the recipient (HLA-A, HLA-B, and HLA-C). UCB units were usually selected according to 4-6/6 HLA match and contained total nuclear cell at a dose of at least 2.0 × 10⁷/kg per unit. Patients with an RIC regimen who underwent allogeneic HSCT other than HLA identical siblings also received 4 Gy total body irradiation. Regardless of graft source, all patients routinely received prophylactic levofloxacin, fluconazole, and acyclovir. All patients received lenograstim (5 μg/kg per day) from day 5 until recovery to an absolute neutrophil count of 0.5 × 10⁹ cells/L for 3 consecutive days. Neutrophil engraftment was defined as the first day of absolute neutrophil count of 0.5 × 10⁹ cells/L for 3 consecutive days in PB. Complete donor chimerism was defined as at least 95% of leukocytes being donor derived in BM, as measured by fluorescence in situ hybridization, using specific probes for sex chromosomes or multiplex short tandem repeat polymerase chain reaction. All patients underwent chimerism testing and FCM for IR on day 100 after allogeneic HSCT. The median values of cell counts used for IR measurements at each point were graded as high (≥median) or low (<median). Early IR was defined when patients experienced a higher cell count on day 100 from allogeneic HSCT. The IR data were not transformed, and numerical and categorical data were handled at an independent data analysis center. This study was approved by the institutional review board of the Kanagawa Cancer Centre and conducted in accordance with the Declaration of Helsinki.
Methods
Flow cytometry analysis.
Immune cell subsets in PB samples were analyzed by FCM at days 28, 100, 180, 365, and 730 after allogeneic HSCT. Time windows were allowed for sample collection within 15 days (at days 28 and 100) and 30 days (at days 180, 365, and 730). At least 10 000 lymphocytes were measured to ensure adequate evaluation. Viable lymphocytes were gated using forward scatter/side scatter and 7-amino actinomycin D staining. Absolute lymphocyte cell (ALC) counts of cell subsets were calculated as the percentage of the respective cell populations determined using flow cytometry. Fluorochrome-conjugated monoclonal antibodies specific for the following surface antigens were used; namely, CD2, CD3, CD4, CD8, CD11b, CD11c, CD16, CD25, CD29, CD56, CD57, CD45RA, and CD45RO. Samples were acquired on a Gallios cytometer, and data were analyzed using the Kaluza software (Beckman Coulter, Brea, CA).
Statistical analysis.
Fisher’s exact test and Wilcoxon rank-sum test were used for univariate analysis, whereas multiple logistic regression analysis was conducted for multivariate analysis to compare the baseline characteristics of patients, graft sources, and absolute lymphocyte subset counts. Kruskal-Wallis 1-way analysis of variance was used to compare median cell counts among graft sources with respect to recovery timelines. Using the receiver-operating characteristic curves, we tested the threshold cell counts for survival and compared these values with the median counts from day 100 data. For this analysis, overall survival (OS) was defined as time elapsed from the day 100 after transplantation to the day of death or last contact. Disease-free survival was defined as from the day 100 of transplantation to the day of death, relapse, or last contact. Landmark analyses of survival at different points were performed using the Kaplan-Meier method to analyze OS and DFS.20 Log-rank test was used for univariate analysis, and the Cox proportional hazard model was used for multivariate analysis of OS.21 Cumulative incidence of relapse (CIR), nonrelapse mortality (NRM), and GVHD were evaluated using the Fine and Gray model for univariate and multivariate analyses of data at a landmark time of 100 days after allogeneic HSCT. NRM and relapse were defined as competing risks. We used a backward-stepwise selection algorithm and retained only the statistically significant variables in the final model. Thus, regression analyses using log-transformed continuous absolute cell counts as covariates were performed to verify the results from binary covariate models. Cluster analysis was performed based on the expression profile of the cells present and hazard ratios of outcomes. Using the pvclust plugin (version 1.3-0) for R (R Foundation for Statistical Computing, Vienna, Austria), cluster distance was measured using Ward’s methods, and a dendrogram was plotted using a Euclidean distance matrix.22 Differences between means were considered statistically significant at 2-sided P < .05. Statistical analyses were performed using EZR (Saitama Medical Centre, Jichi Medical University, Saitama, Japan), which is a graphical user interface for R.23
Results
Patient characteristics
A total of 358 adult patients with hematological malignancies who underwent allogeneic HSCT at the Kanagawa Cancer Centre and had data available on IR were included in the study. The characteristics of excluded patients are presented in supplemental Table 1. Among these, at the pivotal landmark time of 100 days, cord blood transplantation (CBT), peripheral blood stem cell transplantation (PBSCT), and BM transplantation (BMT) were performed in 136, 119, and 55 patients, respectively. Patient characteristics, categorized by graft sources, are summarized in Table 1. Clinical incidence of posttransplant events before 100 days after allogenic HSCT varied partially based on the graft source (supplemental Table 2). Median age tended to be different among patients grouped according to graft sources, and was approximately 8 years greater in CBT compared with BMT or PBSCT (P = .062). Both HLA-antigen and donor relationship showed graft-specific differences. Multiple logistic regression analysis showed a statistical correlation only between HLA compatibility and graft source.
Patient characteristics
| Basement characteristics | ALL (N = 310) | CB (N = 136) | BM (N = 119) | PBSC (N = 55) | P |
|---|---|---|---|---|---|
| Age, median (range), y | 51 (18-69) | 54 (18-69) | 47 (18-68) | 45 (18-69) | .062 |
| ≥51 | 160 (51.6) | 95 | 46 | 19 | <.001 |
| ≤51 | 150 (48.4) | 41 | 73 | 36 | |
| Sex, male, n (%) | 181 (58.4) | 73 (53.7) | 70 (58.8) | 38 (69.1) | .126 |
| HCT-CI, n or n (%) | |||||
| 0-2 | 196 (62.8) | 87 | 78 | 30 | .39 |
| ≥3 | 114 (36.8) | 49 | 41 | 25 | |
| Disease, n or n (%) | |||||
| AML | 168 (54.2) | 73 | 68 | 27 | .74 |
| ALL | 78 (25.2) | 37 | 28 | 13 | |
| MDS | 44 (14.2) | 19 | 15 | 10 | |
| CML | 9 (2.9) | 3 | 5 | 1 | |
| ML | 5 (1.6) | 3 | 1 | 1 | |
| Other | 6 (1.9) | 1 | 2 | 3 | |
| Refined-disease risk index, n or n (%) | |||||
| Low | 82 (26.4) | 37 | 32 | 13 | .92 |
| Intermediate | 92 (29.7) | 37 | 44 | 11 | |
| High | 70 (22.6) | 31 | 18 | 21 | |
| Very high | 66 (21.3) | 31 | 25 | 10 | |
| GVHD prophylaxis, n or n (%) | |||||
| Tacrolimus + sMTX | 230 (74.2) | 133 | 78 | 18 | <.001 |
| Cyclosporine + sMTX | 80 (25.8) | 2 | 40 | 37 | |
| Conditioning regimen, n or n (%) | |||||
| Myeloablative | 111 (35.8) | 34 | 58 | 19 | .036 |
| Reduced intensity | 199 (64.2) | 101 | 61 | 36 | |
| HLA antigen, n or n (%) | |||||
| 6/6 match | 157 (50.6) | 13 | 99 | 44 | .013 |
| 5/6 match | 57 (18.4) | 33 | 18 | 6 | |
| 4/6 match | 94 (30.0) | 88 | 2 | 4 | |
| 3/6 match or less | 3 (1.0) | 2 | 0 | 1 | |
| Donor relation, n or n (%) | |||||
| Related donor | 84 (27.1) | 0 | 40 | 44 | <.001 |
| Unrelated donor | 226 (72.9) | 136 | 79 | 11 | |
| Sex mismatch (donor to patient), n or n (%) | |||||
| Female to male | 75 (24.2) | 35 | 24 | 18 | .28 |
| Other | 235 (75.8) | 91 | 104 | 37 | |
| Diagnosis to transplant (NA = 1), d | |||||
| Median (range) | 189 (22-1373) | 108 (22-865) | 223 (99-1373) | 154 (38-987) | .04 |
| <180, n or n (%) | 147 (47.4) | 74 | 45 | 27 | .031 |
| ≥180, n or n (%) | 162 (52.2) | 62 | 73 | 28 |
ALL, acute lymphoblastic leukemia; AML, acute myeloid leukemia; CML; chronic myeloid leukemia; MDS, myelodysplastic syndrome; ML, malignant lymphoma; NA, data not available; sMTX, short-term methotrexate.
Immune reconstitution and cell contribution to outcomes after allogeneic HSCT
An overview of IR is shown in Figure 1. Temporal measurements of the cells present in PB confirmed immune system reconstitution. Comprehensive IR data are summarized in supplemental Table 3. In addition, we examined the difference between median values and threshold cell numbers for outcomes, describing receiver-operating characteristic curves (supplemental Table 4). In the earliest phase on days 28 after allogeneic HSCT, the median value of ALC, CD4+ T-cell subsets, and CD8+ T-cell, CD3+CD56+ NKT cell, and CD3−CD56+ NK cell counts were higher in PBSCT than in BMT/CBT. However, ALC as well as CD20+ B-cell, CD4+ T-cell subsets (CD4+, CD4+CD25+. CD4+CD29+, CD4+CD45RO+, CD4+CD45RO−, CD4+CD45RA+), and NK cell subsets (CD3−CD56+, CD16+CD57−) at day 100 were significantly higher in CBT. Conversely, CD8+ T-cell subsets (CD8+CD11b+, CD8+CD11b−) and CD3+CD56+ NKT cell median counts were significantly lower at day 100 after CBT. Through a long-term observation, ALC, CD20+ B cells, CD4+CD45RA+ T cells, and NK cells (expressed as CD3−CD56+ and CD16+CD57−) were significantly higher from early phase in CBT (all P < .001). In contrast to NK cells, delayed CD8+ T-cell recovery was observed in CBT compared with BMT and PBSCT. However, CD4+ T-cell expansion could be temporally confirmed in both memory T-cell and effector T-cell subsets in CBT, and the overall graft source–related IR differences gradually decreased over time. Median immunoglobulin G values were markedly higher in the late phase (≥180 days) in CBT (P < .001), resulting in nearly equal levels across graft sources.
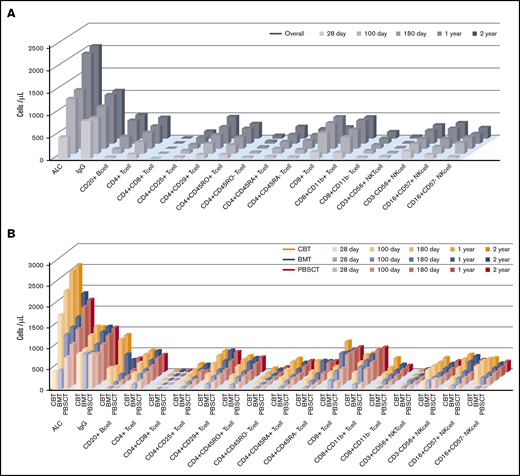
Visual overview of posttransplant IR in terms of time and graft source. Comprehensive IR data are summarized in supplemental Table 2. (A-B) ALC and CD20+ B- cell, CD4+CD45RA+ T-cell, and NK-cell counts (expressed as CD3−CD56+ and CD16+CD57−) were significantly higher during the early phase in all UCB recipients (all P < .001). In contrast to NK cells, the observation of CD8+ T-cell recovery was delayed in UCB recipients compared with that in BM and PBSC recipients. However, CD4+ T-cell expansion was temporally confirmed in memory T-cell and effector T-cell subsets in UCB recipients, and the overall difference in graft source–related IR gradually decreased over time.
Visual overview of posttransplant IR in terms of time and graft source. Comprehensive IR data are summarized in supplemental Table 2. (A-B) ALC and CD20+ B- cell, CD4+CD45RA+ T-cell, and NK-cell counts (expressed as CD3−CD56+ and CD16+CD57−) were significantly higher during the early phase in all UCB recipients (all P < .001). In contrast to NK cells, the observation of CD8+ T-cell recovery was delayed in UCB recipients compared with that in BM and PBSC recipients. However, CD4+ T-cell expansion was temporally confirmed in memory T-cell and effector T-cell subsets in UCB recipients, and the overall difference in graft source–related IR gradually decreased over time.
Subgroup analysis showed that there were distinct differences in NK-cell and B-cell subset recovery across conditioning intensities and graft sources. In terms of NK cell recovery, RIC affected rapid IR in CBT, although in B-cell recovery there was a significant difference associated with the graft source rather than the conditioning intensity (supplemental Figure 1).
Landmark analyses of all lymphocyte subsets and different points for OS are shown in supplemental Figure 2. Specific points of IR (days 100 and 180) were greatly associated with higher cell numbers and better OS, whereas later phases of IR (days 365 and 730) showed a balanced immune system and did not show a significant difference between IR and OS. These 3 levels of IR evidence (reconstitution of immune cells, comparison with median and receiver-operating characteristic cutoff values, and landmark analyses at different points) showed the importance of day 100 median cell counts for further analyses after allogeneic HSCT.
Multivariate analysis for chronic GVHD, NRM, CIR, and OS, based on lymphocyte subset counts identified by FCM on day 100 after allogeneic HSCT, was performed. A forest-plot of IR outcomes is shown in Figure 2A. A lower incidence of chronic GVHD was significantly correlated with higher levels of CD4+CD25+ T cells (hazard risk [HR], 0.48; 95% confidence interval [CI], 0.18-0.91; P = .041) and CD16+CD57− NK cells (HR, 0.45; 95% CI, 1.78-0.93; P = .027). Likewise, a higher incidence of chronic GVHD was associated with higher levels of CD8+CD11b+ T cells (HR, 2.38; 95% CI, 1.14-8.20; P = .012) and CD3+CD56+ NKT cells (HR, 1.29; 95% CI, 1.08-4.91; P = .025). Two cell types were associated with a lower incidence of NRM; namely, higher levels of CD8+CD11b− T cells (HR, 0.33; 95% CI, 0.21-0.48; P < .001) and CD20+ B cells (HR, 0.26; 95% CI, 0.18-0.65; P = .009). Further, IR of 2 differentiated NK cell subtypes was associated with lower CIR, and higher levels of CD16+CD57+ NK cell contributed to better CIR (HR, 0.42; 95% CI, 0.20-0.72; P = .036). Finally, higher levels of 4 cell types were associated with better OS; namely, CD20+ cells (HR, 0.44; 95% CI, 0.20-0.92; P = .003), CD8+CD11b− T cells (HR, 0.41; 95% CI, 0.18-0.71; P = .010), CD16+CD57+ NK cells (HR, 0.68; 95% CI, 0.23-0.84; P = .007), and CD16+CD57− NK cells (HR, 0.33; 95% CI, 0.12-0.90; P = .002), respectively. A heat map describing the hierarchical clustering analysis showed degrees of cells HR for outcomes. Immunological similarity were confirmed after posttransplant events (Figure 2B).

Contribution of immune cell subsets to posttransplant outcomes. (A) Forest plot of multivariate analysis results for posttransplant outcomes. (B) Heat map showing similarity in immune cells confirmed after posttransplant events (sorted hierarchically by HR). These results revealed that each lymphocyte type is predictive of specific posttransplant events.
Contribution of immune cell subsets to posttransplant outcomes. (A) Forest plot of multivariate analysis results for posttransplant outcomes. (B) Heat map showing similarity in immune cells confirmed after posttransplant events (sorted hierarchically by HR). These results revealed that each lymphocyte type is predictive of specific posttransplant events.
Clinical outcomes after allogeneic HSCT
Median follow-up duration was 872 days (range, 103-3299 days) for all patients. The 2-year probability of OS, cumulative incidence of NRM, CIR, and chronic GVHD were 69.3% (95% CI, 0.63-0.74), 15.1% (95% CI, 0.11-0.20), 30.7% (95% CI, 0.24-0.50), and 38.6% (95% CI, 0.26-0.45), respectively. The expansion of key cell subsets, namely, CD8+CD11b− T cells, CD20+ B cells, and CD16+CD57− NK cells, significantly positively affected outcomes (Figure 3); these key cell subsets had similar effects on survival outcomes in CBT, BMT, and PBSCT (supplemental Figure 3).
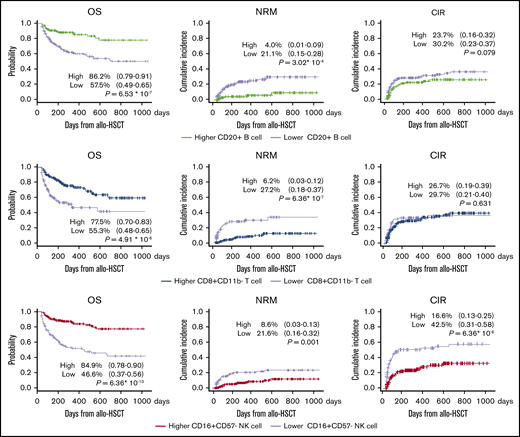
Expansion of key cell subsets; namely, CD20+B cells, CD8+CD11b−T cells, and CD16+CD57−NK cells, significantly positively affected 2-year OS. There were no significant differences in CIR or proportions of high vs low cell counts for CD20+ B cell and CD8+CD11b- T cell subsets. NRM benefits were found to be lower (range, 17%-21%) in patients with early IR of these cells. CIR was confirmed to be approximately 26% lower in patients with early IR of CD16+CD57− NK cells.
Expansion of key cell subsets; namely, CD20+B cells, CD8+CD11b−T cells, and CD16+CD57−NK cells, significantly positively affected 2-year OS. There were no significant differences in CIR or proportions of high vs low cell counts for CD20+ B cell and CD8+CD11b- T cell subsets. NRM benefits were found to be lower (range, 17%-21%) in patients with early IR of these cells. CIR was confirmed to be approximately 26% lower in patients with early IR of CD16+CD57− NK cells.
Given these immunological specifications, we compared disease risk at transplantation with CD16+CD57− NK cell recovery at 100 days after allogeneic HSCT for OS and found that OS and DFS were significantly better with rapid NK cell recovery (Figure 4A). Further, there was significant difference in survival curves based on the HCT-CI classification with CD20+ B-cell recovery. Surprisingly, rapid CD20+ B-cell recovery yielded longer OS even in patients with higher HCT-CI (≥3; Figure 4B).
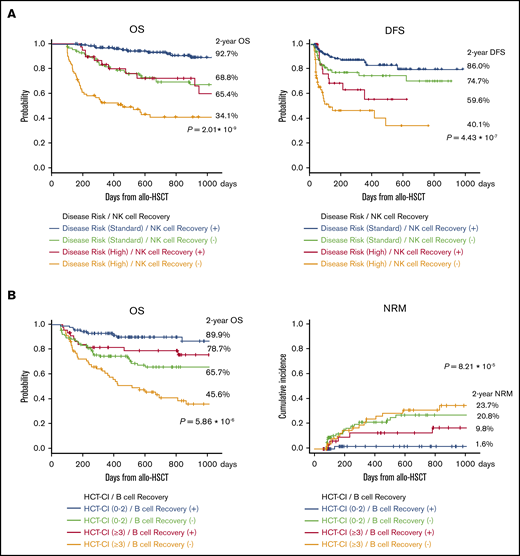
Survival curves after allogeneic HSCT. (A) OS and DFS were significantly better with rapid NK cell recovery. (B) Early IR of CD20+ B cells yielded longer OS and NRM even in patients with higher HCT-CI (≥3).
Survival curves after allogeneic HSCT. (A) OS and DFS were significantly better with rapid NK cell recovery. (B) Early IR of CD20+ B cells yielded longer OS and NRM even in patients with higher HCT-CI (≥3).
The 2-year probability of OS, cumulative incidence of NRM, and CIR in CBT, BMT, and PBSCT, were 76.4% (95% CI, 0.67-0.83), 62% (95% CI, 0.52-0.70), and 67.2% (95% CI, 0.51-0.80; P = .021); 13.4% (95% CI, 0.07-0.31), 17.2% (95% CI, 0.11-0.25), and 16.6% (95% CI, 0.06-0.29; P = .82); and 26.7% (95% CI, 0.16-0.37), 33.1% (95% CI, 0.22-0.44), and 39.6% (95% CI, 0.19-0.50; P = .063), respectively. At 100 days, the cumulative incidence of grade 2 to 4 and grade 3 to 4 acute GVHD after CBT, BMT, and PBSCT was 40.4% (95% CI, 0.31-0.53), 54.2% (95% CI, 0.44-0.62), and 45.2% (95% CI, 0.29-0.57; P = .201), and 5.2% (95% CI, 0.02-0.09), 11.6% (95% CI, 0.06-0.17), and 16.6% (95% CI, 0.06-0.28; P = .047), respectively. Likewise, the 2-year cumulative incidence of chronic GVHD was 27.5% (95% CI, 0.17-0.37), 43.1% (95% CI, 0.31-0.53), and 44.5% (95% CI, 0.26-0.58; P = .025), suggesting that graft sources-related outcomes were confirmed, respectively (Figure 5).

Effect of graft source on the following outcomes after allogeneic HSCT. OS (A), CI-NRM (B), CI-relapse (C), acute grade 2 to 4 GVHD (D) and grade 3 to 4 GVHD (E), and chronic GVHD (F). Graft source–related outcomes were confirmed for OS, cumulative incidence of acute GVHD (≥grade 3), and chronic GVHD. Our data demonstrated rapid graft-related IR and revealed the clinical effects of posttransplant outcomes using lymphocyte subset analysis on day 100 after allogeneic HSCT. These results suggest that a specific IR profile after CBT yields superior posttransplant outcomes.
Effect of graft source on the following outcomes after allogeneic HSCT. OS (A), CI-NRM (B), CI-relapse (C), acute grade 2 to 4 GVHD (D) and grade 3 to 4 GVHD (E), and chronic GVHD (F). Graft source–related outcomes were confirmed for OS, cumulative incidence of acute GVHD (≥grade 3), and chronic GVHD. Our data demonstrated rapid graft-related IR and revealed the clinical effects of posttransplant outcomes using lymphocyte subset analysis on day 100 after allogeneic HSCT. These results suggest that a specific IR profile after CBT yields superior posttransplant outcomes.
Multivariate analyses for OS, NRM, and CIR are shown in Table 2. Four prognostic factors for CIR were identified and are as follows; R-DRI (HR, 1.38; 95% CI, 1.04-1.78; P < .001), a shorter duration between diagnosis and allogeneic HSCT (HR, 0.69; 95% CI, 0.63-0.99; P = .049), and a higher levels of CD16+CD57+ NK cell (HR, 0.51; 95% CI, 0.26-0.94; P = .034) and CD16+CD57− NK cell (HR, 0.38; 95% CI, 0.24-0.80; P = .009). UCB recipients tended to show lower relapse risk (P = .060). Five prognostic factors for NRM were identified as lower scores of HCT-CI (HR 0.58; 95% CI, 0.32-0.88; P = .008), higher risks in R-DRI (HR 1.24; 95% CI, 1.02-2.58; P < .001), experience of acute GVHD (≥ grade 2; HR, 1.58; 95% CI, 1.01-2.48; P < .0.46), and a higher levels of CD20+ B cells (HR, 0.34; 95% CI, 0.11-0.68; P = .007) and CD8+CD11b− T cells (HR, 0.35; 95% CI, 0.22-0.49; P = .004). Five predictors for OS were lower scores of HCT-CI (HR, 0.41; 95% CI, 0.26-0.63; P = .002), advanced risk in R-DRI (HR, 2.35; 95% CI, 1.15-5.48; P < .001), and higher levels of CD20+ B cells (HR, 0.39; 95% CI, 0.20-0.74; P < .001), CD8+CD11b− T cells (HR, 0.40; 95% CI, 0.24-0.69; P < .001), and CD16+CD57− NK cells (HR, 0.31; 95% CI, 0.18-0.82; P < .001).
Multivariate analysis for OS, NRM, and CIR
| Variables | n (%) | OS | NRM | CIR | ||||||
|---|---|---|---|---|---|---|---|---|---|---|
| Multivariate analysis | Multivariate analysis | Multivariate analysis | ||||||||
| HR | 95% CI | P | HR | 95% CI | P | HR | 95% CI | P | ||
| Clinical factors | ||||||||||
| Age (<51 y) | 150 (48.4) | 1.55 | 0.80-3.29 | .194 | ||||||
| Male sex | 181 (58.4) | 1.12 | 0.60-2.12 | .729 | ||||||
| HCT-CI, <3 | 114 (36.8) | 0.41 | 0.26-0.63 | .002 | 0.58 | 0.32-0.88 | .008 | |||
| R-DRI | 2.35 | 1.15-5.48 | <.001 | 1.24 | 1.02-2.58 | .046 | 1.38 | 1.04-1.78 | <.001 | |
| Low risk | 82 (26.4) | 0.62 | 0.34-1.26 | .140 | 0.44 | 0.21-1.09 | .082 | 0.75 | 0.58-0.97 | .033 |
| Intermediate risk | 92 (29.7) | 1.00 | Ref. | 1 | Ref. | 1.00 | Ref. | |||
| High risk | 70 (22.6) | 2.27 | 1.22-3.59 | .002 | 1.34 | 0.59-3.02 | .550 | 1.84 | 1.04-3.34 | .038 |
| Very high risk | 66 (21.3) | 6.15 | 1.83-6.03 | <.001 | 1.98 | 0.98-4.35 | .061 | 4.73 | 2.52-7.15 | <.001 |
| Conditioning regimens (RIC) | 199 (64.2) | 0.87 | 0.4-1.08 | .060 | 0.80 | 0.39-1.57 | .489 | |||
| Donor relation (related donor) | 84 (27.1) | 1.24 | 0.88-1.20 | .192 | ||||||
| HLA compatibility (HLA match) | 173 (55.8) | 0.89 | 0.49-1.59 | .688 | 0.86 | 0.51-1.24 | .317 | |||
| Stem cell sources | ||||||||||
| CB | 136 (43.9) | 0.66 | 0.30-1.41 | .281 | 0.60 | 0.36-1.02 | .060 | |||
| BM | 119 (38.4) | 1.00 | Ref. | 1.00 | Ref. | |||||
| PBSC | 55 (17.7) | 0.79 | 0.45-1.41 | .432 | 1.21 | 0.66-2.15 | .482 | |||
| Sex mismatch (female to male) | 75 (24.2) | 2.74 | 0.94-7.62 | .059 | 0.81 | 0.52-1.15 | .162 | |||
| Diagnosis to transplant (<180 d) | 146 (47.1) | 0.69 | 0.63-0.99 | .049 | ||||||
| Grade 2-4 acute GVHD by day 100 | 130 (42.0) | 0.93 | 0.61-1.42 | .729 | 1.58 | 1.01-2.48 | .046 | 0.65 | 0.41-1.00 | .051 |
| Immunologic factors | ||||||||||
| CD20+ B cell (high) | 135 (43.5) | 0.39 | 0.20-0.74 | <.001 | 0.34 | 0.11-0.68 | .007 | |||
| CD8+CD11b− T cell (high) | 194 (62.6) | 0.40 | 0.24-0.69 | <.001 | 0.35 | 0.22-0.49 | .004 | |||
| CD3−CD56+ NK cell (high) | 210 (67.7) | 0.65 | 0.39-1.08 | .090 | 0.51 | 0.47-1.84 | .290 | |||
| CD16+CD57− NK cell (high) | 185 (59.7) | 0.31 | 0.18-0.82 | <.001 | 0.92 | 0.43-1.15 | .081 | 0.38 | 0.24-0.80 | .009 |
| CD16+CD57+ NK cell (high) | 162 (52.3) | 0.75 | 0.43-1.30 | .306 | 0.89 | 0.41-2.50 | .870 | 0.51 | 0.26-0.94 | .034 |
Discussion
This study both generated and comprehensively analyzed large-scale data to provide clarity on prognosis of cell-dependent outcomes and differences resulting from stem cell sources. To the best of our knowledge, no study has addressed these aspects of allogeneic HSCT. Our primary focus was to compare the reconstitution kinetics of lymphocytes and to identify their prognostic value with respect to outcomes. We show that immune cell content on day 100 after allogeneic HSCT had a greater effect on outcome compared with R-DRI and HCT-CI as well. Three key subsets (CD16+CD57− NK cells, CD20+ B cells, and CD8+CD11b− T cells) were identified as independent predictors of disease relapse and NRM, and thereby, OS. Human CD16+CD57− NK cells are recognized as terminally mature NK cells. Their activation occurs both by producing interferon-γ and by cytotoxic activity, which are especially enriched in UCB grafts.8,24-27 Some studies have reported the potential kinetics of differentiated NK cells with respect to posttransplantation outcomes, especially during relapse,24,28,29 GVHD, and NRM.15,24,27,28 In contrast, CD20+ B cells are well-known as mature B cells that are activated after allogeneic HSCT and show expansion in CBT.4,30,31 Apart from the expansion of absolute cell counts, stromal cells and T cells are also thought to be important for optimal B-cell development and functionality,12,32 and greater numbers of stromal progenitors and primitive hematopoietic stem cells have been reported after CBT compared with BMT or PBSCT.33 Thus, observational studies have ascribed important roles for stem cell source, conditioning regimen, and GVHD in B-cell reconstitution. B-cell recovery has also been reported to affect posttransplant infections and vaccine responses to encapsulated bacteria.24,27,30-32 In chronic GVHD, poor B-cell IR appears to be mainly a result of reduced numbers of B-cell progenitors and unswitched memory B cells,33-35 and we show similarities in major phenotypic features of both NK and B-cell function after allogeneic HSCT.
The CD8+CD11b− T cell is an effector T cell that has historically been called the cytotoxic effector T cell. Lately, CD11b (Mac-1) has been confirmed as an important marker to distinguish between recently activated effector CD8+ T cells and memory cells.36 Thus, conventional dendritic cells are functionally distinguished by the expression of CD11b as well.37,38 In a humanized mouse model, human myeloid DCs expressing CD8+CD11b− DC subset showed cross-presentation for binding to certain antigen-presenting cells and presenting extracellular antigens. During infection with intracellular pathogens, conventional dendritic cells without CD11b become major presenters of pathogenic antigens, promoting CD8+ T-cell responses against invading pathogens. Targeting vaccine antigens to CD8+ DCs has proved to be an effective method of inducing cytotoxic T lymphocytes and antibody responses. Two-color FCM can broadly identify a cell population based on CD8+CD11b− expression; this population would have features of both effector CD8 cells and functional mDCs. Presented results might partially explain these preclinical findings in real-world clinical settings for the first time.
Different stem cell sources yield varying immune system reconstitution profiles after allogeneic HSCT, and there are many confounding factors that preclude a simple comparison among graft sources. Here, using large-scale cell number data, we show specific and unique IR profiles depending on stem cell source. Some large retrospective studies have analyzed the clinical effect of temporal identification of lymphocyte subsets on patient outcomes using FCM.23,39,40 However, reports including higher counts of CBT cases are lacking. Interestingly, a similar result has been shown in children, wherein, without serotherapy for T-cell depletion, overall T-cell IR was comparable after CBT, BMT, and PBSCT, even though CD8+ T-cell IR was faster after both BMT and PBSCT, whereas regulatory T cells (Tregs) and CD4+ T-cell recovery was faster in CBT.41 Recently, a retrospective study has described UCB-dominant posttransplant outcomes in children with acute myeloid leukemia and has compared sources such as single UCB, double UCB, matched sibling donor, and matched unrelated donor.42 Waller et al15 studied very large numbers of IR data from BMT CTN 0201 study of unrelated BM vs granulocyte colony-stimulating factor mobilized PBSC grafts. Using IR monitoring by FCM and functional immunity by staining plasma cytokines, analysis of day 100 as a landmark time was linked to the development of GVHD. Their findings showed faster IR in recipients of BM vs granulocyte colony-stimulating factor mobilized PBSC after unrelated allogeneic HSCT and predicted cell-related outcomes including the significance of naive CD4+ T cells and CD8+ T cells in a higher incidence of chronic GVHD. Notably, the study population was mainly taking myeloablative conditioning regimens, and all patients received graft sources from unrelated donors. Comparatively, our study included higher numbers of CBT, RIC regimens, and related donors. Further, our data showed opposite kinetics of IR for CD4+ T-cell subsets among all graft sources: lower CD4+ T-cell count during the early phase but higher CD4+ T-cell count during the late phase in CBT. This graft source–related difference might reflect a lack of clinical significance of CD4+ T cells in this study.
Our data confirm both rapid and prolonged UCB-dominant reconstitution with respect to ALC, CD20+ B cells, and NK cells. Specifically, higher levels of naive T cells and CD8+ T cells were observed even after 2 years in PBSCT. Taking cellular IR and graft sources into account, our results show that specific lymphocyte type predicts certain posttransplant events. We believe that these findings will help clinicians consider IR-related specification for the choice of stem cell source.
This study has some limitations apart from its retrospective study design, which led to the available data being heterogeneous and incomplete in some cases. We have no data on PB chimerism to describe the origin of lymphocytes. Second, comparison of recipients with different graft sources is an important issue, as potential differences can arise when patients receive UCB from alternative donor sources. Next, UCB recipients tended to be approximately 8 years older than the BM and PBSC recipients. Hence, the UCB recipient group had greater numbers of older patients, CMV reactivation, and severe infection compared with other graft-type recipients. Nonetheless, they experienced better OS and lower incidence both of higher-grade acute GVHD and severe chronic GVHD, suggesting that an early reconstituting lymphocytes profile might have produced better outcomes after allogeneic HSCT. Finally, clinical information on factors such as severe infection, use of corticosteroids, and acute GVHD were limited. Undoubtedly, further multicenter studies are warranted to uncover other determinants of IR, immunological function, and posttransplant outcomes. Even though this is a single-center retrospective analysis, we show, for the first time, the combined effects of reconstituting cells and outcomes, its correlations among graft sources, and outcome prognosis after allogeneic HSCT.
Acknowledgments
This clinical study was supported by all patients with hematologic malignancy and physician’s effort on the clinical frontline. The authors thank all the patients who participated in this study and staff members who gathered fresh blood samples and saved data as big data. For long-term survival observation, patients in this study were followed up mainly by the Yokohama Cooperative Study Group for Hematology.
Authorship
Contribution: T.A. and H.K. conceptualized the study; T.A. designed the research and collected data, analyzed data, and wrote the manuscript; T.T., MT., and H.K. developed analysis and supervised the manuscript; and all authors contributed to manuscript revision and have read and approved the submitted version.
Conflict-of-interest disclosure: The authors declare no competing financial interests.
Correspondence: Taiki Ando, Department of Hematology, Kanagawa Cancer Centre, 2-3-2 Nakao, Asahi-ku, Yokohama 241-8515, Japan; e-mail: taimo029@kcch.jp.

