

Key Points
Donor source does not affect relapse, nonrelapse mortality, or survival for children undergoing transplant for AML.
Umbilical cord blood recipients have better cGVHD-LFS compared with matched unrelated adult donor recipients.

Abstract
When hematopoietic stem cell transplant (HSCT) is necessary for children with acute myeloid leukemia (AML), there remains debate about the best stem cell source. Post-HSCT relapse is a common cause of mortality, and complications such as chronic graft versus host disease (cGVHD) are debilitating and life-threatening. To compare post-HSCT outcomes of different donor sources, we retrospectively analyzed consecutive transplants performed in several international centers from 2005 to 2015. A total of 317 patients were studied: 19% matched sibling donor (MSD), 23% matched unrelated donor (MUD), 39% umbilical cord blood (UCB), and 19% double UCB (dUCB) recipients. The median age at transplant was 10 years (range, 0.42-21 years), and median follow-up was 4.74 years (range, 4.02-5.39 years). Comparisons were made while controlling for patient, transplant, and disease characteristics. There were no differences in relapse, leukemia-free survival, or nonrelapse mortality. dUCB recipients had inferior survival compared with matched sibling recipients, but all other comparisons showed similar overall survival. Despite the majority of UCB transplants being HLA mismatched, the rates of cGVHD were low, especially compared with the well-matched MUD recipients (hazard ratio, 0.3; 95% confidence interval, 0.14-0.67; P = .02). The composite measure of cGVHD and leukemia-free survival (cGVHD-LFS), which represents both the quality of life and risk for mortality, was significantly better in the UCB compared with the MUD recipients (HR, 0.56; 95% confidence interval, 0.34-1; P = .03). In summary, the use of UCB is an excellent donor choice for pediatric patients with AML when a matched sibling cannot be identified.
Introduction
Matched sibling donor (MSD) hematopoietic stem cell transplant (HSCT) remains the standard approach for high-risk or relapsed acute myeloid leukemia (AML). In approximately 70% of cases, a matched sibling is not available,1 and there is much debate as to the best alternative donor source. How alternative donor sources compare in current treatment eras has not been studied in the pediatric population. In many centers, matched unrelated donors (MUDs) are the alternative donor of choice; however, MUD transplantation requires the identification of a donor and planning of collection. As well, MUD transplantation requires a high degree of HLA matching, limiting donor options. In addition, MUD recipients have high rates of chronic graft-versus-host disease (cGVHD), which can have lifelong and debilitating consequences on pediatric patients.2-5 However, these risks are potentially counterbalanced by rapid donor engraftment and acceptable rates of relapse. During the last 25 years, umbilical cord blood (UCB) has proven to be an acceptable alternative stem cell donor source, and has been increasingly used for HSCT of patients with leukemia.1,6-10 UCB as an alternative donor source has many logistical advantages. First, the cells are already procured, infectious disease tested, and HLA typed, so they are typically quick to obtain. In UCB transplantation, there is a greater allowance for HLA disparity between donor and recipient, substantially increasing the donor pool for harder-to-match patients.8,11 Moreover, UCB transplantation has published historical rates of cGVHD that are lower than MUD.12,13 However, UCB transplantation has historically been associated with delayed neutrophil and platelet recovery, as well as higher rates of infectious complications and treatment-related mortality (TRM), when compared with MUD recipients.14,15 These historical disadvantages have been overcome with the recognition of the importance of HLA matching at 8 loci, improving the transplanted cell dose and advances in supportive care. Whether outcomes differ between these 2 alternative stem cell sources in a more contemporary time frame is unknown for pediatric patients needing transplantation.
In adult patients with leukemia, the composite outcome of relapse-free survival and cGVHD has been established as an important endpoint.16,17 The integration of cGVHD into a combined outcome is particularly important in the pediatric population, where cGVHD and its therapies can affect individuals potentially for 60 to 70 years after treatment. In large adult and pediatric studies evaluating risk, cGVHD is specifically associated with poor prognosis and worse long-term survival.18,19 Here we present a large, multicenter retrospective study of 316 pediatric patients with AML evaluating post-HSCT outcomes based on donor source, with a particular emphasis on the effect of stem cell source on the composite outcome that includes both leukemia-free survival (LFS) and cGVHD (cGVHD-LFS).
Methods
Study population and stem cell source
Data on patients aged 0 to 21 years with AML undergoing allogeneic HSCT in a complete remission (CR) were collected retrospectively from 8 international institutions with accredited pediatric bone marrow transplant programs. Data collected included patients who were consecutively transplanted between 2005 and 2015 after a myeloablative conditioning regimen, which contained total body irradiation (> 7 Gy single dose, 1200 or 1320 cGy fractionated), busulfan (>9 mg/kg), or treosulfan (>10 g/m2, depending on age). Patients received a stem cell source that was chosen to be the best available at that time by the treating physician and institution, and included a MSD, MUD, UCB, or double UCB (dUCB). All stem cell sources were T-replete and otherwise unmanipulated; no ex vivo expanded stem cell sources were included in this analysis. High risk was defined as a leukemic clone with monosomy 7, monosomy 5, deletion of 5q, high FLT3 allelic ratio of the internal tandem duplication, or persistent leukemia after chemotherapy. All patients received GVHD prophylaxis per the institutional standard.
MSD and MUD donors were evaluated for match with the recipient at the allele level for HLA-A, HLA-B, HLA-C, and HLA-DRB1, with fully matched being defined as 8 of 8. UCB and dUCB products were evaluated for match with the recipient at the antigen level for HLA-A and HLA-B, and at the allele level for HLA-DRB1, with fully matched being defined as 6 of 6.20,21 For dUCB recipients, matching was determined by the matching between the engrafting unit and the recipient, as previously described.22
Outcomes and statistical analysis
The main outcome of interest was cGVHD-LFS. Events considered for this composite endpoint were moderate and/or severe cGVHD, as graded at the time of cGVHD diagnosis, graft failure, leukemia relapse, and nonrelapse mortality (NRM). Other outcomes of interest were overall survival (OS), LFS, leukemia relapse, NRM, grades II-IV acute GVHD (aGVHD), and cGVHD. Relapse was defined as disease recurrence and NRM as death while in CR. Both graft rejection and nonengraftment were considered graft failure, where in case of nonengraftment, the time was set at day +50 or time of follow-up/death, whichever occurred first. aGVHD and cGVHD were classified according to the Glucksberg23 and Shulman24 criteria.
Duration of follow-up was defined as the time from HSCT to last contact or death. Patients were censored at the date of last contact. Median time to follow-up was calculated using the reverse Kaplan-Meier method.25 Factors, other than stem cell source, considered to influence outcome included patient variables (age at transplantation), treatment variables (conditioning backbone: total body irradiation [TBI] or chemotherapy, conditioning regimen: BuCy-like, BuFlu, BuFluClo, BuMel-like, TBICy-based, other, GVHD prophylaxis cyclosporine [CSA], mycophenolate mofetil [MMF], methotrexate [Mtx], or steroids), donor variables (HLA disparity), and disease variables (baseline risk: high/standard, history of central nervous system [CNS] leukemia: yes/no, CR status: CR1/CR2). Baseline characteristics of patients for different stem cell sources were compared using the Kruskal-Wallis test for categorical covariates and 1-way analysis of variance for continuous variables. Unadjusted probability of cGVHD-LFS, LFS, and OS were computed with the use of the Kaplan-Meier method, and P values were calculated using a 2-sided log-rank test. Unadjusted probability of events subject to competing risk was estimated using cumulative incidence curves, and P values were calculated using Gray’s test. Adjusted estimates for cGVHD-LFS, LFS, and OS were computed using Cox-regression models. The adjusted incidence of events subject to competing risk was calculated using Fine-Gray models. Covariates that were significant in the univariate setting were included in the multivariate models. Model-adjusted estimates correspond to the probability given an equal distribution of model-included covariates in all groups. P values for categorical covariates in the regression models were calculated using Wald’s test, and for continuous covariates using the likelihood-ratio test. P values for cell source comparisons in the secondary outcomes are adjusted for multiple testing, using Bonferroni’s method. Furthermore, a sensitivity analysis was performed for the primary outcome (cGVHD-LFS) to assess center effect. Here, the Cox regression model was refitted, excluding data from each center separately, and the hazard ratio (HR) was recalculated. Statistical analyses were performed using R version 3.2.4 with packages cmprsk, survival, and rms. Deidentified data can be obtained by contacting the corresponding author. The analysis of deidentified patient data was performed in compliance with all applicable federal regulations pertaining to the protection of human subject research and ethical standards, as set forth in the Declaration of Helsinki.
Results
Patient, disease, and transplant characteristics
A total of 317 patients were included in the study (Table 1), and of this group, 61 (19%) patients had an MSD available. Among the alternative donor sources, 73 (23%) patients received a MUD donor, 122 (39%) patients received a single UCB unit, and 61 (19%) received a dUCB. Within the MSD group, 58 patients received bone marrow stem cells and 3 received peripheral blood stem cells, whereas in the MUD group, 51 patients received bone marrow and 22 received peripheral blood stem cells. The median follow-up at the time of the study was 1730 days, and was similar across donor types (MSD, MUD, UCB, dUCB). The median age of patients studied was 10 years and ranged from 0.42 to 21 years; age was comparable among the groups, except for the dUCB, which had a slightly increased age.
Characteristics of patient by donor type
| All | MSD | MUD | UCB | dUCB | P* | |
|---|---|---|---|---|---|---|
| Patients by stem cell source | ||||||
| N (% of total) | 317 (100) | 61 (19) | 73 (23) | 122 (38) | 61 (19) | |
| Median follow-up | 1730 | 1969 | 1468 | 1631 | 1877 | |
| Median age at HSCT (range) | 10 (0.42-21) | 8.7 (0.63-21) | 11 (1-20) | 7.9 (0.42-20) | 13 (1.1-20) | <.001† |
| Remission status at HSCT, n (%) | .0063‡ | |||||
| CR1 | 155 (49) | 42 (69) | 33 (45) | 55 (45) | 25 (41) | |
| CR2 | 162 (51) | 19 (31) | 40 (55) | 67 (55) | 36 (59) | |
| Baseline risk stratification, n (%) | <.001† | |||||
| High | 237 (75) | 31 (51) | 55 (75) | 102 (84) | 49 (80) | |
| CNS status at HSCT, n (%) | .6 | |||||
| CNS-disease | 86 (27) | 20 (33) | 16 (22) | 33 (27) | 17 (28) | |
| Center of HSCT, n (%) | <.001† | |||||
| Australia | 24 (7.6) | 8 (13) | 1 (1.4) | 11 (9) | 4 (6.6) | |
| Denver | 48 (15) | 14 (23) | 11 (15) | 18 (15) | 5 (8.2) | |
| Duke | 58 (18) | 16 (26) | 3 (4.1) | 30 (25) | 9 (15) | |
| Gosh | 16 (5) | 4 (6.6) | 6 (8.2) | 6 (4.9) | 0 (0) | |
| Manchester | 39 (12) | 6 (9.8) | 23 (32) | 7 (5.7) | 3 (4.9) | |
| Minneapolis | 52 (16) | 0 (0) | 10 (14) | 13 (11) | 29 (48) | |
| Seattle | 37 (12) | 6 (9.8) | 14 (19) | 8 (6.6) | 9 (15) | |
| Utrecht | 43 (14) | 7 (11) | 5 (6.8) | 29 (24) | 2 (3.3) | |
| Primary cause of death, n (%) | .14 | |||||
| GVHD | 14 (13) | 1 (6.2) | 1 (4.2) | 7 (17) | 5 (18) | |
| Infection | 12 (11) | 2 (12) | 0 (0) | 5 (12) | 5 (18) | |
| MOF | 4 (3.6) | 1 (6.2) | 2 (8.3) | 1 (2.4) | 0 (0) | |
| Pulmonary disease (NOS) | 9 (8.2) | 1 (6.2) | 2 (8.3) | 3 (7.1) | 3 (11) | |
| Other | 8 (7.3) | 2 (12) | 2 (8.3) | 3 (7.1) | 1 (3.6) | |
| Relapse | 63 (57) | 9 (56) | 17 (71) | 23 (55) | 14 (50) |
MOF, multi-organ failure; NA, not applicable.
P values were calculated using 1-way analysis of variance for continuous variables and Kruskal-Wallis for categorical variables.
Indicates statistical significance.
Level of significance is P < .01.
All patients were in a morphologic remission at the time of transplant, although it did vary whether they were in their first or second remission, based on their donor source, with 69% of MSD recipients being in a CR1 at time of transplant compared with 45%, 45%, and 41% of the MUD, UCB, and dUCB recipients, respectively (P = .006). At diagnosis, 75% of patients in the study cohort were considered high risk. Although the alternative donor (MUD, UCB, and dUCB) recipients were more likely to be high risk (range, 75%-84%), only 51% of the MSD recipients were high risk (P ≤ .001). Few patients had a history of CNS leukemia, and it was equally distributed among the donor types. Minimal residual disease (MRD) testing was not routinely collected at most centers during the era of this investigation; however, for those it was reported (51%), most patients were MRD negative at the time of transplant, and MRD-negative status was equally distributed among the various groups.
As expected, degree of HLA match differed between the donor sources (P = .001). All matched sibling recipients were fully HLA matched (8/8) to their donors, and 92% of the MUD donors were matched at 8/8 at HLA-A, HLA-B, HLA-C, and DRB1, with the remainder mismatched at a single locus (7/8 HLA match). In the single UCB recipients, only 29% were fully HLA matched (6/6 at HLA-A, HLA-B, and DRB1), whereas 43% and 28% were HLA 5/6 and 4/6 loci matched, respectively. In the dUCB recipients only 18% were fully HLA matched (6/6), whereas 49% and 33% were matched at 5/6 and 4/6 HLA loci. As shown in Table 2, myeloablative regimens also differed among the groups (P < .001); chemotherapy-only based regimens were used in 75% of the MSD, 62% of the MUD, and 57% of the UCB transplants. Only 31% of the dUCB received only chemotherapy, with the majority (69%) receiving TBI-based preparation. Nearly all of the MSD transplant preparative regimens (97%) contained no serotherapy; in contrast, 61% of the MUD recipients, 40% of the single UCB recipients, and 16% of the dUCB received serotherapy of some type (P < .001). For those who received serotherapy, the type differed according to stem cell source. Most of the MUD recipients received alemtuzumab, and cord blood (UCB or dUCB) recipients were treated with antithymocyte globulin (ATG). Finally, GvHD prophylaxis also varied by HSC source. The predominant regimen used in both MSD and MUD recipients was a calcineurin inhibitor and methotrexate, whereas UCB recipients most commonly received a calcineurin inhibitor and mycophenolate mofetil (P < .001).
Characteristics of transplant by donor type
| All | MSD | MUD | UCB | dUCB | P* | |
|---|---|---|---|---|---|---|
| Cell dose, median (range) | ||||||
| CD34+ cells, ×106 | 1 (0.01-620) | 9.6 (0.24-620) | 6.4 (0.66-380) | 0.21 (0.02-3) | 0.43 (0.01-11) | <.001† |
| Nucleated cells, ×108 | 1.7 (0.1-460) | 4.9 (0.16-320) | 5 (0.92-460) | 0.62 (0.18-30) | 0.47 (0.1-32) | <.001† |
| HLA-match, n (%) | <.001† | |||||
| 1 mismatch | 89 (28) | 0 (0) | 6 (8.2) | 53 (43) | 30 (49) | |
| >1 mismatch | 54 (17) | 0 (0) | 0 (0) | 34 (28) | 20 (33) | |
| Full match | 174 (55) | 61 (100) | 67 (92) | 35 (29) | 11 (18) | |
| Myeloablation, n (%) | <.001† | |||||
| Chemo-based‡ | 181 (57) | 46 (75) | 46 (63) | 70 (57) | 19 (31) | |
| TBI-based | 136 (43) | 15 (25) | 27 (37) | 52 (43) | 42 (69) | |
| Serotherapy, n (%) | <.001† | |||||
| No serotherapy | 212 (67) | 59 (97) | 28 (38) | 74 (61) | 51 (84) | |
| Antithymocyte globulin | 67 (21) | 1 (1.6) | 9 (12) | 47 (39) | 10 (16) | |
| Campath | 38 (12) | 1 (1.6) | 36 (49) | 1 (0.82) | 0 (0) | |
| GVHD prophylaxis, n (%) | <.001† | |||||
| CSA/MMF | 178 (56) | 21 (34) | 26 (36) | 75 (61) | 56 (92) | |
| CSA/Mtx | 87 (27) | 40 (66) | 47 (64) | 0 (0) | 0 (0) | |
| CSA/steroids | 52 (16) | 0 (0) | 0 (0) | 47 (39) | 5 (8.2) |
P values were calculated using 1-way analysis of variance for continuous variables and Kruskal-Wallis for categorical variables.
Indicates statistical significance.
Busulfan/cyclophosphamide, busulfan/fludarabine, busulfan/fludarabine/clofarabine, busulfan/melphalan.
Engraftment
The median time to neutrophil engraftment was 17 days for MSD recipients and 19 days for both MUD (P = .31) and UCB (P = .03), whereas the dUCB recipients engrafted at 22 days post-HSCT (P < .001; Figure 1A). The median time to platelet engraftment was 28 days for MSD and MUD, with 43 and 45 days for UCB and DUCB, respectively (Figure 1B). At 60 days, the neutrophil engraftment was similar among all cell sources (∼95%). At 180 days post-HSCT, 95% of MSD recipients had engrafted platelets compared with 85% for all other cell sources.
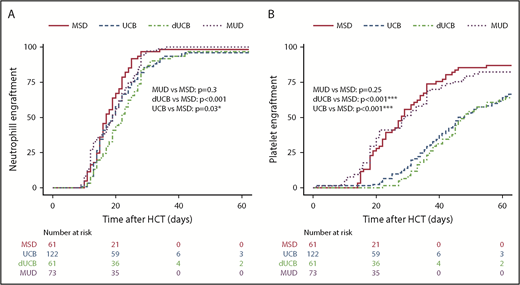
Hematopoietic engraftment. Probability and timeline of neutrophil (A) and platelet (B) recovery by stem cell source.
Hematopoietic engraftment. Probability and timeline of neutrophil (A) and platelet (B) recovery by stem cell source.
Relapse and survival
The likelihood of leukemia relapse in the entire group was 22% (95% confidence interval [CI], 17% to 27%), and the adjusted incidence of relapse was not different among the various stem cell sources (Table 3; Figure 2A). For all patients, disease status before transplant (CR1 vs CR2) did not affect the cumulative incidence of relapse after HSCT (data not shown). The adjusted LFS was 57% (95% CI, 50% to 66%) for all patients and was similar among stem cell sources (Figure 3A). Adjusted NRM at 2 years was 16% (95% CI, 11% to 20%), and again there were no differences among the stem cell sources (Figure 3B). The OS of the entire group was 63% (95% CI, 57% to 70%). MSD recipients fared equally well when compared with MUD and UCB, but had superior survival compared with dUCB (P = .02; Figure 3C). A history of CNS leukemia did not affect relapse or survival (data not shown). The most common causes of death among all donor sources was leukemia relapse (57%), followed by GVHD (13%) and infection (11%); less common causes included noninfectious pulmonary disease (8.2%) and multiorgan failure (3.6%).
Multivariate analysis with covariate considerations
| HR (95% CI) | P | P (unadjusted) | |
|---|---|---|---|
| Relapse incidence | |||
| UCB vs MUD | 0.59 (0.31-1.1) | .84 | .12 |
| MSD vs MUD | 0.71 (0.34-1.5) | 1 | |
| MSD vs UCB | 1.2 (0.59-2.5) | 1 | .59 |
| MSD vs dUCB | 0.91 (0.4-2) | 1 | .8 |
| Chemo-based vs TBI-based | 0.77 (0.45-1.3) | .36 | |
| Age at HCT (spline 1) | 0.86 (0.76-0.97) | .015 | |
| Age at HCT (spline 2) | 1.2 (1-1.4) | .03 | |
| LFS | |||
| UCB vs MUD | 1 (0.62-1.7) | 1 | .9 |
| MSD vs MUD | 0.83 (0.45-1.4) | 1 | .48 |
| MSD vs UCB | 0.77 (0.45-1.3) | 1 | .37 |
| MSD vs dUCB | 0.56 (0.3-1) | .406 | .058 |
| Age at HCT (spline 1) | 0.88 (0.8-0.96) | .0054 | |
| Age at HCT (spline 2) | 1.1 (1-1.3) | .012 | |
| BuCy-like vs BuFlu | 0.43 (0.17-1.1) | 077 | |
| BuCy-like vs BuMel-like | 0.91 (0.5-1.7) | .77 | |
| BuCy-like vs Other | 0.77 (0.4-1.4) | .39 | |
| BuCy-like vs TBI-based | 1 (0.56-1.8) | .99 | |
| Nonrelapse mortality | |||
| UCB vs MUD | 1.6 (0.67-3.8) | 1 | .28 |
| MSD vs MUD | 1.1 (0.37-3.1) | 1 | .89 |
| MSD vs UCB | 0.67 (0.28-1.6) | 1 | .37 |
| MSD vs dUCB | 0.42 (0.16-1.1) | .497 | .071 |
| Chemo-based vs TBI-based | 1.2 (0.62-2.2) | .59 | |
| Age at HCT (spline 1) | 0.94 (0.81-1.1) | .37 | |
| Age at HCT (spline 2) | 1.1 (0.9-1.3) | .49 | |
| OS | |||
| UCB vs MUD | 1 (0.59-1.8) | 1 | .92 |
| MSD vs MUD | 0.67 (0.36-1.3) | 1 | .22 |
| MSD vs UCB | 0.67 (0.36-1.2) | 1 | .16 |
| MSD vs dUCB | 0.43 (0.23-0.83) | .091 | .013 |
| Age at HCT (spline 1) | 0.91 (0.83-1) | .053 | |
| Age at HCT (spline 2) | 1.1 (1-1.2) | .061 | |
| BuCy-like vs BuFlu | 0.34 (0.13-0.91) | .029 | |
| BuCy-like vs BuMel-like | 0.77 (0.38-1.4) | .38 | |
| BuCy-like vs Other | 0.59 (0.3-1.2) | .13 | |
| BuCy-like vs TBI-based | 0.91 (0.5-1.8) | .82 | |
| Incidence of aGVHD grades II-IV | |||
| UCB vs MUD | 1 (0.56-1.8) | 1 | .98 |
| MSD vs MUD | 0.59 (0.3-1.2) | .98 | .14 |
| MSD vs UCB | 0.62 (0.3-1.2) | 1 | .15 |
| MSD vs dUCB | 0.56 (0.29-1.1) | .7 | .1 |
| Chemo-based vs TBI-based | 0.56 (0.36-0.83) | .0046 | |
| Age at HCT (spline 1) | 0.97 (0.89-1.1) | .53 | |
| Age at HCT (spline 2) | 1 (0.9-1.1) | .93 | |
| CSA/MMF vs CSA/Mtx | 2 (1.1-3.7) | .017 | |
| CSA/MMF vs CSA/steroids | 1.4 (0.77-2.4) | .31 | |
| No serotherapy vs ATG | 1.3 (0.83-2) | .3 | |
| No serotherapy vs Campath | 0.91 (0.43-1.8) | .73 | |
| Incidence of aGVHD grades III-IV | |||
| UCB vs MUD | 4.2 (1-18) | .357 | .051 |
| MSD vs MUD | 1.4 (0.33-5.9) | 1 | .64 |
| MSD vs UCB | 0.33 (0.091-1.2) | .658 | .094 |
| MSD vs dUCB | 0.43 (0.12-1.6) | 1 | .22 |
| Chemo-based vs TBI-based | 1 (0.45-2) | .9 | |
| Age at HCT (spline 1) | 0.91 (0.79-1.1) | .21 | |
| Age at HCT (spline 2) | 1.1 (0.93-1.3) | .27 | |
| CSA/MMF vs CSA/Mtx | 1.1 (0.31-3.8) | .88 | |
| CSA/MMF vs CSA/steroids | 2 (0.83-5) | .13 | |
| No serotherapy vs ATG | 1.1 (0.53-2.3) | .8 | |
| No serotherapy vs Campath | 0.91 (0.19-4.2) | .88 | |
| Incidence of cGVHD | |||
| UCB vs MUD | 0.3 (0.14-0.67) | .0217 | .0031 |
| MSD vs MUD | 0.5 (0.21-1.1) | .672 | .096 |
| MSD vs UCB | 1.6 (0.62-4.2) | 1 | .3 |
| MSD vs dUCB | 1.5 (0.59-3.8) | 1 | .41 |
| Chemo-based vs TBI-based | 0.43 (0.24-0.83) | .0076 | |
| Age at HCT (spline 1) | 1.1 (0.93-1.2) | .4 | |
| Age at HCT (spline 2) | 0.9 (0.78-1) | .17 | |
| CSA/MMF vs CSA/Mtx | 2.1 (1.1-4.3) | .032 | |
| CSA/MMF vs CSA/steroids | 3.6 (0.83-16) | .093 | |
| No serotherapy vs ATG | 1.1 (0.53-2.5) | .75 | |
| No serotherapy vs Campath | 1 (0.42-2.3) | .94 | |
| cGVHD-LFS | |||
| UCB vs MUD | 0.56 (0.34-1) | .033 | .033 |
| MSD vs MUD | 0.67 (0.4-1) | .073 | .073 |
| MSD vs UCB | 1.1 (0.67-2) | .65 | .65 |
| MSD vs dUCB | 1 (0.56-1.8) | .95 | .95 |
| Chemo-based vs TBI-based | 0.83 (0.59-1.2) | .37 | |
| Age at HCT (spline 1) | 0.95 (0.88-1) | .16 | |
| Age at HCT (spline 2) | 1 (0.95-1.1) | .41 | |
| CSA/MMF vs CSA/Mtx | 1.7 (1.1-2.8) | .025 | |
| CSA/MMF vs CSA/steroids | 1.5 (0.91-2.6) | .14 |
ATG, antithymocyte globulin.
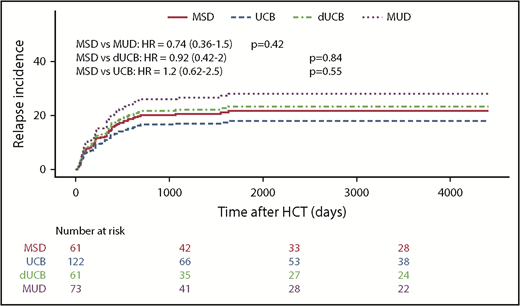
Kaplan-Meier estimates of posttransplant relapse. Incidence of relapse by stem cell source overall.
Kaplan-Meier estimates of posttransplant relapse. Incidence of relapse by stem cell source overall.
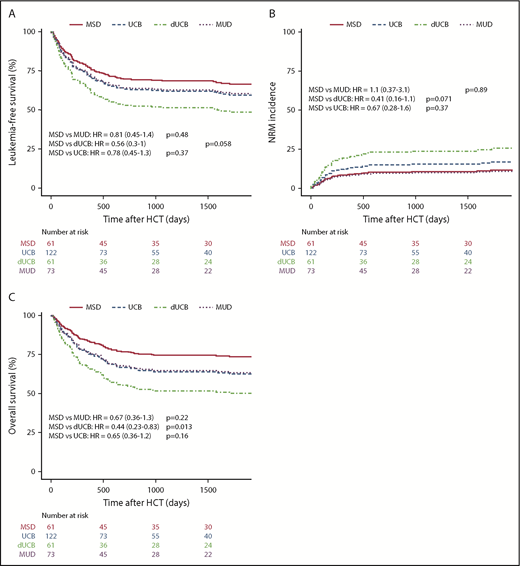
Kaplan-Meier estimates of posttransplant outcomes by stem cell source. LFS (A), nonrelapse mortality (B), and OS (C) compared by stem cell source.
Kaplan-Meier estimates of posttransplant outcomes by stem cell source. LFS (A), nonrelapse mortality (B), and OS (C) compared by stem cell source.
GVHD
The incidence of aGVHD at 180 days was lowest in recipients of MSD grafts, at 24% (13% to 36%), and increased to 43% (31% to 55%; P = .07) for MUD, 52% for UCB (43% to 62%; P < 001), and 56% for dUCB (43% to 69%; P < .001). However, the increased aGVHD incidence in MUD and dUCB was found to be mainly attributable to different GVHD prophylaxis and more TBI-based conditioning in multivariate analyses (Table 3). The higher aGVHD rates in dUCB did not translate into higher rates of cGVHD. Conversely, the adjusted rates of cGVHD after single UCB (21%) and dUCB (22%) were lower than for MUD recipients (48%, Figure 4B).
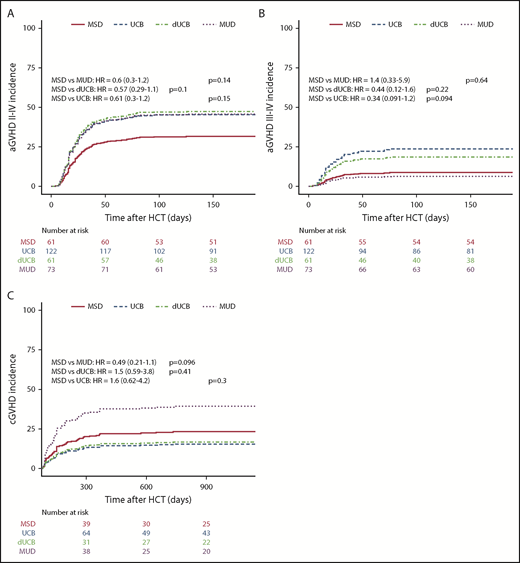
Incidence of GVHD. The incidence of grades II to IV aGVHD (A), incidence of grades III to IV aGVHD (B), and cGVHD (C) compared by stem cell source.
Incidence of GVHD. The incidence of grades II to IV aGVHD (A), incidence of grades III to IV aGVHD (B), and cGVHD (C) compared by stem cell source.
Composite measurement: cGVHD-LFS
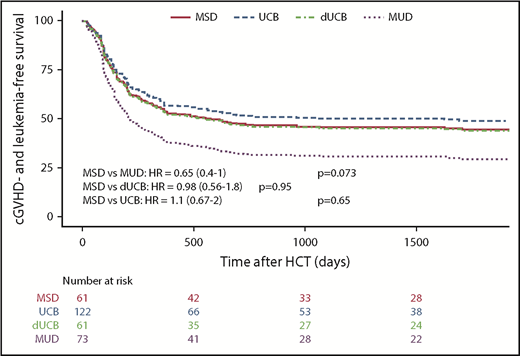
When considering the principal composite endpoint that incorporates adjusted LFS (including graft failure, leukemia relapse, and nonrelapse mortality) and the incidence of moderate and/or severe cGVHD, we found a mean adjusted probability of 37% (27% to 51%). Patients who received a standard MSD HSCT had an adjusted cGVHD-free LFS at 5 years of 44%, whereas UCB (49%) and dUCB (44%) achieved very similar rates. However, MUD recipients had a cGVHD-free LFS of only 29%. Using multiple variate analysis, recipients of MUD transplants had a significantly lower probability of cGVHD-LFS as compared with single UCB recipients (UCB vs MUD HR, 0.56; 0.34-1.0; P = .03; Figure 5). This effect was not transplant center-specific, as the individual center sensitivity analyses had similar results with the HR ranging from 0.56 to 0.71.
Discussion
The goal of hematopoietic cell transplantation for children with AML is to use the immunological graft vs leukemia reactions to eradicate the disease, providing long-term remission and cure. However, this frequently comes with collateral damage in the form of acute and chronic GVHD. The effect of cGVHD is especially detrimental to young children, who are frequently still developing. Because of this and prior data suggesting that different stem cell sources might be associated with varying rates of cGVHD,5,26,27 we compared outcomes of patients receiving different stem cell sources for the composite endpoint of cGVHD-LFS, which is arguably the best endpoint to infer satisfactory outcomes, including quality of life. In this unique and large multi-institutional comparison, we found that MSD and UCB recipients experienced similar outcomes for the primary composite endpoint of cGVHD-LFS, whereas MUD recipients had a significantly lower cGVHD-LFS. No differences in OS, LFS, and relapse rates were noted.
A previous large retrospective CIBMTR analysis of 1525 adult patients with acute leukemia noted equivalent LFS in UCB recipients as compared with MUD recipients.12 Similarly, in a multicenter, retrospective analyses of pediatric patients with leukemia receiving either a well-matched MUD (n = 262) or HLA-disparate UCB (n = 99), the LFS and OS were similar; however, UCB recipients had delayed neutrophil engraftment and a greater incidence of day 100 TRM. Also, in a larger pediatric retrospective study comparing MUD and UCB recipient outcomes (n = 785) from 1995 to 2003, LFS was similar among the groups, but the UCB recipients had longer median times to neutrophil and platelet engraftment and higher rates of TRM, but lower rates of relapse.15 Our multicenter retrospective analysis also showed no difference in relapse rates among the various donor sources. This may reflect transplant in an era in which donor source has less of an effect either because of changing indications for allogeneic transplant in AML28 or, more recently, because MRD-based timing of transplantation likely affects relapse rates. The characteristics of the patients and their grafts in this present analysis were similar to those of the previous studies, but reflect contemporary practices, with higher average cell doses and more robust supportive care. This also has likely contributed to comparable TRM, relapse rates, and hematopoietic (neutrophil and platelet) recovery among the groups. During the era being investigated, many clinical trials assigned patients to undergo HSCT in first remission when a matched sibling donor was available. Our results reflect this trend, with the majority of MSD recipients transplanted while in CR1 (68%) compared with only 41% to 45% of the alternative donor recipients in CR1 at time of transplant. In addition, the presence of high-risk AML features was often a criterion used to proceed into transplant. Not surprisingly, alternative donor recipients more likely to be high risk in our study cohort as compared with MSD recipients. Despite this, we found that neither CR status (CR1 vs CR2) nor high-risk leukemia features affected outcomes.
GVHD can be a severe and life-threatening complication of allogeneic HSCT, although it is counterbalanced by the potential for beneficial graft-versus-leukemia reactions. Similar to prior studies,8,13,14,29,30 we found, in multivariate analysis, similar rates of aGVHD II-IV in UCB and MUD recipients that was comparatively higher than that in MSDs. Likewise, the incidence of cGVHD also did not vary between the groups, although MUD recipients tended toward increased rates of cGVHD, as has been previously reported by others.12,29 Importantly, survival alone does not completely describe a successful post-HSCT outcome. cGVHD is a debilitating and life-threatening transplant complication that significantly affects the quality and quantity of life. In a large study of 1800 adult HSCT survivors, ongoing cGVHD was associated with increased medication needs, decreased employment, and overall decreased resiliency and quality of life.31 Similarly, in a large outcomes study of nearly 2000 pediatric patients, children transplanted for leukemia had decreased survival if they suffered from cGVHD after HSCT. For pediatric AML, the hazard ratio for mortality was 1.7 to 2.34 higher for recipients who experienced any cGVHD.18
Because individual survival and GVHD analyses do not adequately describe the long-term well-being of the recipient after HSCT, Holtan and coworkers developed the novel composite outcome GVHD-free/relapse-free survival (GRFS) and presented it as ideal HSCT recovery that could be used to compare therapies. In their analysis of more than 900 patients, the GRFS at 1 year did not demonstrate any difference between UCB and MUD recipients (31% and 32%, respectively).16 Ruggeri et al more recently published a very large retrospective analysis of adult patients with AML (n = 20 937). The GRFS at 3 years, which better represents long-term well-being, was ∼40% for all sources.17 In our study, we applied this combined outcome analysis to the pediatric AML population, including moderate or extensive cGVHD and excluding the incidence of aGVHD in the combinatorial analysis. We surmised that if there is no conversion into cGVHD, the inclusion of aGVHD was unnecessary in the analysis, as this does not affect long-term morbidity and mortality.
Retrospective analysis of institutional data from a group of international centers comes with inherent limitations; specifically, the potential for bias based on center practices such as which patients receive transplantation, choice of stem cells, preparative regimen, GVHD prophylaxis, treatment, and reporting of outcomes. Furthermore, this study does not draw any comparisons to the more contemporary approach of haploidentical transplant (α/β depletion or post-HSCT cyclophosphamide), which are becoming more common in the pediatric hematologic malignancy setting.32,33 The numbers of haploidentical transplants in this timeframe were unfortunately too small, and the manner by which these transplants were performed is too disparate from the current approach, to allow for inclusion. Ideally, this could be further studied in prospective trials to better understand how haploidentical recipient outcomes compare with UCB and MUDs.
In this large, multicenter analysis, we were able to demonstrate for the first time in a pediatric cohort that UCB recipients experienced improved cGVHD-LFS as compared with MUD recipients. This important finding is further amplified, given that the majority of pediatric patients require an alternative donor for HSCT. Although other endpoints (LFS, OS, and engraftment rates) were equivalent among the various cell sources, the cGVHD-LFS endpoint better reflects the optimal post-HSCT outcome. According to these results, UCB is an excellent alternative cell source if an MSD is lacking. Prospective validation is required.
Authorship
Contribution: All authors contributed to the acquisition, analysis, or interpretation of the data for this article, revised the manuscript critically, approved the final version for publication, and agreed to be accountable for the results presented; and A.K.K. generated first and subsequent drafts of manuscript.
Conflict-of-interest disclosure: The authors declare no competing financial interests.
The current affiliation for J.J.B. is Stem Cell Transplantation and Cellular Therapies Program, Pediatrics, Memorial Sloan Kettering Cancer Center, New York, NY.
Correspondence: Amy K. Keating, University of Colorado School of Medicine, Department of Pediatrics, Children’s Hospital of Colorado, 13123 East 16th Ave, Aurora, CO 80045; e-mail: amy.keating@ucdenver.edu.

