

Key Points
TCR repertoire reconstitution follows identifiable patterns of repertoire reconstitution depending on the recipient MHC match.
TCR repertoire similarity depends on common clones in syngeneic recipients and common and rare clones in MHC mismatched recipients.

Abstract
Graft-versus-host disease (GVHD) is a complication of hematopoietic cell transplantation (HCT) caused by alloreactive T cells. Murine models of HCT are used to understand GVHD and T-cell reconstitution in GVHD target organs, most notably the gastrointestinal (GI) tract where the disease contributes most to patient mortality. T-cell receptor (TCR) repertoire sequencing was used to measure T-cell reconstitution from the same donor graft (C57BL/6 H-2b) in the GI tract of different recipients across a spectrum of matching, from syngeneic (C57BL/6), to minor histocompatibility (MHC) antigen mismatch BALB.B (H-2b), to major MHC mismatched B10.BR (H-2k) and BALB/c (H-2d). Although the donor T-cell pools had highly similar TCR, the TCR repertoire after HCT was very specific to recipients in each experiment independent of geography. A single invariant natural killer T clone was identifiable in every recipient group and was enriched in syngeneic recipients according to clonal count and confirmatory flow cytometry. Using a novel cluster analysis of the TCR repertoire, we could classify recipient groups based only on their CDR3 size distribution or TCR repertoire relatedness. Using a method for evaluating the contribution of common TCR motifs to relatedness, we found that reproducible sets of clones were associated with specific recipient groups within each experiment and that relatedness did not necessarily depend on the most common clones in allogeneic recipients. This finding suggests that TCR reconstitution is highly stochastic and likely does not depend on the evaluation of the most expanded TCR clones in any individual recipient but instead depends on a complex polyclonal architecture.
Introduction
Graft-versus-host disease (GVHD) is a major complication of allogeneic hematopoietic cell transplantation (HCT) that is used to treat hematologic malignancies and many nonmalignant diseases.1-4 Acute GVHD is mediated by donor T cells.1,2 Alloreactive T cells expand clonally within the donor hematopoietic stem cell graft and infiltrate GVHD tissue sites such as the skin, gastrointestinal (GI) tract, and liver. A major question in the field is whether novel technologies that provide high-level resolution of the adaptive immune system, such as T-cell receptor repertoire sequencing (TCR-Seq), might clarify how acute GVHD occurs and possibly one day be used to help guide clinical decision-making to prevent or treat acute GVHD.5-7 A key part of this effort involves methods to measure and understand the reproducibility of T-cell reconstitution after HCT.8-10
Studies involving TCR spectratyping or cloning of specific TCR CDR3 sequences repertoire have shown oligoclonal expansion of T cells in GVHD-affected tissues in mouse models and human studies.2,3,11,12 More recent research using TCR-Seq identified expanded T-cell clones that correlate with GVHD risk and progression.4 The use of TCR-Seq in HCT and GVHD is complicated by the fact that the exact identity of T-cell clones mediating GVHD and their cognate antigens are highly variable and likely unique in humans to each hematopoietic stem cell transplant donor and recipient. It is possible that although the exact identity of alloreactive clones causing GVHD may be different between individuals, their behavior may follow reproducible and measurable patterns.4,13-15
Murine experimental systems of HCT and GVHD offer the opportunity to understand and develop tools to measure TCR reconstitution in a controlled setting.16 Many studies have specifically associated the presence of a restricted TCR VDJ gene usage or identified dominant T cells with GVHD. However, the manifestation of alloreactivity appears highly stochastic, and dominant T-cell clones appear to differ between litter mates of genetically inbred mice.17 Importantly, methods to purge identified alloreactive minor mismatch antigens that drive immune responses in specific strains simply result in immune recognition of alternative antigens.18 This outcome suggests that methods to assess a more complete picture of the TCR repertoire structure are needed.
The focus of the current study was on the question of reproducibility of donor T-cell reconstitution in a controlled setting. We performed transplants at 2 geographically separate centers to control for local environmental factors. We compared the Vα and Vβ TCR CDR3 repertoire reconstitution of the same donor T-cell pool (C57BL/6 H-2b) in different recipient mice of various minor histocompatibility (MHC) mismatches [C57BL/6 syngeneic, BALB.B (H-2b) MHC antigen mismatch; and B10.BR (H-2k) and BALB/c (H-2d)]. Despite the fact that donor T-cell pools had highly similar TCR repertoire at the clonal level, the TCR repertoire that appeared after HCT was highly specific to recipients in each individual experiment independent of geography. Across all experiments, we found that syngeneic recipients exhibited a higher relatedness to the donor GI tract TCR repertoire than any other group in each individual experiment but not to the overall donor T-cell pool. We also found that a single invariant natural killer T (iNKT) clone was identifiable in every recipient group and was enriched in the guts of syngeneic mice compared with all other recipient groups according to clonal count and confirmatory flow cytometry.
By developing and applying statistical analysis of relatedness, we were able to show that the reproducible sets of clones were identified as associating with specific recipient groups within each experiment. Using a novel cluster analysis of TCRα and TCRβ, we were able to classify recipient groups based only on their TCR repertoire relatedness. This outcome suggests that TCR reconstitution seems to be highly stochastic at the level of individual clones and likely does not depend on the evaluation of the most expanded TCR clones in any individual recipient but instead upon a complex polyclonal architecture. In support of this theory, we evaluated the effect of the most common clonal motifs on repertoire relatedness and found that the repertoire relatedness of syngeneic recipients depended on the most common motifs but that the relatedness of allogeneic recipients depended on both the most common and less common clones.
Methods
Transplantation
Independent experiments were performed at Minnesota University (Minneapolis, MN) and Stanford University (Stanford, CA) according to protocols approved by the Institutional Animal Care and Use Committee and Asia Pacific Laboratory Accreditation Cooperation using 8- to 10-week-old mice. For each experiment, the donor pool of 5 × 10⁶ T cell–depleted bone marrow and 1 × 10⁶ T cells selected from spleen and lymph nodes of C57BL/6 mice (MHC: H-2b; The Jackson Laboratory, Bar Harbor, ME) was transplanted into: syngeneic (C57BL/6); minor-mismatched (eg, MHC-matched but with different genetic background), BALB/B (H-2b), bred in a mouse colony; and 2 major-mismatched recipients [B10.BR (H-2k) and BALB/c (H-2d)], both purchased from The Jackson Laboratory (Figure 1A). GI tract tissues were harvested from pretransplant donor mice and recipients at posttransplant day 9 to 11 or day 18 to 32. Samples of the GI tract were obtained from the ascending large intestine just distal to the cecum and from the small intestine at the terminal ileum similarly across all experiments. Donor graft T cells were also sampled. A total of 205 samples from 125 mice were collected; RNA was extracted and analyzed with both TCRα (TRA) and TCRβ (TRB) repertoire. All samples were stored at −80°C in Buffer RLT (Qiagen, Germantown, MD) or RNA Later (Qiagen). Sample information is detailed in supplemental Table 1.
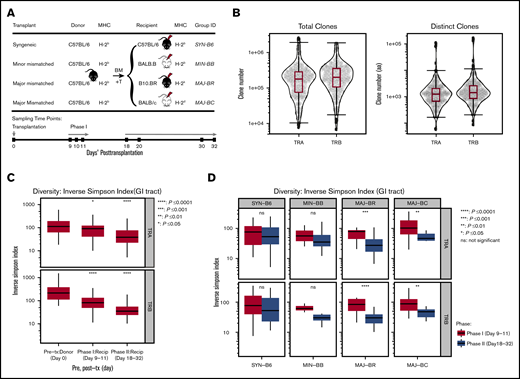
TCR clone numbers and reduced diversity posttransplantation. (A) Schematic diagram of hematopoietic transplantation and sampling of gut tissues and T cells for TCR repertoire analysis. Four different mice strains (C57BL/6, BALB.B, B10.BR, and BALB/c) received hematopoietic stem cell transplantation from the same donor graft (C57BL/6) to evaluate T-cell reconstitution. Donor GI tract tissues and graft T cells were harvested on pretransplant day 0, and recipient tissues were sampled on posttransplant days 9 to 11 (Phase I) and days 18 to 32 (Phase II). (B) TCRA and TCRB repertoire capture. Total and distinct productive clonal sequence counts for all GI samples from all experiments are shown. (C) General trend of TCRA and TCRB diversity across all transplant and recipient groups. Significantly decreased diversity was observed in the GI tract after transplantation, which increased over time (95% confidence interval, ANOVA). (D) Diversity of the TCRA and TCRB repertoire according to mismatch recipient group. Although syngeneic recipients and minor mismatch recipients trended toward decreased diversity over time, major mismatch recipients exhibited statistically decreased diversity (pooled from 5 separate experiments, 2-tailed Student t test). Recip, recipient; tx, transplantation.
TCR clone numbers and reduced diversity posttransplantation. (A) Schematic diagram of hematopoietic transplantation and sampling of gut tissues and T cells for TCR repertoire analysis. Four different mice strains (C57BL/6, BALB.B, B10.BR, and BALB/c) received hematopoietic stem cell transplantation from the same donor graft (C57BL/6) to evaluate T-cell reconstitution. Donor GI tract tissues and graft T cells were harvested on pretransplant day 0, and recipient tissues were sampled on posttransplant days 9 to 11 (Phase I) and days 18 to 32 (Phase II). (B) TCRA and TCRB repertoire capture. Total and distinct productive clonal sequence counts for all GI samples from all experiments are shown. (C) General trend of TCRA and TCRB diversity across all transplant and recipient groups. Significantly decreased diversity was observed in the GI tract after transplantation, which increased over time (95% confidence interval, ANOVA). (D) Diversity of the TCRA and TCRB repertoire according to mismatch recipient group. Although syngeneic recipients and minor mismatch recipients trended toward decreased diversity over time, major mismatch recipients exhibited statistically decreased diversity (pooled from 5 separate experiments, 2-tailed Student t test). Recip, recipient; tx, transplantation.
Sequencing of TCR repertoire
RNAs were isolated from the tissues of GI tract components, splenocytes, or purified T cells with Qiagen RNeasy Mini or Micro Kits. A total of 100 ng to 1 μg RNA were reverse transcribed into first-strand complementary DNA with oligo(dT) and a universal oligo. We applied 5′RACE (rapid amplification of complementary DNA ends) to capture the 5′end of TRA and TRB using a universal primer and TRAC primer (5′>NNNNNNTACACGGCAGGGTCAGGGTTCTGGATA) and TRBC primer (5′>NNNNNNGGCTCAAACACAGCGACCTCGGGTGGGAACAC), which were designed against each constant region of TRA and TRB. The ∼500 bp products covered V, (D), and J gene segments and partial constant region. KAPA Hyper Prep Kit (KK8504; Kapa Biosystems, Wilmington, MA) were used by following the instructions for library preparation of polymerase chain reaction products. The sequencing was performed on a MiSeq sequencer platform (Illumina, San Diego, CA). Eight to 12 samples were pooled together for 1 sequencing run; 300 bp or 250 bp × 2 paired-end FASTQ data were obtained.
VDJ gene segments and CDR3 calling
MiXCR (version 1.8.3)19 was applied to align and assemble the paired-end reads with TCR reference sequences and determine VDJ genes and CDR3 regions of TRA and TRB. Only productive clones were kept and exported for further analysis. VDJTools (version 1.1.1)20 was used to extract VDJ gene usage from MiXCR clone files and pool clones from the same group to generate a clone list for each group. The clones or CDR3 used in the analysis referred to CDR3 amino acid sequences except specifying nucleotide sequences.
iNKT gene frequency in transplant groups
iNKT cells in mice expressed an invariant rearranged Vα14-Jα18 (TRAV11-TRAJ18). Here we summarize the frequency of rearranged TRAV11 and TRAJ18 in TRA clones to estimate iNKT gene expression in samples. Analysis of variance (ANOVA) and Student t test analysis were applied for statistical comparisons of iNKT frequency in each transplant group. To validate the iNKT results from sequencing data, we conducted independent experiments of syngeneic and major-mismatched transplantations by transferring the C57BL/6 bone marrow and T cells into C57BL/6 and BALB/c. Splenocytes and GI tract were harvested and digested, and iNKT cells were stained and performed with flow cytometry analysis on day 9 posttransplantation.
Flow cytometry
The following anti-mouse antibodies for flow cytometry were purchased from eBioscience (San Diego, CA): CD4 (GK1.5), CD8 (53-6.7), and TCRβ (Η57-597). Murine CD1d tetramer loaded with PBS-57 (α-GalCer analog) was obtained from the NIH Tetramer Facility (Atlanta, GA). We used the Fixable Viability Dye eFluor 506 (eBioscience) for dead cell staining. Data were collected by using a BD LSR2 flow cytometer (Becton-Dickinson, San Jose, CA), and data were analyzed by using FlowJo version 10.0.7 software (FlowJo LLC, Ashland, OR).
Statistical analysis
The statistical analysis was performed in R version 3.4.1 (R Foundation for Statistical Computing, Vienna, Austria; 2017-06-30), including Student t tests, ANOVA and post hoc tests, and Pearson correlation analysis. The inverse Simpson index was used to estimate the diversity of TCR repertoire, , as described in a previous report.21 Jaccard index (JI), Bhattacharyya coefficient (BC), and Pearson correlation were used to measure pair-wised repertoire similarity. JI estimated the closeness by calculating the overlapped CDR3 unique clone number divided by the total unique CDR3 clone number: (JI = ). The BC first computed the proportion of shared clones in each sample and normalized the value following the formula: . Both the JI and BC are similarity indices that measure the degree to which TCR clonotype composition of a pair of samples is alike. The JI uses only presence/absence data to compute the ratio of shared to total TCR clonotypes in a pair of samples. The BC uses abundance data to compute the square root of the probability that TCR clonotypes are shared by a pair of samples assumed to be independent; taking the square root gives greater weight to the less abundant shared clones.
The Hellinger distance was used for distance computing based on BC: . The Hellinger distance also ranged from 0 to 1, in which 0 means the 2 populations are identical and 1 indicates that the 2 sets have no overlap. hclust with method ward.D2 in R was used for hierarchical cluster analysis of the Hellinger distance matrix. powerTCR22 applied a spliced threshold model to analyze the clone size distribution of the TCR repertoire. It uses generalized Pareto distribution and a truncated γ distribution to model common clone size distribution and rare clones from the long tail of clone size distribution, respectively. Pairwise Jensen-Shannon distance was used to measure the distance between fitted models of clone size distributions in powerTCR analysis.22,23 The results were visualized by using hierarchical clustering with ward.D2 and multidimensional reduction using principal component analysis in R. Packages of ggplot2, ggpubr, dendextend, and factoextra in R were used for plotting.
Motif identification and the effect of different clonal groups on relatedness
To identify the most abundant amino acid motif used in the TCR repertoire, a window of 3 amino acids slides along the CDR3 sequences. The occurrences of 3-aa motifs were summarized according to their CDR3 counts and ranked by using their counts. The top 10 abundant motifs were identified according to their abundance in each TCR repertoire. The TCR repertoire was divided into 2 subsets: the CDR3 clones carrying the top 10 motifs, and the rest of the CDR3 clones without the top 10 motifs. The frequency of every CDR3 clone in each subset was recalculated by dividing the copy number of the CDR3 and the total number of all CDR3 clones within subsets.
Results
Sequence results and diversity measures
Within each experiment, the donor graft consisted of pooled cells that were used to transplant different recipient mice; however, the donor pool for each experiment was unique to each experiment (Figure 1A). All allogeneic recipient mice developed acute GVHD manifestations, as measured by weight loss, skin ruffling, and confirmatory histology of the gut. We obtained an average of 254 634 (TRA) and 274 894 (TRB) total productive clones and an average of 5605 (TRA) and 7383 (TRB) unique clones (Figure 1B) of a possible estimate of 2 × 10⁶ TCRαβ in a mouse.24 TCR repertoires of every sample are summarized in supplemental Table 1. There was no significant difference across recipient groups in distinct clonal counts (supplemental Figure 1A). An assessment of TCRα and TCRβ diversity in the GI tract revealed no differences between recipient groups at the same time point but did show a decrease in diversity over time in the pooled recipient diversity compared with the pretransplant donor GI tract or with sampling after transplant at later time points (Figure 1C; supplemental Figure 1C). This seems to have been driven by a loss of diversity in the GI tract of major mismatched mice early vs late after transplantation (Figure 1D).
Assessment of shared clones
The shared clones and their numbers of 1 representative experiment are summarized in Figure 2. In this initial analysis of TCR, clones from each individual mouse were pooled to evaluate across recipients. Although only a small number of unique TCR clones in the gut were shared between any recipient TCR pool after transplantation, the most common clones tended to be more commonly identifiable as shared between recipient groups. It did seem that there were clones shared between the donor graft that were specifically found and expanded in only certain recipient groups. In a different evaluation of the data, we assessed the number of clones shared by individual mice in each recipient group. Only a small number of clones were shared among 3 or more mice in each group, with all mice in all recipient groups only sharing 1 clone. This TCR clone (5′> CVVGDRGSALGRLHF<3′) formed by TRAV11 and TRAJ18 gene segments is an iNKT TCR clone.25,26
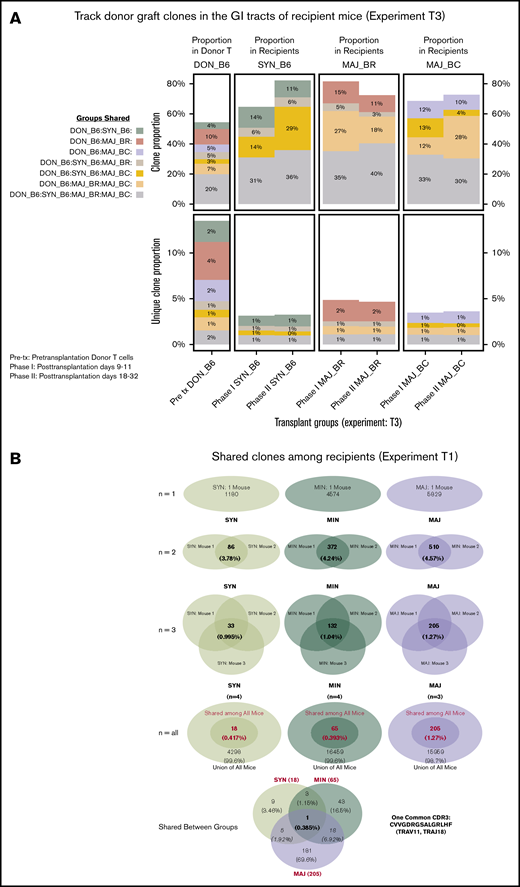
General features of TCRA repertoire reconstitution. (A) Sharing of identifiable TCR clones between the donor graft and pooled TCR clones form the recipient GI tract. Results from 1 representative experiment are shown for total TCR sequences obtained (upper panels) and unique clones (lower panels). T-cell clones from the donor graft were identified as being shared in all, 2, or just 1 recipient group GI tract pooled TCR repertoire at days 9 to 11. A small proportion of the distinct TCR clonal sequences are shared among groups; however, the clones that occur at the most abundant frequency are commonly found across all groups (gray). Distinct donor TCR repertoire can be identified in C57BL6 syngeneic recipients (green), MHC major-mismatched BR10 (red), and BALB/c recipients (purple) or in both major but not syngeneic recipient mice (tan). (B) Sharing of distinct TCR clones among individual recipient mice. A representative transplant experiment is shown (experiment T1; n ≥ 3 mice per group) with degrees of clonal overlap shown by a Venn diagram comparing TCR clones within recipient groups for clones found in any recipient (first row, n = 1), clones found in at least 2 recipients (second row, n = 2), clones found in at least 3 recipients (third row, n = 3), clones found in all recipients within a group (fourth row, n = 3 or 4), and shared clone found across all mice in all transplant recipient groups. The only 1 common clone shared by 3 groups is iNKT CDR3 clone (last row).
General features of TCRA repertoire reconstitution. (A) Sharing of identifiable TCR clones between the donor graft and pooled TCR clones form the recipient GI tract. Results from 1 representative experiment are shown for total TCR sequences obtained (upper panels) and unique clones (lower panels). T-cell clones from the donor graft were identified as being shared in all, 2, or just 1 recipient group GI tract pooled TCR repertoire at days 9 to 11. A small proportion of the distinct TCR clonal sequences are shared among groups; however, the clones that occur at the most abundant frequency are commonly found across all groups (gray). Distinct donor TCR repertoire can be identified in C57BL6 syngeneic recipients (green), MHC major-mismatched BR10 (red), and BALB/c recipients (purple) or in both major but not syngeneic recipient mice (tan). (B) Sharing of distinct TCR clones among individual recipient mice. A representative transplant experiment is shown (experiment T1; n ≥ 3 mice per group) with degrees of clonal overlap shown by a Venn diagram comparing TCR clones within recipient groups for clones found in any recipient (first row, n = 1), clones found in at least 2 recipients (second row, n = 2), clones found in at least 3 recipients (third row, n = 3), clones found in all recipients within a group (fourth row, n = 3 or 4), and shared clone found across all mice in all transplant recipient groups. The only 1 common clone shared by 3 groups is iNKT CDR3 clone (last row).
Evaluation of iNKT cells in recipient mice
By examining the frequency of TRAV11-TRAJ18 genes, we were able to estimate the iNKT expression level in every transplant individual. The frequency of TCRs that include the TRAV11-TRAJ18 rearrangement was as high as 4% of TRA clones was observed in TCR repertoire of many syngeneic transplant mice on posttransplant day 9 or 11 (Figure 3A). However, the iNKT expression of the syngeneic group dropped to 0.34% at posttransplant day 20 or later. ANOVA analysis and post hoc Tukey’s test of all the transplant groups revealed that the syngeneic group on day 9 was significantly higher than the rest of the groups (P < .001). The iNKT cells of minor-mismatched recipient transplant groups on both posttransplant time points were ∼0.2% and 0.1%, whereas few iNKT cells were detected in the 2 major-mismatched groups (∼0.01% at early time point, 0.005%). Pretransplant donor T cells and donor guts possessed 2.2% and 2.6% of iNKT in the TCR repertoire. Using flow cytometry assessment of α-galcer CD1d-tetramer+CD3+ T cells, we confirmed that iNKT cells occur at a greater frequency in the gut of syngeneic mice after transplantation compared with that of allogeneic recipients (Figure 3B-D).
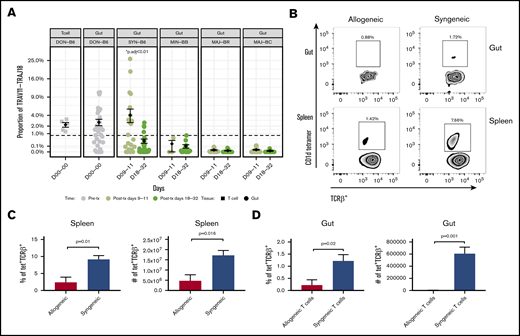
iNKT cell reconstitution in the gut after transplantation. (A) The frequency of the iNKT TRAV11-TRAJ18 gene usage in the donor graft and GI tract of recipients. The percent sequence reads that iNKT account for in the total sequence for each mouse is shown. The middle horizontal bar (in black) indicates the mean values in each group at days 9 to 11 or days 18 to 32 (n > 6 mice per group pooled from 2 experiments; 2-tailed Student t test). (B) Representative dot plots of iNKT staining by flow cytometry for gut and spleen. CD3+TCRab+ T cells (upper panels) and TCRab+CD1d-tetramer+ iNKT cells (lower panels) identified by flow cytometry in single-cell suspension of the spleen and gut of allogeneic BALB/c recipient mice (vs syngeneic C56BL/6; gray bar) days 9 to 11. Quantification of the percent iNKT in the spleen (C) and GI tract (D). Both T and iNKT cells in BALB/c recipients are significantly reduced as a percentage of lymphocytes and in absolute count of mononuclear cells (n > 5 mice per group pooled from 2 experiments; 2-tailed Student t test.).
iNKT cell reconstitution in the gut after transplantation. (A) The frequency of the iNKT TRAV11-TRAJ18 gene usage in the donor graft and GI tract of recipients. The percent sequence reads that iNKT account for in the total sequence for each mouse is shown. The middle horizontal bar (in black) indicates the mean values in each group at days 9 to 11 or days 18 to 32 (n > 6 mice per group pooled from 2 experiments; 2-tailed Student t test). (B) Representative dot plots of iNKT staining by flow cytometry for gut and spleen. CD3+TCRab+ T cells (upper panels) and TCRab+CD1d-tetramer+ iNKT cells (lower panels) identified by flow cytometry in single-cell suspension of the spleen and gut of allogeneic BALB/c recipient mice (vs syngeneic C56BL/6; gray bar) days 9 to 11. Quantification of the percent iNKT in the spleen (C) and GI tract (D). Both T and iNKT cells in BALB/c recipients are significantly reduced as a percentage of lymphocytes and in absolute count of mononuclear cells (n > 5 mice per group pooled from 2 experiments; 2-tailed Student t test.).
CDR3 clone size, decay, and distribution by recipient group
Using the powerTCR22 statistical approach described earlier, we clustered recipient groups by using a composite of CDR3 clone size, decay, and distribution and found that although some recipients of groups clustered together by assessment of the TCR Vα (Figure 4A-C), there was a striking homogeneity and similarity within groups when TCR Vβ was assessed (Figure 4B,D). We also observed that the cluster analysis could separate early time points from later time points in a representative experiment (supplemental Figure 2A). Such clustering according to recipient groups and time points was not observed when comparing repertoire across experiments.
Analysis of TCR repertoire clone size distribution differentiates transplant recipient groups. powerTCR cluster analysis of TCR clone size distribution in representative experiment with 3 recipient groups was visualized by hierarchical clustering of TRA and TRB (A-B) and principal component analysis (C-D) using TRA and TRB. Representative experiment is T1.
Analysis of TCR repertoire clone size distribution differentiates transplant recipient groups. powerTCR cluster analysis of TCR clone size distribution in representative experiment with 3 recipient groups was visualized by hierarchical clustering of TRA and TRB (A-B) and principal component analysis (C-D) using TRA and TRB. Representative experiment is T1.
Relatedness of donor TCR across different experiments
Assessment of the TCR Vα repertoire of the donor pools from different experiments and across geography revealed a very high average relatedness: BC = 0.47 or JI = 0.10 and Pearson correlation = 0.81 (P < .001) (Figure 5A-B). Assessment of the TCR Vβ repertoire also revealed some relatedness but less than for TCR Vα.
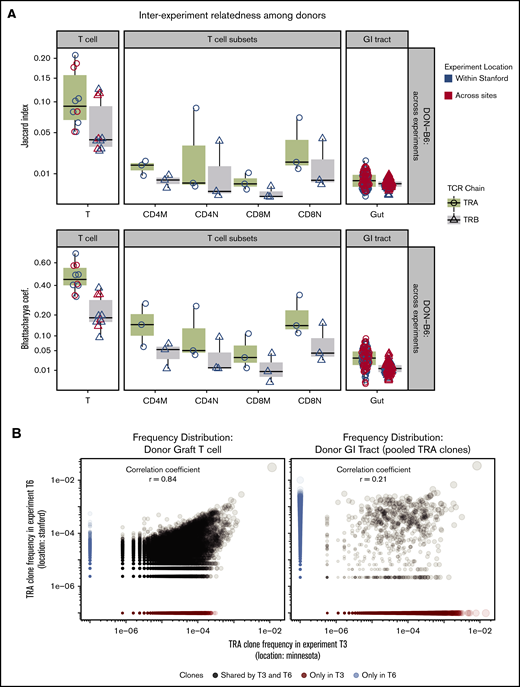
TCR repertoire relatedness among recipient groups and across experiment locations. Two pairwise indices (JI and BC) were used to measure similarity between any 2 samples. One dot in the figure represents JI or BC between 2 samples. Boxplot and violin plots show the index values according to transplant groups and/or time points. Data shown in this figure are from TRA and TRB repertoire. (A) JI and BC of TCR repertoire between donor graft T cells and GI tract. In every transplant experiment, recipient mice shared 1 donor graft T-cell pool purified from several C57BL/6 mice (N = 5-10). A total of 5 donor TCR repertoire from graft T cells were used for relatedness calculation. We isolated the CD4 and CD8 memory and naive cells from the T-cell pool in 3 transplant experiments. GI tracts from every donor mouse were processed individually and used for TCR and relatedness analysis. The x-axis labels are given as follows: T means donor T-cell pool; CD4M represents CD4 memory T cells; CD4N is CD4 naive T cells; CD8M is CD8 memory; CD8N is CD8 naive; Gut means no separation of large and small intestines. (B) Donor TRA clone frequency distribution of 2 representative experiments across sites. Left: TRA from donor graft T cells; Right: TRA clones from GI tracts of representative donor mice. Pearson correlation of TCR from donor T cells is 0.86 (highly related); GI tract has only 0.21. Note: TRA clones from GI tracts were pooled from donor mice (N = 5) in 2 representative transplant experiments. (C) Relatedness of recipient mice between locations. JC and BC of TCR repertoire were measured between any pair of intragroup mice within 1 experiment, or across experiments (local or cross sites).
TCR repertoire relatedness among recipient groups and across experiment locations. Two pairwise indices (JI and BC) were used to measure similarity between any 2 samples. One dot in the figure represents JI or BC between 2 samples. Boxplot and violin plots show the index values according to transplant groups and/or time points. Data shown in this figure are from TRA and TRB repertoire. (A) JI and BC of TCR repertoire between donor graft T cells and GI tract. In every transplant experiment, recipient mice shared 1 donor graft T-cell pool purified from several C57BL/6 mice (N = 5-10). A total of 5 donor TCR repertoire from graft T cells were used for relatedness calculation. We isolated the CD4 and CD8 memory and naive cells from the T-cell pool in 3 transplant experiments. GI tracts from every donor mouse were processed individually and used for TCR and relatedness analysis. The x-axis labels are given as follows: T means donor T-cell pool; CD4M represents CD4 memory T cells; CD4N is CD4 naive T cells; CD8M is CD8 memory; CD8N is CD8 naive; Gut means no separation of large and small intestines. (B) Donor TRA clone frequency distribution of 2 representative experiments across sites. Left: TRA from donor graft T cells; Right: TRA clones from GI tracts of representative donor mice. Pearson correlation of TCR from donor T cells is 0.86 (highly related); GI tract has only 0.21. Note: TRA clones from GI tracts were pooled from donor mice (N = 5) in 2 representative transplant experiments. (C) Relatedness of recipient mice between locations. JC and BC of TCR repertoire were measured between any pair of intragroup mice within 1 experiment, or across experiments (local or cross sites).
In contrast to the total T-cell population, sorted donor graft populations exhibited decreased relatedness across experiments compared with total T cells (ANOVA and post hoc analysis with Tukey’s test, P < .01) (Figure 5A). This finding may be due to lower total and unique sequences obtained after sorting and TCR sequencing compared with the total T-cell pool affecting relatedness by relatively incomplete sampling. To test this possibility, we subsampled donor graft T cells and showed how measures of relatedness could be affected by reduced sampling size (supplemental Figure 3). We also used a comparison of TCR clonal relatedness by using the Pearson correlation coefficient and again found that the TCR repertoire in the donor graft across experiments correlates more closely compared with the TCR repertoire in the donor GI tract across experiments (Figure 4).
In contrast to the overall TCR repertoire of the donor graft, the GI tract of donor C57BL/6 mice had a significantly low relatedness across individual experiments (ANOVA and post hoc analysis with Tukey’s test, P < .01) even when compared with subsampled donor grafts. The relatedness of TCR sequences in the recipient gut across experiments was also significantly lower (Figure 4C), showing a very low reproducibility and high within-experiment specificity of TCR reconstitution in the gut after transplantation.
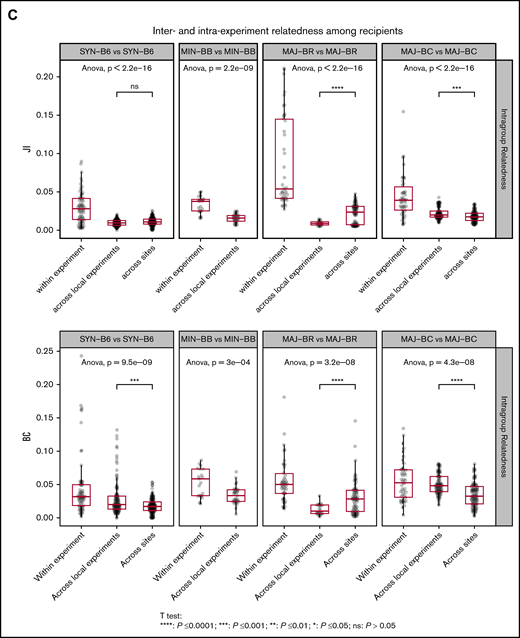
We next evaluated the relatedness of the TCR Vα repertoire in the GI tract of recipient mouse groups and found that the repertoire relatedness of mice within each group was greater than across groups, as measured by the JI (Figure 5C; supplemental Figure 4) and BCs. A comparison of the major mismatch recipient repertoire relatedness between mice in different experiments at the same site or different geographic sites revealed 2 distinct patterns: BR recipients appeared to have more relatedness across geographic sites, whereas BALB/c had more relatedness within experiments conducted at the same center. Although BR mice have different MHC alleles compared with C57BL/6, the strain has a much higher shared non-HLA genetic background as C57BL/6 than BALB/c. In addition, the TCR repertoire in the gut of syngeneic recipients after transplantation was more similar to the donor CD57BL/6 gut than to the donor graft, whereas the TCR repertoire of the major mismatch recipients was more similar to that of the donor graft than syngeneic recipients (supplemental Figures 5 and 6). The relatedness between small and large intestines within the same mice seemed to increase with MHC mismatch (supplemental Figure 7).
Repertoire relatedness according to recipient group
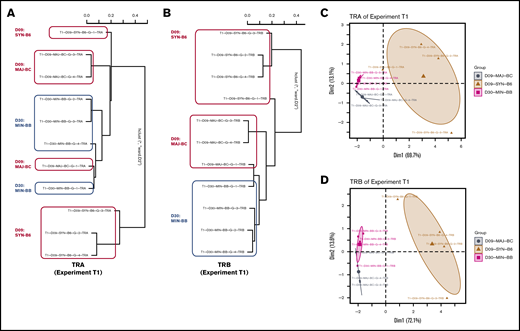
To further assess any possible reproducible repertoire structure, we evaluated the similarity of the TCR repertoire between individual mice by using the Hellinger distance, which allowed for unbiased clustering algorithms to be used. Despite overall low similarity of any 2 recipient individuals by the Hellinger distance in general, we were able to use unbiased clustering to show that individual mice from the same recipient groups tended to cluster together, and we were able to recapitulate the experimental groups by repertoire relatedness evaluating TCR Vα (upper panel) and TCR Vβ (lower panel) across experiments with the 2 shown (Figure 6). Interestingly, repertoire of the syngeneic gut appeared to more closely cluster with the donor T-cell pool. In addition, an evaluation of the TCR Vα repertoire seemed to delineate recipient groups with regard to the evaluation of a smaller number of recipient groups as opposed to the evaluation of TCR Vβ. An analysis of all mice from all experiments did not show the same structure observed for analysis of mice within each experiment (supplemental Figure 8).
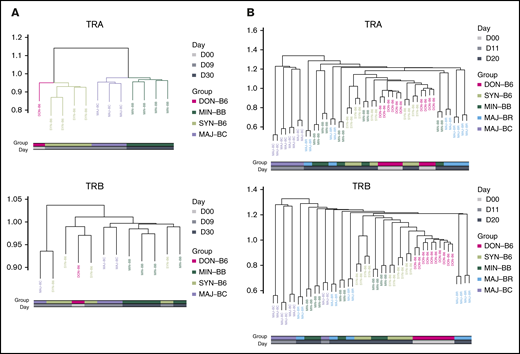
Cluster analysis using the Hellinger distance generally recapitulates transplant recipient grouping. (A) Comparison of 3 recipient transplant and donor T-cell graft groups. The GI tract repertoire were compared between and across recipient groups restricted to syngeneic (C57BL/6), minor mismatch (BALB.B), and major mismatch (BALB/c) to obtain Hellinger distances that were then used to create a cluster (method) using the donor graft repertoire as an outgroup for TCRA (upper panel) and TCRB (lower panel). Results are from 1 representative experiment. (B) Comparison of 4 recipient and the donor GI tract groups. The Hellinger distance was obtained compared across each individual mouse in each individual group and used to generate an unbiased cluster. In both analyses, the syngeneic GI repertoire more closely associates with donor TCR.
Cluster analysis using the Hellinger distance generally recapitulates transplant recipient grouping. (A) Comparison of 3 recipient transplant and donor T-cell graft groups. The GI tract repertoire were compared between and across recipient groups restricted to syngeneic (C57BL/6), minor mismatch (BALB.B), and major mismatch (BALB/c) to obtain Hellinger distances that were then used to create a cluster (method) using the donor graft repertoire as an outgroup for TCRA (upper panel) and TCRB (lower panel). Results are from 1 representative experiment. (B) Comparison of 4 recipient and the donor GI tract groups. The Hellinger distance was obtained compared across each individual mouse in each individual group and used to generate an unbiased cluster. In both analyses, the syngeneic GI repertoire more closely associates with donor TCR.
Assessment of the contribution of clones with the most common TCR motifs vs less frequent clones to repertoire relatedness
We next wanted to better understand what type of TCR clones might be contributing to repertoire similarity within recipient groups. Specifically, we questioned if a relatively few common clonal motifs were responsible compared with multiple less frequent clones. We partitioned the TCR Vα CDR3 clones with the top 10 motifs in a given recipient group as 1 dataset and all other clones not having these motifs as another dataset. For the TCR Vα repertoire of the donor grafts, evaluation of the dataset with the most abundant motifs increased the relatedness, whereas evaluation of the dataset stripped of the most abundant motifs decreased the relatedness. For donor mice and syngeneic recipient groups, removal of the most common motifs decreased the relatedness, highlighting these clones as the most important for relatedness (Figure 7). In contrast, the relatedness between the allogeneic post-HCT recipient groups did not decrease as much when evaluating vs the less common clones, suggesting that clustering depends on a highly polyclonal structure.
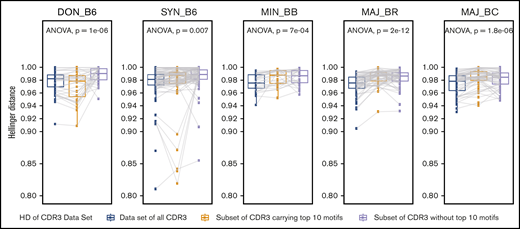
Evaluation of the contribution of the most common CDR3 motifs vs less common motifs to the TCR repertoire relatedness and structural similarity of intergroup reconstitution. Each panel represents the result for an individual recipient group for 1 representative experiment. The mean Hellinger distance for comparisons of individual mice within each recipient group is shown for the complete TCR repertoire (blue). Decreasing values indicate that the repertoire is more similar. The mean Hellinger distance was recalculated by using a subset of the TCR repertoire for each individual mouse in which only clones with the top 10 CDR3 clonal motifs identified in each group were preserved, and the mean Hellinger distance is shown (yellow). Finally, the mean Hellinger distance was recalculated by using a subset of the TCR repertoire for each individual mouse in which clones with the top 10 CDR3 clonal motifs were removed (gray). Using this analysis, the donor C57BL/6 GI repertoire showed an increase in the Hellinger distance when analysis was restricted to the top 10 motifs vs without these motifs, in which the Hellinger distance is decreased. The same trend is present for the C57BL/6 syngeneic recipient group but not for the allogeneic recipient groups. This suggests that the structure of reproducible TCR repertoire reconstitution is less sensitive to intragroup shared common CDR3 clonal motifs in allogeneic recipients and more dependent on rarer clones and a more polyclonal response. n ≥ 10 per group; ANOVA statistical analysis; P value as shown.
Evaluation of the contribution of the most common CDR3 motifs vs less common motifs to the TCR repertoire relatedness and structural similarity of intergroup reconstitution. Each panel represents the result for an individual recipient group for 1 representative experiment. The mean Hellinger distance for comparisons of individual mice within each recipient group is shown for the complete TCR repertoire (blue). Decreasing values indicate that the repertoire is more similar. The mean Hellinger distance was recalculated by using a subset of the TCR repertoire for each individual mouse in which only clones with the top 10 CDR3 clonal motifs identified in each group were preserved, and the mean Hellinger distance is shown (yellow). Finally, the mean Hellinger distance was recalculated by using a subset of the TCR repertoire for each individual mouse in which clones with the top 10 CDR3 clonal motifs were removed (gray). Using this analysis, the donor C57BL/6 GI repertoire showed an increase in the Hellinger distance when analysis was restricted to the top 10 motifs vs without these motifs, in which the Hellinger distance is decreased. The same trend is present for the C57BL/6 syngeneic recipient group but not for the allogeneic recipient groups. This suggests that the structure of reproducible TCR repertoire reconstitution is less sensitive to intragroup shared common CDR3 clonal motifs in allogeneic recipients and more dependent on rarer clones and a more polyclonal response. n ≥ 10 per group; ANOVA statistical analysis; P value as shown.
Discussion
T-cell immune reconstitution after HCT plays a major role in the clinical success or failure of HCT. T cells can contribute to immune defense against infections, drive graft-versus-leukemia effects, or contribute to GVHD. Advances in TCR-Seq now allow investigators the possibility of quantifying and tracking individual T-cell clones and a new level of resolution for understanding immune reconstitution. It is possible that over time, such approaches could be used to help quantify healthy and productive immune reconstitution from deranged or unhealthy reconstitution that contributes to GVHD.
We used murine models of HCT to better understand how TCR immune reconstitution occurs, with a specific focus on understanding the reproducibility of immune reconstitution in the gut. We evaluated the TCR repertoire reconstitution in the gut of recipient mice who received pooled donor T cells derived from the same C57BL/6 strain across experiments and 2 different geographic locations. The donor TCR Vα repertoire of C57BL/6 donors in different experimental groups and across geography was highly related, even more similar than repeat blood samples from a human.10
A major finding of the study is that donor TCR repertoire reconstitution in the GI tract differs reproducibly depending on the recipient MHC. Within each experiment, we found identifiable pools of clones at all relative frequencies specifically enriched within recipient groups depending on the degree and type of MHC mismatch to the donor, but these clones were unique to each experiment and not found between experiments. This outcome points to a high degree of stochasticity and/or sensitivity to local and temporal factors in repertoire reconstitution following HCT, in terms of which clones reconstitute from an otherwise very stable and similar donor T-cell pool.
Syngeneic recipients after HCT was consistently more related to the original donor gut repertoire than other groups. Syngeneic recipients also exhibited a higher level of iNKT cells in the gut. iNKT cells are known to help regulate immune reconstitution after HCT but have not been known to change with genetic relatedness of the recipient to donor.27 Finally, syngeneic recipients exhibited consistent repertoire relatedness; in other words, specific unique T cells that reconstituted in the group. In the case of syngeneic recipients, T-cell repertoire reconstitution in the gut tract seems to be more dependent on a set of relatively reproducible high-frequency and expanded T-cell clones (Figure 7).
In contrast, the pattern was different for the repertoire reconstitution that occurred in genetically mismatched recipients. In this case, T-cell repertoire reconstitution seems to depend more on a set of unique, less frequent clones. This suggests that for genetically mismatched recipients, similarities in repertoire reconstitution in the GI tract seem to be more defined by a highly polyclonal response that is less sensitive to the identity of the most expanded T-cell clones (Figure 7). The implications are for human studies, in which often the most abundant TCR clones are sampled.10
In our study, we were unable to see more repertoire relatedness in different recipient mice with the evaluation of TCR Vβ repertoire than we did with the Vα repertoire by statistical comparison of these measures with and between groups. This is possibly due to a much greater diversity in TCR Vβ and insufficient sampling to capture shared polyclonal structure given stochastic and site-specific reconstitution. However, despite this, we still found that recipient groups could be distinguished by TCR Vβ clone size and distribution (Figure 4) and by cluster analysis using the Hellinger distance (Figure 6). This has implications for human and many preclinical studies only evaluating TCR Vβ repertoire.
The current study suggests that even in the best experimentally controlled conditions, T-cell repertoire reconstitution following GVHD is highly stochastic and that any predictable structure to reconstitution depends on a complex polyclonal architecture likely highly sensitive to specific factors such as diet or microbiome.
The data have been deposited with links to BioProject accession number PRJNA650133 in the NCBI BioProject database (https://www.ncbi.nlm.nih.gov/bioproject/).
Acknowledgments
This work was supported by the National Institutes of Health, National Heart, Lung, and Blood Institute (K08HL119590 and 2R01 HL56067), National Cancer Institute (PO1 CA049605), and National Institute of Allergy and Infectious Diseases (R37 AI 34495); and an Amy Manasevit Award from the National Marrow Donor Program and the American Society of Blood and Marrow Transplantation.
Authorship
Contribution: P.Z. designed and performed research, analyzed data, and wrote the manuscript; J.T., B.P.I., L.X., X.Y., G.T., B.R.B., R.S.N., and J.L.Z. performed research; E.H.M. is the senior author of this study who cowrote the manuscript and provided overall guidance; and all authors edited the manuscript for content.
Conflict-of-interest disclosure: B.R.B. receives remuneration as an advisor to Kamon Pharmaceuticals, Inc., Five Prime Therapeutics Inc., Regeneron Pharmaceuticals, Magenta Therapeutics, and BlueRock Therapeutics; research support from Fate Therapeutics, RXi Pharmaceuticals, Alpine Immune Sciences, Inc, AbbVie Inc., the Leukemia and Lymphoma Society, Children’s Cancer Research Fund, and KidsFirst Fund; and is a cofounder of Tmunity. E.H.M. is a cofounder of GigaGen Inc. and Triursus Therapeutics Inc.; and has research support from Orca Biosystems. The remaining authors declare no competing financial interests.
Correspondence: Everett H. Meyer, Blood and Marrow Transplantation, Stanford University School of Medicine, 269 West Campus Dr, CCSR Building, Room 2245C, Stanford, CA 94305-5623; e-mail: evmeyer@stanford.edu.

