

Key Points
AMG 701 induced T-cell–dependent cellular cytotoxicity of BCMA-expressing target cells, which was augmented by PD-1 blockade.
In vivo, AMG 701 prolonged survival of tumor-bearing mice and depleted PCs in cynomolgus monkeys.

Abstract
Multiple myeloma (MM) is a hematologic malignancy that is characterized by the accumulation of abnormal plasma cells (PCs) in the bone marrow (BM). Patient outcome may be improved with BiTE (bispecific T-cell engager) molecules, which redirect T cells to lyse tumor cells. B-cell maturation antigen (BCMA) supports PC survival and is highly expressed on MM cells. A half-life extended anti-BCMA BiTE molecule (AMG 701) induced selective cytotoxicity against BCMA-expressing MM cells (average half-maximal effective concentration, 18.8 ± 14.8 pM), T-cell activation, and cytokine release in vitro. In a subcutaneous mouse xenograft model, at all doses tested, AMG 701 completely inhibited tumor formation (P < .001), as well as inhibited growth of established tumors (P ≤ .001) and extended survival in an orthotopic MM model (P ≤ .01). To evaluate AMG 701 bioactivity in cynomolgus monkeys, a PC surface phenotype and specific genes were defined to enable a quantitative digital droplet polymerase chain reaction assay (sensitivity, 0.1%). Dose-dependent pharmacokinetic and pharmacodynamic behavior was observed, with depletion of PC-specific genes reaching 93% in blood and 85% in BM. Combination with a programmed cell death protein 1 (PD-1)–blocking antibody significantly increased AMG 701 potency in vitro. A model of AMG 701 binding to BCMA and CD3 indicates that the distance between the T-cell and target cell membranes (ie, the immunological synapse) is similar to that of the major histocompatibility complex class I molecule binding to a T-cell receptor and suggests that the synapse would not be disrupted by the half-life extending Fc domain. These data support the clinical development of AMG 701.
Introduction
Multiple myeloma (MM), a clonal proliferation of malignant plasma cells (PCs) in the bone marrow (BM),1 accounts for ∼17% of the hematologic malignancies in the United States.2,3 Despite recent advances in the treatment of MM, there are no curative therapies, and relapse is expected.1 Approximately half of patients survive for 5 years after diagnosis,3 highlighting the urgent need for novel therapeutic treatments for MM.
Immunotherapy is a promising approach for MM treatment. One strategy is to redirect a patient’s own T cells to eliminate cancer cells using BiTE (bispecific T-cell engager) molecules, which bind the T-cell receptor (TCR)-associated CD3ε protein and a tumor-associated antigen. BiTE molecules mediate the interaction of T cells with cancer cells, leading to the formation of an immunological synapse, T-cell activation, cytokine secretion, and target cell apoptosis.4 The CD19-targeting BiTE molecule blinatumomab is the first bispecific T-cell–engaging therapy to be approved by the US Food and Drug Administration (FDA) for treatment of minimal residual disease–positive and relapsed or refractory B-cell precursor acute lymphoblastic leukemia.5,6
B-cell maturation antigen (BCMA), a transmembrane protein belonging to the tumor necrosis factor receptor super family, plays a central role in regulating B-cell maturation and differentiation into PCs.7 BCMA is an attractive target for MM immunotherapy because of its high expression on malignant PCs in MM patients and normal expression restricted to PCs in healthy individuals.8,9 BCMA-targeting therapeutics in clinical development include BCMA-targeting antibody-drug conjugates,9-13 BCMA-specific chimeric antigen receptor T-cell therapies,14-19 and BCMA-targeting bispecific antibodies.20,21 Many of these therapeutics have demonstrated promising antimyeloma activity in nonclinical and early-phase clinical studies. The advantages of the BiTE molecule modality include potent mechanism of action and off-the-shelf utility, warranting evaluation in MM.
AMG 420 is a BiTE molecule directed against BCMA that induces selective T-cell–dependent cellular cytotoxicity (TDCC) against BCMA-expressing cells in vitro and in vivo.20 In a phase 1 first-in-human (FIH) study in relapsed and/or refractory MM patients (NCT02514239), AMG 420 demonstrated a 70% objective response rate at the dose of 400 µg/d, providing the first clinical proof of concept for BiTE molecule therapy in MM.22 AMG 420 has a short in vivo half-life, necessitating continuous IV infusion to maintain drug exposure in patients.22 The aim of this study was to generate and evaluate preclinically a half-life extended (HLE) anti-BCMA BiTE molecule (AMG 701) as a therapy for MM. AMG 701 is being examined in a phase 1 FIH dose-finding study in relapsed/refractory MM patients (NCT03287908).
Methods
Animal welfare
All in vivo work was conducted under protocols that were approved by the Institutional Animal Care and Use Committee in Association for Assessment and Accreditation of Laboratory Animal Care–accredited facilities. Animal experimental procedures were conducted in accordance with the German Animal Welfare Law, with permission from the responsible local authorities, and within the guidelines of the Association for Assessment and Accreditation of Laboratory Animal Care international standards. Cynomolgus monkeys were cared for in accordance with the Guide for the Care and Use of Laboratory Animals, eighth edition.
Cell lines
Cell lines analyzed were sourced from commercial vendors and cultured according to the vendors’ specifications.
Quantitation of BCMA surface protein expression on target cell lines
BCMA surface molecule quantitation on cancer cell lines was determined using QIFIKIT (Dako; cat. no. K0078) with anti-BCMA antibody 9C2H4 (Boehringer Ingelheim) or an internal clone (Amgen Research [Munich] GmbH).
TDCC assay and T-cell activation
Flow-based TDCC.
BCMA+ or BCMA− target cells were labeled with Vybrant DiO or DiI fluorescent dyes (Invitrogen; cat no. V22885 and V22886). Human peripheral blood mononuclear cells (PBMCs; Institute for Clinical Transfusion Medicine and Immunogenetics, University of Ulm, Ulm, Germany) and cynomolgus monkey effector cells (PBMCs and T cells isolated therefrom; R.C. Hartelust, BV, Tilburg, The Netherlands) were cocultured with target cells at a 10:1 ratio and increasing concentrations of AMG 701 for 48 hours. Target cell lysis was monitored by flow cytometric determination of propidium iodide uptake by target cells and the upregulation of CD25 and CD69 on CD4+ and CD8+ T cells by flow cytometry (BD FACSCanto II and fluorescently labeled antibodies; BD Biosciences). For TDCC assays utilizing KMS12BM_PDL1 and U266B1_PDL1 GFP+ target cells, remaining viable target cells (GFP+ ToPro3−) were enumerated by flow cytometry.
Programmed cell death protein 1 (PD-1) expression was measured on T cells (Figure 6A) by flow cytometry (BD FACSymphony Flow Cytometer; BD Biosciences) utilizing an antibody cocktail (supplemental Table 5). For TDCC assays utilizing PD-1+ T cells, human pan T cells were preincubated 1:1 with CD3/CD28 Dynabeads (Thermo Fisher) for 48 hours.
Cytokine release
Cytokine levels in the supernatants of flow-based TDCC assays were analyzed by human and nonhuman primate Th1/Th2 cytometric bead arrays (BD Biosciences), according to the manufacturer’s instructions. Cytokine levels (Figure 6E) were measured from supernatants collected at 72 hours of the TDCC assay (Figure 6D), using an enzyme-linked immunosorbent assay (Meso Scale Discovery).
Mouse xenograft models
Flank model.
NCI-H929 MM cells mixed with human PBMCs (effector-to-target [E:T]: 1:2) were injected subcutaneously into the right flank of sublethally irradiated female nonobese diabetic (NOD)/severe combined immunodeficiency (SCID) mice. Before tumors were measurable, mice were treated with vehicle or AMG 701 (2, 0.2, and 0.02 mg/kg) by IV bolus injection into the lateral tail vein on days 3, 8, and 13. Tumor growth was measured 2 or 3 times per week using calipers. Statistical significance was calculated using 1-way analysis of variance (ANOVA) with the Dunnett post hoc test.
Aggressive model.
Sublethally irradiated NOD/SCID mice were injected IV with 1 × 10⁷ L-363 MM tumor cells on day 1. On day 4, all mice (with the exception of vehicle-only control group) received a single IV dose of anti–asialo GM1 antibody (Cedarlane/BIOZOL, cat. no. CL8955; Lot TGP5888) into the lateral tail vein to deplete the remaining natural killer cells. A total of 2 × 10⁷ in vitro expanded human CD3+ T cells (human T Cell Isolation Kit and T Cell Activation/Expansion Kit, human; Miltenyi Biotec) were injected into the peritoneal cavity of all mice, with the exception of the vehicle-only control group, on day 5. Mice were treated with AMG 701 (0.5, 0.05, and 0.005 mg/kg) or vehicle on day 9, and then every 5 days for 6 administrations, and were monitored daily. Statistical significance of the survival benefit was calculated using a log-rank (Mantel-Cox) test.
Established model.
On day 1, 5 × 10⁶ NCI-H929 MM cells were injected subcutaneously into the right flank of sublethally irradiated female SCID mice. On day 8, 1.2 × 10⁷ human T cells were injected intraperitoneally into all animals. Mice were treated with vehicle or AMG 701 (0.25, 0.05, or 0.01 mg/kg) on day 15 and day 22 and were monitored daily. Statistical significance was calculated using 1-way ANOVA with the Dunnett post hoc test.
Pharmacokinetics in cynomolgus monkeys
AMG 701 was quantified by a ligand-binding assay based on electrochemiluminescent technology (Meso Scale Discovery). All samples were analyzed by a generic approach: an antibody directed against the CD3-binding portion of the BiTE antibody construct was used as coating reagent, and a noncompeting anti-CD3–binding ruthenium-labeled antibody was used for detection. Pharmacokinetics (PK) parameters were fitted with Phoenix WinNonlin software using noncompartmental analysis.
Immunophenotyping
Cynomolgus macaque (Chinese) whole blood (Valley Biosystems, Alameda, CA), collected into Na/heparin within 4 hours of blood draw, was stained by adding 2.5 µL of mouse serum to each well of a U-bottom 96-well plate, followed by the addition of 100 µL of blood and then fluorochrome-labeled antibody cocktail (supplemental Table 4). Blood was then lysed with BD Pharm Lyse. From each sample, 250 000 cells were collected and analyzed on a BD LSR II Flow Cytometer. Geometric median fluorescence intensity was determined from each sample for each population using FlowJo software.
Bone marrow mononuclear cells (BMMCs) were isolated from fresh cynomolgus monkey BM aspirate (Alpha Genesis) by separation over Lympholyte-Mammal Cell Separation Media (CEDARLANE). Cells were stained with fluorochrome-labeled antibody cocktail (supplemental Table 5). For intracellular staining, after cell surface staining, cells were permeabilized with BD Cytofix/Cytoperm (BD Biosciences), washed with BD Perm/Wash buffer (BD Biosciences), and stained with anti-p63 (FITC Mouse Anti-Human p63; clone VS38), and anti–immunoglobulin M (IgM) [AffiniPure PE Goat Anti-Human IgM F(ab′)2 Fc5μ fragment specific; Jackson ImmunoResearch Laboratories]. For staining of human PCs, human BM (AllCells) was stained with a fluorochrome-labeled antibody cocktail (supplemental Table 5). For analysis, doublets were gated out, and dead cells were excluded by 7-aminoactinomycin D. Cells were analyzed using a BD LSR II Flow Cytometer and FlowJo software.
Pharmacodynamics/ddPCR assays for cynomolgus monkey studies
Complementary DNA was generated from RNA isolated from blood and BM. Reaction mixes for droplet digital polymerase chain reaction (ddPCR) were prepared using Bio-Rad’s ddPCR Supermix for Probes kit (cat. no. 1863010) and custom-designed Integrated DNA Technologies’ PrimeTime qPCR Probe Assays (sequences in supplemental Methods). Reaction droplets were generated, and the recommended thermal cycling conditions were carried out on a Bio-Rad C1000 Touch thermal cycler. The 40-µL reactions were measured on the QX100 or QX200 droplet reader. Instrument readouts were generated as the number of copies per microliter and then converted to copies per nanogram, based on the complementary DNA input.
Results
AMG 701 induced potent and specific TDCC against MM cell lines in vitro
A panel of BCMA protein-positive or -negative target cell lines (Figure 1A; supplemental Table 1) was used to evaluate AMG 701 TDCC activity in vitro. AMG 701 induced potent TDCC in cocultures of human PBMCs with 4 BCMA protein-positive MM cell lines, with half-maximal effective concentration (EC50) values ranging from 0.8 ± 1.0 pM to 42.0 ± 25.3 pM (mean ± SD, n = 4-6 PBMC donors per cell line; average EC50, 18.8 ± 14.8 pM; Figure 1B; supplemental Table 1), but not with BCMA protein-negative HCT-116 cells, demonstrating the selectivity of AMG 701. In the presence of BCMA cell surface–positive cells, but not BCMA cell surface–negative cells, AMG 701 induced dose-dependent T-cell activation (Figure 1C-D) and dose- and time-dependent cytokine secretion (Figure 1E).
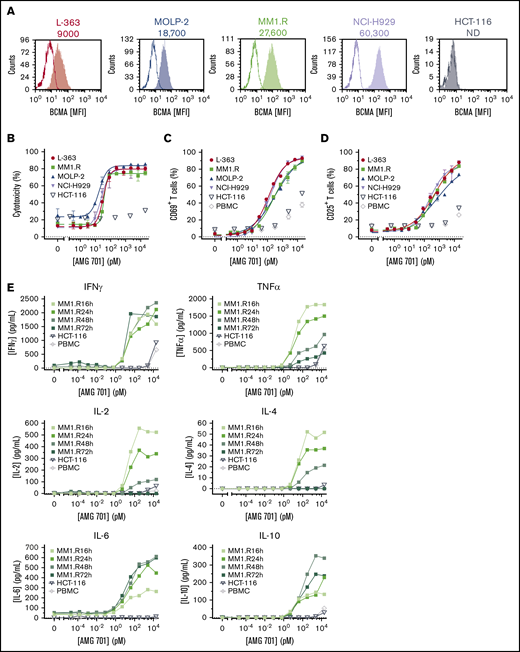
AMG 701 induced TDCC against MM cell lines in vitro. (A) Flow cytometry histograms depicting BCMA cell surface protein expression on cancer cell lines. Open graphs represent isotype staining; filled graphs represent BCMA protein staining. Numbers represent the number of BCMA molecules per cell. (B) Specific cytotoxicity of TDCC assays with BCMA protein-positive cell lines (L-363, MM1.R, MOLP-2, NCI-H929) or the BCMA protein-negative cell line (HCT-116) cocultured with human PBMCs at a 5:1 E:T ratio and increasing concentrations of AMG 701 for 48 hours. Data are mean ± standard deviation (SD) for 2 technical replicates. Curves are representative of 4 PBMC donors. Expression of CD69 (C) and CD25 (D) on T cells from TDCC assays of BCMA+ or BCMA− cell lines or no target cells (PBMC), as described in panel B. Data are mean ± SD of 2 technical replicates representative of 4 PBMC donors. (E) Concentration of cytokines in supernatants of TDCC assays at the times indicated. Data represent 1 technical replicate from 1 PBMC donor. IFNγ, interferon-γ; IL-2, interleukin-2; MFI, mean fluorescence intensity; ND, not detectable; TNFα, tumor necrosis factor-α.
AMG 701 induced TDCC against MM cell lines in vitro. (A) Flow cytometry histograms depicting BCMA cell surface protein expression on cancer cell lines. Open graphs represent isotype staining; filled graphs represent BCMA protein staining. Numbers represent the number of BCMA molecules per cell. (B) Specific cytotoxicity of TDCC assays with BCMA protein-positive cell lines (L-363, MM1.R, MOLP-2, NCI-H929) or the BCMA protein-negative cell line (HCT-116) cocultured with human PBMCs at a 5:1 E:T ratio and increasing concentrations of AMG 701 for 48 hours. Data are mean ± standard deviation (SD) for 2 technical replicates. Curves are representative of 4 PBMC donors. Expression of CD69 (C) and CD25 (D) on T cells from TDCC assays of BCMA+ or BCMA− cell lines or no target cells (PBMC), as described in panel B. Data are mean ± SD of 2 technical replicates representative of 4 PBMC donors. (E) Concentration of cytokines in supernatants of TDCC assays at the times indicated. Data represent 1 technical replicate from 1 PBMC donor. IFNγ, interferon-γ; IL-2, interleukin-2; MFI, mean fluorescence intensity; ND, not detectable; TNFα, tumor necrosis factor-α.
AMG 701 has comparable intraspecies binding affinity for BCMA and CD3 in human and cynomolgus monkey (supplemental Table 2). Using cynomolgus monkey effector cells, AMG 701 induced potent and specific TDCC of BCMA cell surface–expressing cells (supplemental Figure 1A), T-cell activation (supplemental Figure 1B-C), and cytokine secretion (supplemental Figure 1D-E).
AMG 701 demonstrated antitumor activity in mouse xenograft models
AMG 701 was evaluated in vivo in an MM mouse xenograft flank model. NCI-H929 BCMA protein-positive MM cells mixed with human PBMCs at an E:T ratio of 1:2 were injected subcutaneously into sublethally irradiated NOD/SCID mice. Treatment with AMG 701 began on day 3, when tumors were not measurable. Tumor volume measurement began on day 6 (40-65 mm3 across all groups). Complete inhibition of tumor formation was observed at all 3 doses tested (0.02, 0.2, and 2 mg/kg; P < .001; Figure 2A). Serum exposures were dose dependent (Figure 2B), with resulting elimination half-lives (t1/2) of 170, 153, and 90 hours, respectively. AMG 701 was well tolerated, as evidenced by no body weight loss.
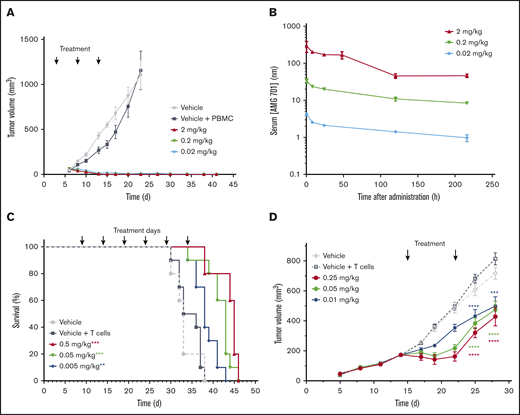
AMG 701 demonstrated antitumor activity in mouse xenograft models. (A) Tumor volumes of NOD/SCID mice injected subcutaneously with a mixture of NCI-H929 tumor cells and human PBMCs (1:2 E:T ratio) and treated with vehicle or AMG 701 (2, 0.2, and 0.02 mg/kg) on days 3, 8, and 13. Data are mean ± standard error of the mean (SEM) (n = 5, vehicle group; n = 10, all other groups). P < .001 for all dose levels from day 10 until day 23 vs vehicle + PBMC group, 1-way ANOVA with the Dunnett post hoc test. (B) PK profile of AMG 701 in mouse serum at the times indicated after the last administration on day 13. Data are mean ± SEM (n = 3). (C) Kaplan-Meier survival analysis of NOD/SCID mice orthotopically transplanted with L-363 MM cells, injected intraperitoneally with human T cells on day 5 (except for vehicle-only control), and treated with AMG 701 (0.5, 0.05, and 0.005 mg/kg) or vehicle every 5 days for 6 administrations, starting on day 9. Arrows indicate days of treatment (n = 5, vehicle group; n = 10, all other groups). **P = .007, ***P < .001 vs vehicle + T-cell group, Kaplan-Meier estimator with Mantel-Cox log-rank test. (D) Tumor volumes of SCID mice injected subcutaneously with NCI-H929 tumor cells (5E6) on day 1, intraperitoneally injected with human T cells (1.2E7) on day 8, and treated with vehicle or AMG 701 (0.25, 0.05, or 0.01 mg/kg) on days 15 and 22. Data are mean ± SEM (n = 5, vehicle group; n = 8, all other groups). ****P < .0001, ***P = .0002, 1-way ANOVA with the Dunnett post hoc test.
AMG 701 demonstrated antitumor activity in mouse xenograft models. (A) Tumor volumes of NOD/SCID mice injected subcutaneously with a mixture of NCI-H929 tumor cells and human PBMCs (1:2 E:T ratio) and treated with vehicle or AMG 701 (2, 0.2, and 0.02 mg/kg) on days 3, 8, and 13. Data are mean ± standard error of the mean (SEM) (n = 5, vehicle group; n = 10, all other groups). P < .001 for all dose levels from day 10 until day 23 vs vehicle + PBMC group, 1-way ANOVA with the Dunnett post hoc test. (B) PK profile of AMG 701 in mouse serum at the times indicated after the last administration on day 13. Data are mean ± SEM (n = 3). (C) Kaplan-Meier survival analysis of NOD/SCID mice orthotopically transplanted with L-363 MM cells, injected intraperitoneally with human T cells on day 5 (except for vehicle-only control), and treated with AMG 701 (0.5, 0.05, and 0.005 mg/kg) or vehicle every 5 days for 6 administrations, starting on day 9. Arrows indicate days of treatment (n = 5, vehicle group; n = 10, all other groups). **P = .007, ***P < .001 vs vehicle + T-cell group, Kaplan-Meier estimator with Mantel-Cox log-rank test. (D) Tumor volumes of SCID mice injected subcutaneously with NCI-H929 tumor cells (5E6) on day 1, intraperitoneally injected with human T cells (1.2E7) on day 8, and treated with vehicle or AMG 701 (0.25, 0.05, or 0.01 mg/kg) on days 15 and 22. Data are mean ± SEM (n = 5, vehicle group; n = 8, all other groups). ****P < .0001, ***P = .0002, 1-way ANOVA with the Dunnett post hoc test.
An aggressive orthotopic MM mouse model (L-363 MM cells) was used to further evaluate AMG 701 in vivo. Despite the highly aggressive nature of this model, treatment with AMG 701 extended survival significantly at all doses tested compared with controls (Figure 2C; P = .007 [0.005 mg/kg], P < .001 [0.05 and 0.5 mg/kg]; Kaplan-Meier estimator with Mantel-Cox log rank). In the aggressive L-363 model, body weight loss occurred in some mice 2 to 5 days before death because of disease progression, and this observation was deemed irrelevant to treatment, because AMG 701 does not bind murine BCMA.
AMG 701 was further evaluated in an established MM mouse model. NCI-929 MM cells were injected subcutaneously into sublethally irradiated SCID mice, followed by intraperitoneal injection of human T cells 1 week later. On day 15, tumor volume averaged 173.2 ± 22.1 mm3, and treatment with AMG 701 began. After 2 treatments, on day 28, AMG 701 inhibited tumor growth at all 3 doses tested (Figure 2D; P < .0001 [0.25 and 0.05 mg/kg]; P = .0002 [0.01 mg/kg]).
Identification of cynomolgus monkey PC surface phenotype
To further characterize AMG 701, a study of the PK/pharmacodynamics (PD) relationship in cynomolgus monkeys was performed. Based on species similarity to humans, cynomolgus monkey PCs were anticipated to be the target of BiTE molecule–redirected lysis; however, quantitation of AMG 701–mediated depletion of PCs by flow cytometry is challenging because cytometry-based measurement of very rare cells, such as PCs (0.1%-3% of BMMCs or PBMCs),23-25 is unreliable.26,27 To address these limitations, a sensitive and quantitative ddPCR-based assay was developed to measure PC depletion in vivo. At the time of this study, a defined cell surface phenotype of cynomolgus monkey PCs was not available. A pure population of putative cynomolgus monkey BM PCs was isolated using the known PC intracellular proteins IgM and p63. The isolated cells were large lymphocytes with intermediate scatter properties, exhibiting characteristic morphological features of PCs (Figure 3A). Similar to human PCs,28-32 these cells expressed high levels of cell surface CS1 and CD38 and showed heterogeneous expression of CD138 protein, but not CD27, unlike human PCs29,30 (Figure 3A-B; supplemental Figure 2). The IgM+ p63+ cells were subsequently confirmed as PCs by Wright Giemsa staining and morphological analysis of cytospin preparations (Figure 3C). Based on this work, the cell surface phenotype of cynomolgus monkey PCs was determined to be CD3negCD20negCS1hiCD38hiCD138hetCD27neg.
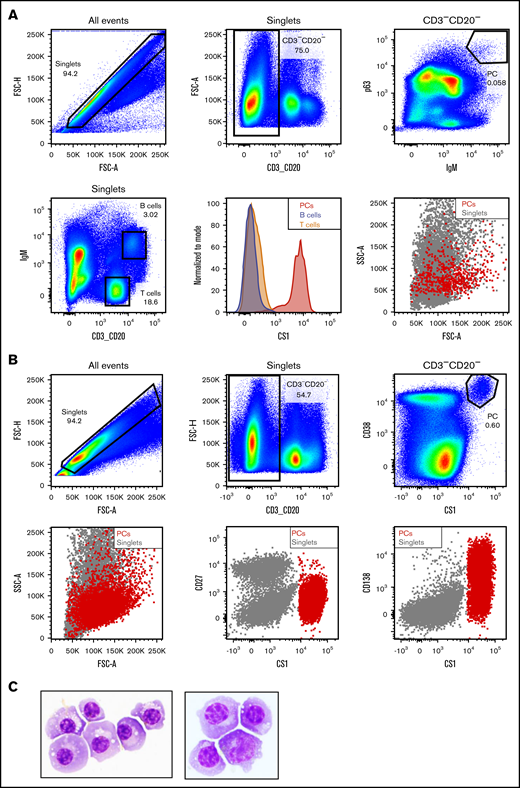
Identification of cynomolgus monkey plasma cell surface phenotype allows cell sorting. (A) Intracellular and cell surface flow cytometry analysis of cynomolgus monkey BM. PCs: CD3−CD20− singlets positive for intracellular p63 and IgM (upper panels). Gating strategy to identify BM T and B lineage cells in cynomolgus monkey BM (lower left panel). Flow cytometry graphs depicting CS1 expression on PCs (red), T cells (orange), and B cells (steel blue) from cynomolgus monkey BM (lower middle panel). Forward and side scatter properties of cynomolgus monkey BM PCs (red) backgated onto the singlets (gray, lower right panel). (B) Cell surface flow cytometry analysis of CS1 and CD38 expression on cynomolgus monkey BM PCs (upper panels). Backgating of PCs (red) onto singlets depicting shape, as well as CD27, CS1, and CD138 expression (lower panels). (C) Wright Giemsa staining of a cytospin preparation of flow-sorted cynomolgus monkey PCs from 2 donors. Images taken at original magnification ×100.
Identification of cynomolgus monkey plasma cell surface phenotype allows cell sorting. (A) Intracellular and cell surface flow cytometry analysis of cynomolgus monkey BM. PCs: CD3−CD20− singlets positive for intracellular p63 and IgM (upper panels). Gating strategy to identify BM T and B lineage cells in cynomolgus monkey BM (lower left panel). Flow cytometry graphs depicting CS1 expression on PCs (red), T cells (orange), and B cells (steel blue) from cynomolgus monkey BM (lower middle panel). Forward and side scatter properties of cynomolgus monkey BM PCs (red) backgated onto the singlets (gray, lower right panel). (B) Cell surface flow cytometry analysis of CS1 and CD38 expression on cynomolgus monkey BM PCs (upper panels). Backgating of PCs (red) onto singlets depicting shape, as well as CD27, CS1, and CD138 expression (lower panels). (C) Wright Giemsa staining of a cytospin preparation of flow-sorted cynomolgus monkey PCs from 2 donors. Images taken at original magnification ×100.
BCMA is expressed on human and cynomolgus monkey PCs but not B cells
Cell surface BCMA protein expression on cynomolgus monkey PCs was subsequently evaluated and compared with that of BM-derived and circulating B cells. Because commercially available antibodies exhibited poor reactivity to cynomolgus monkey BCMA, a monoclonal anti-BCMA antibody (P62682.3) was generated. This antibody was subsequently biotinylated, confirmed active (supplemental Figure 3A-B), and used to evaluate BCMA surface expression on cynomolgus monkey BM-derived PCs and B cells. Similar to human PCs, cell surface BCMA expression was detected on cynomolgus monkey BM-derived PCs but not on BM-derived B cells (Figure 4A-B; supplemental Figure 3C-D). Despite reports of BCMA protein expression on B cells from cynomolgus monkey peripheral blood (PB),26 BCMA protein was not detected on B cells or B-cell subsets from cynomolgus monkey PB (Figure 4C; gating strategy in supplemental Figure 3E). BiTE molecules may detect target antigens with higher sensitivity than flow cytometry antibodies. To confirm functionally the lack of BCMA expression on cynomolgus peripheral B cells, AMG 701–mediated T-cell activation and target cell depletion were evaluated in cynomolgus monkey whole blood. Although a tool CD20 BiTE molecule constructed from a published sequence33 induced T-cell activation and autologous B-cell depletion in cynomolgus monkey whole blood (n = 5), AMG 701 did not induce T-cell activation or B-cell depletion (Figure 4D), functionally corroborating the absence of cell surface BCMA expression. Collectively, these studies confirm the use of cynomolgus monkey as an appropriate preclinical species for the assessment of AMG 701.
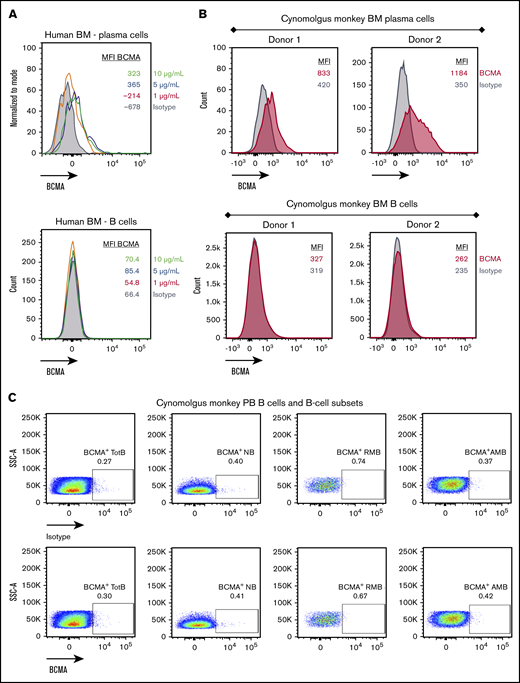
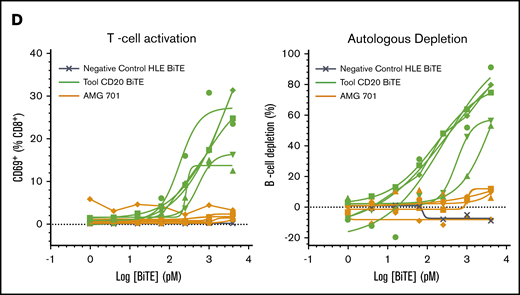
BCMA is expressed on human and cynomolgus monkey BM plasma cells but not on B cells. Flow cytometry histogramsdepicting cell surface BCMA expression levels on plasma cells and CD20+ B lineage cells from human (A) and cynomolgus monkey (B) BM. Concentrations of anti-BCMA antibody tested and corresponding mean fluorescence intensity (MFI) values are indicated. (C) Flow cytometry pseudocolor plots representing BCMA expression on cynomolgus monkey PB total B cells (TotB), naive B cells (NB), resting memory B cells (RMB), and activated memory B cells (AMB), stained with isotype control (upper panels) or BCMA antibody (lower panels). Plots are representative of 2 donors. (D) T-cell activation shown as CD69+ percentage of CD8+ cells (left panel) and autologous depletion of CD40+ B cells shown as percentage of control (right panel) in cynomolgus monkey whole blood incubated with a negative control HLE BiTE molecule, tool CD20 BiTE molecule, or AMG 701 for 48 hours. Each line represents 1 donor.
BCMA is expressed on human and cynomolgus monkey BM plasma cells but not on B cells. Flow cytometry histogramsdepicting cell surface BCMA expression levels on plasma cells and CD20+ B lineage cells from human (A) and cynomolgus monkey (B) BM. Concentrations of anti-BCMA antibody tested and corresponding mean fluorescence intensity (MFI) values are indicated. (C) Flow cytometry pseudocolor plots representing BCMA expression on cynomolgus monkey PB total B cells (TotB), naive B cells (NB), resting memory B cells (RMB), and activated memory B cells (AMB), stained with isotype control (upper panels) or BCMA antibody (lower panels). Plots are representative of 2 donors. (D) T-cell activation shown as CD69+ percentage of CD8+ cells (left panel) and autologous depletion of CD40+ B cells shown as percentage of control (right panel) in cynomolgus monkey whole blood incubated with a negative control HLE BiTE molecule, tool CD20 BiTE molecule, or AMG 701 for 48 hours. Each line represents 1 donor.
Development of a sensitive and quantitative ddPCR-based assay to measure cynomolgus monkey PC-specific gene expression from blood and BM
To measure the in vivo pharmacological activity of AMG 701, we developed a sensitive and quantitative ddPCR-based assay measuring the expression of genes characteristic of PCs. A pure population of cynomolgus monkey PCs was isolated by fluorescence automated cell sorting (97% ± 4% viability, 87% ± 7% purity, n = 4; supplemental Figure 4A) and spiked into PC-depleted BMMC and PBMC samples in increasing numbers, ultimately comprising 0% to 3% of the total cell mixture (supplemental Figure 4B) and representing the physiological range of PC frequency in BM and PB. RNA was isolated from these cell mixtures, and the number of BCMA and J-chain transcripts (genes reported to be restricted to human PCs8,26,34 ) was quantified by ddPCR (supplemental Figure 4B-C). BCMA and J-chain transcripts were not detected in PC-depleted BMMC samples (supplemental Figure 4C) or in PC-depleted PBMC samples (data not shown). BCMA and J-chain messenger RNA (mRNA) detection correlated highly with the number of PCs spiked into PC-depleted BMMC samples (R2 = +0.9994 and +0.9975, respectively; supplemental Figure 4C). Similar results were observed with PBMC samples. Using this methodology, as few as 1 PC in 1000 PC-depleted BMMCs or PBMCs could be detected (sensitivity, 0.1%), with a dynamic range of 30 (linear dynamic range for ddPCR assays, 0.1%-3% PCs).
To understand the normal variability in BCMA and J-chain transcript expression over time, a longitudinal study was conducted. The absolute number of BCMA and J-chain transcripts per nanogram of RNA differed between individuals (supplemental Figure 5); however, for a given individual, BCMA and J-chain transcript expression was largely stable over time and can be quantified as a reliable biomarker of cynomolgus monkey PCs.
AMG 701–depleted blood and BM PCs in cynomolgus monkeys
In a single-dose study (n = 2 cynomolgus monkeys), AMG 701 exhibited a consistent PK profile (supplemental Figure 6A), with a mean elimination half-life (t1/2) ∼ 112 hours (4.7 days) (supplemental Figure 6B). AMG 701 was subsequently assessed in a multiple-dose study with 3 dose groups (n = 3 per group) intended to achieve a maximal serum concentration (Cmax) of 1 nM (group 1), 5 nM (group 2), and 25 nM (group 3) (supplemental Table 3). Exposure of AMG 701 measured as serum concentration over 12 days within each of the 3 groups was reproducible (Figure 5A) and exposure, Cmax, and minimal serum concentration (Cmin) all increased in an approximately dose-proportional manner (supplemental Table 3). The t1/2 ranged from 66 to 107 hours (supplemental Table 3). At Cmin, the exposure of AMG 701 was sixfold, 20-fold, and 77-fold the in vitro EC90 (90% maximal effective concentration, 59 pM) of AMG 701 using cynomolgus monkey effector cells (supplemental Figure 1A; supplemental Table 3). In vivo, AMG 701 induced a dose-dependent depletion of PCs in blood and BM (Figure 5B; supplemental Table 4). Greater depletion of PC genes was observed in blood compared with BM. In BM, PC gene depletion increased with time of exposure, reaching 85% (BCMA) and 74% (J-chain) on day 12 at the highest dose tested. In blood, depletion of BCMA and J-chain transcript levels was greater on day 6 than on day 12 (BCMA day 6: 72%, 91%, 97% vs day 12: 62%, 70%, 93%; J-chain day 6: 66%, 92%, 98% vs day 12: 41%, 71%, 86% for groups 1-3, respectively; average per group, n = 3 per group), with the most sustained depletion observed at the highest dose. In blood, the degree of BCMA and J-chain transcript depletion was similar. In BM, although both genes followed a similar trend, the extent of BCMA transcript depletion was greater than J-chain transcript depletion. Minimal, yet dose-dependent, T-cell activation (Figure 5C) and cytokine secretion (Figure 5D) were observed, likely due to the restricted expression of BCMA protein. AMG 701 was well tolerated, as evidenced by stable body weight and temperature.
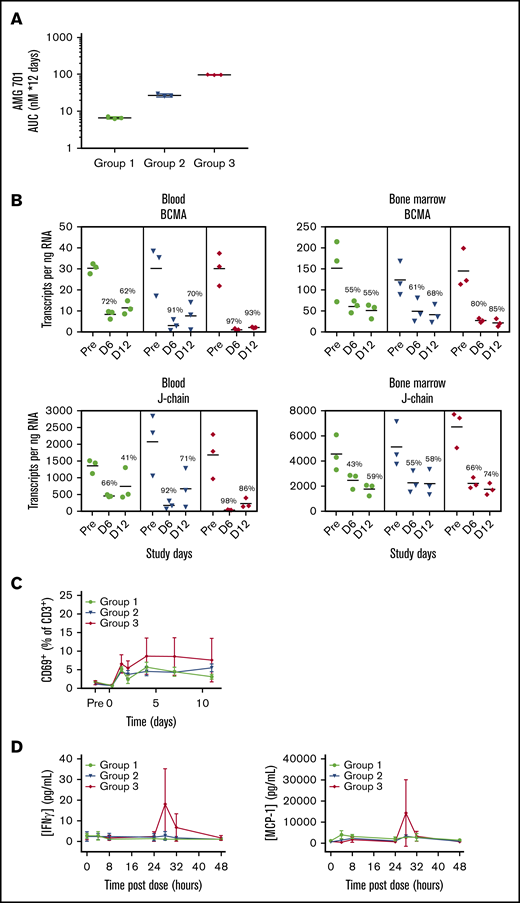
Robust depletion of BCMA mRNA indicates effective AMG 701–mediated elimination of BCMA+cells in blood and BM of cynomolgus monkeys in vivo. (A) Mean (± standard deviation) exposure of AMG 701 in cynomolgus monkeys (n = 3 per group), represented as area under the concentration-time curve (AUC), calculated as nanomolar AMG 701 administered per day times 12 days of administration. (B) Absolute number of BCMA and J-chain mRNA transcripts in blood and BM per nanogram of RNA quantified by ddPCR predose (Pre) and on days 6 (D 6) and day 12 (D 12) postdose in cynomolgus monkeys, treated as in panel A. Numbers indicate mean percentage of depletion relative to predose. T-cell activation shown as CD69+ percentage of CD3+ cells (C) and serum concentration of interferon-γ (IFNγ; left panel) and MCP-1 (right panel) (D) over time in cynomolgus monkeys, treated as in panel A.
Robust depletion of BCMA mRNA indicates effective AMG 701–mediated elimination of BCMA+cells in blood and BM of cynomolgus monkeys in vivo. (A) Mean (± standard deviation) exposure of AMG 701 in cynomolgus monkeys (n = 3 per group), represented as area under the concentration-time curve (AUC), calculated as nanomolar AMG 701 administered per day times 12 days of administration. (B) Absolute number of BCMA and J-chain mRNA transcripts in blood and BM per nanogram of RNA quantified by ddPCR predose (Pre) and on days 6 (D 6) and day 12 (D 12) postdose in cynomolgus monkeys, treated as in panel A. Numbers indicate mean percentage of depletion relative to predose. T-cell activation shown as CD69+ percentage of CD3+ cells (C) and serum concentration of interferon-γ (IFNγ; left panel) and MCP-1 (right panel) (D) over time in cynomolgus monkeys, treated as in panel A.
AMG 701 induced PD-1 expression on T cells and combination with PD-1–blocking antibody increased its potency in vitro
PD-1 expression is induced on T cells upon T-cell activation, and binding of PD-1 to its ligands PD-L1 or PD-L2 decreases T-cell activity.35 Likewise, AMG 701–mediated T-cell activation induced a dose-dependent increase in PD-1 expression on T cells (Figure 6A). The timing, magnitude, and duration of PD-1 induction varied with different E:T ratios (Figure 6A). In assays with lower E:T ratios, most T cells were PD-1+, and expression was maintained for a longer time compared with assays with higher E:T ratios. The impact of PD-1/PD-L1 engagement36,37 on the potency of AMG 701 was assessed. In cocultures of PD-1+ T cells (supplemental Figure 7A) with PD-L1–overexpressing MM cell lines, AMG 701 potency was reduced three- to fourfold compared with vector-transduced cells (supplemental Figure 7B). Addition of a PD-1–blocking antibody resulted in statistically significant (four- and fivefold) increases in AMG 701 potency (P = .01, P = .0008, paired Student t test; n = 5 pan T-cell donors; Figure 6B-C) and maximum killing (P = .0096, P = .002; supplemental Figure 7C). In an assay designed to more closely represent a normal physiologic state, using PD-1− T cells, the addition of a PD-1–blocking antibody increased AMG 701 potency three- and twofold (Figure 6D). Increased cytotoxicity was associated with increased secretion of interferon-γ and tumor necrosis factor-α (Figure 6E; supplemental Figure 7D).
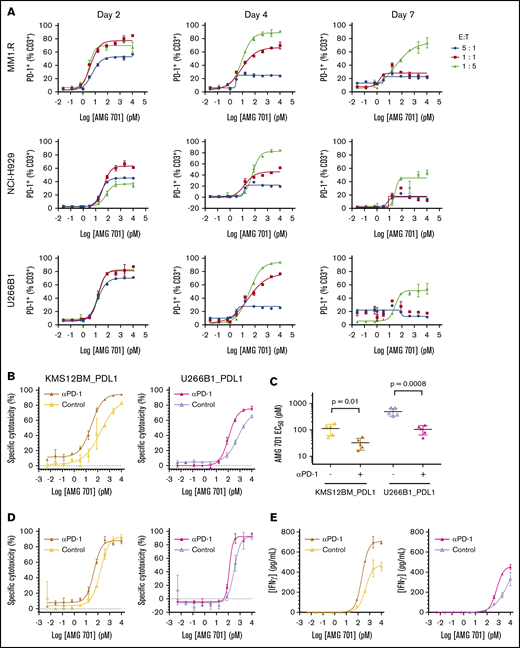
Combination with as PD-1–blocking antibody increases AMG 701 cytotoxicity in vitro. (A) Expression of PD-1 on CD3+ T cells from TDCC assays with cell lines and E:T ratios as indicated, assessed by flow cytometry at different times. Data are mean ± standard deviation (SD) of 2 technical replicates. Curves are representative of 2 human pan T-cell donors. (B) Specific cytotoxicity against KMS12BM_PDL1 (left panel) and U266B1_PDL1 (right panel) cultured for 24 hours 1:1 with CD3/CD28-activated human pan T cells and increasing concentrations of AMG 701, with (closed triangles with dark-shaded curves; mustard or magenta) or without (open triangles with light-shaded curves; yellow or lavender) 10 µg/mL PD-1–blocking antibody. Data are mean ± SD of 2 technical replicates. Curves are representative of 5 pan T-cell donors. (C) EC50 of AMG 701, with or without anti–PD-1–blocking antibody, calculated in panel B, n = 5 T-cell donors, KMS12BM_PDL1 (P = .01); U266B1_PDL1 (P = .0008); paired Student t test. Data are mean ± SD. (D) Specific cytotoxicity against KMS12BM_PDL1 and U266B1_PDL1 cultured for 96 hours at 1:5 E:T ratio with resting T cells and increasing concentrations of AMG 701, with (closed triangles with dark-shaded curves; mustard or magenta) or without (open triangles with light-shaded curves; yellow or lavender) 10 µg/mL PD-1–blocking antibody. Data are mean ± SD of 2 technical replicates, representing 1 of 2 assays. (E) Concentration of IFN-γ in supernatants collected from panel D at 72 hours, quantified by an enzyme-linked immunosorbent assay.
Combination with as PD-1–blocking antibody increases AMG 701 cytotoxicity in vitro. (A) Expression of PD-1 on CD3+ T cells from TDCC assays with cell lines and E:T ratios as indicated, assessed by flow cytometry at different times. Data are mean ± standard deviation (SD) of 2 technical replicates. Curves are representative of 2 human pan T-cell donors. (B) Specific cytotoxicity against KMS12BM_PDL1 (left panel) and U266B1_PDL1 (right panel) cultured for 24 hours 1:1 with CD3/CD28-activated human pan T cells and increasing concentrations of AMG 701, with (closed triangles with dark-shaded curves; mustard or magenta) or without (open triangles with light-shaded curves; yellow or lavender) 10 µg/mL PD-1–blocking antibody. Data are mean ± SD of 2 technical replicates. Curves are representative of 5 pan T-cell donors. (C) EC50 of AMG 701, with or without anti–PD-1–blocking antibody, calculated in panel B, n = 5 T-cell donors, KMS12BM_PDL1 (P = .01); U266B1_PDL1 (P = .0008); paired Student t test. Data are mean ± SD. (D) Specific cytotoxicity against KMS12BM_PDL1 and U266B1_PDL1 cultured for 96 hours at 1:5 E:T ratio with resting T cells and increasing concentrations of AMG 701, with (closed triangles with dark-shaded curves; mustard or magenta) or without (open triangles with light-shaded curves; yellow or lavender) 10 µg/mL PD-1–blocking antibody. Data are mean ± SD of 2 technical replicates, representing 1 of 2 assays. (E) Concentration of IFN-γ in supernatants collected from panel D at 72 hours, quantified by an enzyme-linked immunosorbent assay.
Model of AMG 701:BCMA interaction has implications for BiTE molecule mechanism of action
To understand the molecular mechanism of action of AMG 701, a model depicting AMG 701 recognition of BCMA and CD3 was constructed based on the crystal structure of the complex of OKT3 Fab with CD3γε (PDB:1SY6). The anti-BCMA scFv was docked to BCMA (PDB:1XU2) based on epitope information detailed in patent US10072088. The 3-dimensional model suggests that AMG 701 can form an immunological synapse with an approximate distance of 100 Å from the tumor cell membrane to the T-cell membrane (Figure 7). This distance is comparable to that generated through the interaction of a TCR with a peptide–major histocompatibility complex class I molecule (pMHC) (TCR:pMHC; PDB:1BD2). In this model, the half-life–extending Fc moiety does not affect AMG 701 binding of BCMA or CD3 and can be accommodated within the 100-Å synapse. These data are consistent with previous reports that BiTE molecules achieve optimal target cell killing by mimicking the TCR:pMHC immunological synapse.
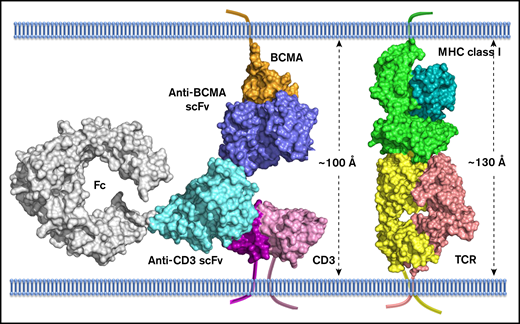
Computational model of extracellular BCMA domain in complex with AMG 701. All proteins are shown in surface representation. BCMA, orange; CD3, magenta and pink; anti-BCMA scFv, blue; anti-CD3 scFv, cyan; Fc, gray; MHC class I, dark cyan and light green; TCR, yellow and salmon. The transmembrane anchor is shown as a ribbon.
Computational model of extracellular BCMA domain in complex with AMG 701. All proteins are shown in surface representation. BCMA, orange; CD3, magenta and pink; anti-BCMA scFv, blue; anti-CD3 scFv, cyan; Fc, gray; MHC class I, dark cyan and light green; TCR, yellow and salmon. The transmembrane anchor is shown as a ribbon.
Discussion
With no curative therapies and ∼50% survival 5 years after diagnosis,3 there is an unmet need for novel therapies for MM. Herein, an HLE anti-BCMA BiTE molecule was characterized in preclinical models. BCMA is an ideal target for a BiTE molecule because of the universal and elevated expression on MM cells and normal expression restricted to PCs.8 AMG 701 induced specific TDCC in vitro against BCMA-expressing MM cell lines with picomolar potency; induced T-cell activation and cytokine release, consistent with the BiTE molecule mechanism of action; inhibited growth of established tumor xenografts; and increased survival in an orthotopic mouse xenograft model.
In vivo assessment of AMG 701 required defining a PC cell surface immunophenotype and BCMA-expression profiling in cynomolgus monkeys. Using known human PC markers, we defined a novel cynomolgus monkey PC cell surface immunophenotype, CD3−CD20−CD27−CD38hiCS1hi, which was confirmed by cytospin and Wright Giemsa analysis of sorted cells. In rhesus macaques, a nonhuman primate species commonly used to evaluate human vaccines, characterization of BM and PB PCs identified a population of CD3−CD19+CD20−CD38++CD138++ cells with intracellular IgG and variable CD27 expression.38,39 Despite some similarities in cynomolgus monkey and rhesus macaque PC immunophenotypes, species-specific biology likely exists, given the differences in CD38, CS1, CD138, and CD27 expression. Taken together, we report a novel cynomolgus monkey PC immunophenotype (CD3−CD20−CD27−CD38hiCS1hi) and confirm BCMA protein expression on these cells. In contrast with reports in the literature,26 BCMA was not detected on cynomolgus monkey PB B cells.
Precise quantitation of PCs in BM and blood (frequency, 0.1%-3%) using traditional methodologies, such as cytological evaluation or flow cytometry, is challenging. Therefore, a quantitative ddPCR assay using 2 PC-specific genes, BCMA and J-chain, was developed to measure AMG 701–induced PC depletion in cynomolgus monkeys. PC depletion in blood and BM was dose-dependent, suggesting increased in vivo activity with increasing exposures. For each dose level, PC depletion was greater in blood than in BM, likely as a result of increased BiTE molecule biodistribution in the blood.40 Biodistribution of HLE BiTE molecules is similar to monoclonal antibodies, which can demonstrate up to fivefold lower exposure in BM relative to blood.40-42 Greater depletion of BCMA transcripts relative to J-chain transcripts observed in BM may reflect the presence of B-cell progenitor cells that express J-chain, but not BCMA, mRNA.43 The increased BCMA transcript observed at day 12 was not due to loss of exposure but may reflect mobilization of PC precursors that express BCMA transcripts but lack BCMA surface protein.26
Expression of immune checkpoints that attenuate T-cell activity35 can be induced by BiTE molecules.44-46 Likewise, AMG 701–mediated T-cell activation induced PD-1 expression. In TDCC assays of PD-1+ T cells and PD-L1–overexpressing target cells, AMG 701 potency was reduced. The addition of a PD-1–blocking antibody restored AMG 701 potency, consistent with reports of PD-1 blockade with other T-cell–engaging therapeutics.27,45-47 Further, increased TDCC was observed in the more physiologic context of resting T cells, suggesting that AMG 701–induced PD-1 expression can be targeted by a PD-1–blocking antibody. Increased cytotoxicity was associated with increased cytokine secretion, consistent with the mechanism of action of PD-1 blockade.48 In MM patients treated with dexamethasone and an immunomodulatory drug, addition of an anti–PD-1 antibody led to increased toxicity,49 potentially as a result of increased immune activation. In contrast to immunomodulatory drug–induced nonspecific immune activation, BiTE molecules specifically redirect T cells to target-expressing cells. Because of this difference in mechanism and the restricted expression of BCMA, the safety profile of AMG 701, in combination with PD-1 blockade, may be acceptable.
A model of AMG 701 binding to BCMA and CD3 was constructed, and the size of the cytolytic immunological synapse was compared with the size of the immunological synapse generated from the interaction of a TCR with MHC class I. BiTE molecules have been previously reported to induce the formation of synapses that are nearly indistinguishable from those formed by TCR:pMHC interaction.50 We confirmed that the inclusion of the half-life extending Fc domain is not expected to disrupt the size of the synapse. Indeed, AMG 701 potency was similar to the non–Fc-containing anti-BCMA BiTE molecule AMG 420,20 which has shown a response rate of 70% (7/10) in MM patients at the maximum tolerated dose of 400 µg/d.22
Collectively, our preclinical data support the clinical development of AMG 701 in MM patients. Currently, AMG 701 is being examined in a phase 1 FIH clinical study in relapsed/refractory MM patients (NCT03287908).
Data sharing requests should be sent to Tara Arvedson (taraa@amgen.com). Qualified researchers may request data from Amgen clinical studies. Complete details are available at the following: https://wwwext.amgen.com/science/clinical-trials/clinical-data-transparency-practices/.
Acknowledgments
The authors thank Elizabeth Leight (Amgen Inc.) for providing medical writing support and Edward Kim for generating the KMS12BM_PDL1 and U266B1_PDL1 cell lines.
This work was supported by Amgen Inc.
Authorship
Contribution: R.L.G., A.G., C.-M.L., P.D., P.B., O.T., M.K., M. Friedrich, B.R., A.C., M.B., and T.A. contributed to the conception and design of the study; R.L.G., A.G., C.-M.L., P.D., P.B., A. Sternjak, O.T., M.K., J.W., M. Friedrich, E.L., X.M., A. Sudom, and M. Farshbaf conducted experiments; R.L.G., A.G., M.B., and T.A. prepared the manuscript; and all authors analyzed and interpreted the data and read, revised, and approved the final version of the manuscript.
Conflict-of-interest disclosure: R.L.G., C.-M.L., P.D., P.B., A. Sternjak, O.T., M.K., J.W., M. Friedrich, B.R., E.L., X.M., A. Sudom, M. Farshbaf, A.C., and T.A. are employed by Amgen Inc. or Amgen GmbH and are Amgen stockholders. A.G. and M.B. are former employees of Amgen Inc.
The current affiliation for A.G. is Janssen Research and Development, LLC, San Diego, CA.
The current affiliation for M.B. is Biochemical and Cellular Pharmacology, Genentech, South San Francisco, CA.
Correspondence: Tara Arvedson, Amgen Inc., 1120 Veterans Blvd, South San Francisco, CA 94080; e-mail: taraa@amgen.com; and Mercedesz Balazs, Biochemical and Cellular Pharmacology, Genentech, South San Francisco, CA 94080, e-mail: merci@gene.com.

