

Key points
scRNA-seq provides a high resolution snapshot of hematopoiesis in thousands of primary cells from individual patients with marrow failure.
We observed a preferential loss of lympho-myeloid differentiation in stem cells/multipotent progenitors prior to lineage specification.

Abstract
Constitutional GATA2 deficiency caused by heterozygous germline GATA2 mutations has a broad spectrum of clinical phenotypes, including systemic infections, lymphedema, cytopenias, and myeloid neoplasms. Genotype–phenotype correlation is not well understood mechanistically in GATA2 deficiency. We performed whole transcriptome sequencing of single hematopoietic stem and progenitor cells from 8 patients, who had pathogenic GATA2 mutations and myelodysplasia. Mapping patients’ cells onto normal hematopoiesis, we observed deficiency in lymphoid/myeloid progenitors, also evident from highly constrained gene correlations. HSPCs of patients exhibited distinct patterns of gene expression and coexpression compared with counterparts from healthy donors. Distinct lineages showed differently altered transcriptional profiles. Stem cells in patients had dysregulated gene expression related to apoptosis, cell cycle, and quiescence; increased expression of erythroid/megakaryocytic priming genes; and decreased lymphoid priming genes. The prominent deficiency in lympho-myeloid lineages in GATA2 deficiency appeared at least partly due to the expression of aberrant gene programs in stem cells prior to lineage commitment. We computationally imputed cells with chromosomal abnormalities and determined their gene expression; DNA repair genes were downregulated in trisomy 8 cells, potentially rendering these cells vulnerable to second-hit somatic mutations and additional chromosomal abnormalities. Cells with complex cytogenetic abnormalities showed defects in genes related to multilineage differentiation and cell cycle. Single-cell RNA sequencing is powerful in resolving transcriptomes of cell subpopulations despite a paucity of cells in marrow failure. Our study discloses previously uncharacterized transcriptome signatures of stem cells and progenitors in GATA2 deficiency, providing a broad perspective of potential mechanisms by which germline mutations modulate early hematopoiesis in a human disease. This trial was registered at www.clinicaltrials.gov as NCT01905826, NCT01861106, and NCT00001620.
Introduction
The GATA2 gene encodes a transcription factor required for stem cell homeostasis and hematopoiesis.1-3 Constitutional GATA2 deficiency caused by heterozygous germline GATA2 mutations results in a wide spectrum of clinical presentations including systemic infections, lymphedema, pulmonary disease, cytopenias, a high risk of developing myelodysplastic syndromes (MDS), and acute myeloid leukemia.4-8 GATA2 deficiency constitutes a major MDS predisposition syndrome: germline GATA2 mutations are present in about 7% of primary MDS cases in children and adolescents.9 Monosomy 7 and trisomy 8 are frequent chromosomal abnormalities in GATA2 deficiency and feature in disease prognosis and malignant transformation.9,10
The GATA2 protein contains 2 highly conserved zinc finger domains which mediate DNA binding and protein-protein interactions.11,12 GATA2 mutations are classified into 3 categories: missense, null, and regulatory mutations.10 Missense mutations are mainly located in 2 zinc finger domains.13 GATA2 deficiency has considerable clinical heterogeneity, and genotype–phenotype associations are not significant.9,10,14 Profound monocytopenia, B-cell and NK-cell lymphopenias, and dendritic cell (DC) deficiency are characteristic of GATA2 deficiency.4,6,10 Absence of multilymphoid progenitors and decreased granulocyte macrophage progenitors occur early in disease.15-17 Gene expression in GATA2 deficiency has been described only in a few limited studies, usually for bulk cell populations,16,18,19 partly due to the typical paucity of cells because GATA2 deficiency results in marrow failure. How GATA2 deficiency negatively affects hematopoiesis, especially preferential loss of several specific lineages, is poorly understood.
Recent advances in single-cell RNA sequencing (scRNA-seq) have facilitated transcriptome profiling of rare cell populations at a high resolution.20,21 Hematopoietic stem and progenitor cells (HSPCs) are found to be surprisingly heterogeneous, including multipotent stem cells and lineage-committed progenitors. Gene expression displays lineage specificity and cell type heterogeneity. We and others defined subpopulations of HSPCs based on transcriptome signatures,22-25 enabling characterization of specific lineages in the rare CD34+ cell population. Presuming that GATA2 mutations would have selective effects on different hematopoietic lineages in a constitutional disease, we used scRNA-seq to examine transcriptome of HSPCs in GATA2 deficiency. Using this method, we sought to understand underappreciated changes in gene expression in subpopulations of HSPCs and the molecular mechanisms of alterations in blood cell production and malignant transformation resulting from germline GATA2 mutations.
We performed scRNA-seq of sorted bone marrow (BM) CD34+ cells from 8 GATA2-deficient patients who had well-characterized GATA2 mutations and clinical evidence of myelodysplasia. We observed preferred deficiency in lymphoid and myeloid progenitors, and each hematopoietic lineage had unique patterns of gene expression and gene coexpression that were different compared with counterpart cells from healthy donors. These differences likely could not be resolved in studies of bulk populations of cells. We also observed that the molecular signatures of aneuploid monosomy 7 and trisomy 8 cells to be distinct in the context of germline GATA2 mutations. scRNA-seq can resolve at high resolution the patterns of hematopoiesis in diseases in which hematopoietic cells are infrequent.
Methods
Full descriptions of experimental procedures and analytical methods can be found in the supplemental Methods. Data have been deposited in the National Center for Biotechnology Information Gene Expression Omnibus database under the accession number GSE135194.
Subjects and samples
BM samples were obtained from GATA2-deficient patients after written informed consent was obtained under protocols approved by the Institutional Review Boards of National Institutes of Allergy and Infectious Diseases or National Cancer Institute (www.clinicaltrials.gov; NCT01905826 or NCT01861106), in accordance with the Declaration of Helsinki. Eight patients with germline GATA2 mutations were enrolled; all patients also had been diagnosed with MDS. Recruitment of patients and diagnostic procedures have been described,4 as have analyses of genomic DNA and complementary DNA.4,18 Primer and messenger RNA sequences are available upon request. Four healthy donors (25 years old/female, 31 years old/female, 41 years old/female, and 44 years old/male) were enrolled as controls under protocol NCT00001620 at the National Heart, Lung, and Blood Institute. Flow cytometric sorting of lineage-CD34+ HSPCs was performed immediately following isolation of BM-mononuclear cells. Our sorting strategy is illustrated in supplemental Figure 1A. Purified lineage-CD34+ cells were cryopreserved until use.
Whole transcriptome amplification, complementary DNA library preparation, and sequencing
scRNA-seq analysis was performed using the 10× Genomics System and the Chromium Single Cell 3′ Reagent Kit V2 according to the manufacturer’s protocol.26 scRNA-seq libraries were sequenced with a 75-bp paired end reads format on an Illumina HiSeq 3000 system (supplemental Figure 1B).
scRNA-seq data analysis
Data preprocessing.
Alignment, barcode assignment, and unique molecular identifier counting were performed using the Cell Ranger pipeline (http://software.10xgenomics.com/single-cell/overview/welcome).26 Sequencing quality data are provided in supplemental Table 1.
Downstream analyses.
Dimensionality reduction and clustering were performed by principal component analysis and visualized with t-distributed stochastic neighbor embedding (tSNE). Cell type identity was assigned to each cluster based on significance in overlap between signature genes of HSPCs27 and cluster-specific genes (Fisher’s exact test), and an area-under-the curve (AUC) score for individual cells using AUCell package in R.28 Monocle29 was used to reconstruct a differentiation continuum of cells from healthy donors and to order the differentiation of individual cells for pseudo-time analysis. Gene Sets Enrichment Analysis (GSEA; http://software.broadinstitute.org/gsea), Gene Ontology (GO) analysis,30,31 Kyoto Encyclopedia of Genes and Genomes (KEGG) analysis,32,33 and Genomatix Generanker34 were used to interpret gene set enrichment and pathways of defined differentially expressed genes. Gene interaction analysis was performed based on the Search Tool for the Retrieval of Interacting Genes/Proteins (STRING).35 Gene expression data were imputed with Markov Affinity-based Graph Imputation of Cells (MAGIC) diffusion36 before performing Gene Set Coexpression Analysis.37 Diff-CoEx38 was used to systematically identify differentially coexpressed gene modules between patients and healthy donors. Identification of aneuploidy and diploid cells was performed using both our in-house software22 and COpy-Number analysis In single-Cell RNA-Sequencing (CONICS).39
Results
Resolving normal hematopoiesis by scRNA-seq
Nine samples from 8 GATA2-deficient patients (2 samples from patient 4 were obtained at different time points) with hypocellular MDS were analyzed. To characterize effects of GATA2 mutations on early stages of hematopoiesis, lineage-CD34+ cells were sorted to enrich for HSPCs. In total, after quality control, 15 245 and 19 145 single CD34+ cell libraries from healthy donors and patients, respectively, were retained for further analyses.
To impute a pattern of HSPC differentiation with transcriptome sequences, sequencing data of single CD34+ cells from healthy donors were visualized in tSNE. CD34+ cells could be computationally assigned to subpopulations: hematopoietic stem cells and multipotent progenitors (HSCs), megakaryocyte-erythroid progenitors (MEPs), granulocyte-monocyte progenitors (GMPs), B lymphocyte progenitors (ProBs), and early T lineage progenitors (ETPs) (Figure 1A). Pseudotemporal ordering was used to reconstruct normal hematopoiesis. By mapping the cell type profile from tSNE, we developed a trajectory of differentiation from HSCs to MEPs and to myeloid and lymphoid cells (Figure 1B). Expression of representative characteristic genes of the clusters and lineages is shown in Figure 1C and supplemental Figures 2 and 3. Thus, we were able to deconvolute at the single-cell level in the heterogenous CD34+ cell population as stem cells and lineage-committed progenitors, and we were able to reconstruct a trajectorial differentiation pattern of normal hematopoiesis.
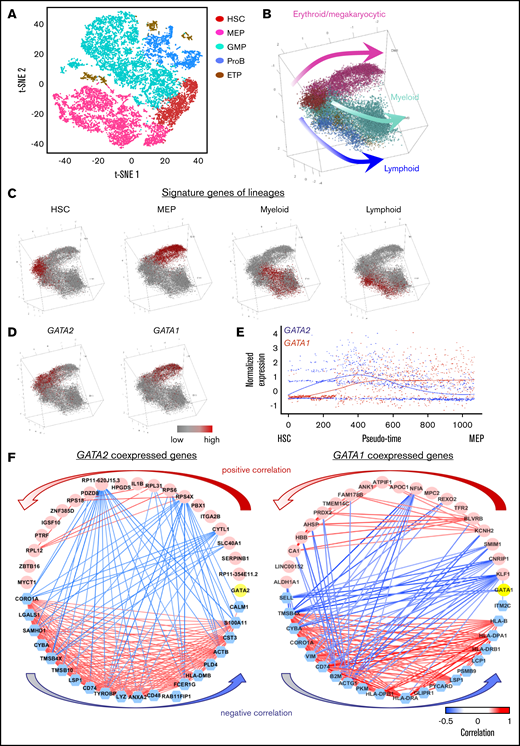
Hematopoietic differentiation in healthy donors and GATA2 deficiency. (A) A tSNE plot of single-cell gene expression of healthy donors. (B) Reconstruction of the hematopoietic hierarchy pseudo-time ordering in Monocle. Cells are colored by types (HSC, MEP, GMP, ETP, and ProB). (C) Average expression of characteristic genes for lineages are highlighted in a differentiation tree. HSC genes: SPINK2, CRHBP, MEIS1, and MLLT3; MEP genes: GATA1, HBD, TFRC, UROD, NFIA, and KLF1; myeloid progenitor genes: MPO, CEBPA, ELANE, IRF8, and LGALS1; lymphoid progenitor genes: DNTT, CXCR4, CD79A, BLNK, IGLL1, and EBF1. The characteristic gene list is from our previous findings using scRNA-seq and validated by qualitative polymerase chain reaction and literature mining (supplemental Figure 2). (D) Expression of GATA2 and GATA1 highlighted in the differentiation tree. (E) Dynamic expression of GATA2 and GATA1 along pseudo-time of HSC differentiation into MEP. The x-axis shows pseudo-time ordering from HSC to MEP estimated by Monocle 2. The y-axis shows normalized gene expression by scaleData function in Seurat package. (F) Top 20 coexpressed (pink) and anticoexpressed (blue) genes with GATA2 and GATA1 (yellow). Red and blue lines connecting the genes indicate the top positive and negative correlations, respectively. Same plots showing positive and negative correlations of all values are in supplemental Figure 4.
Hematopoietic differentiation in healthy donors and GATA2 deficiency. (A) A tSNE plot of single-cell gene expression of healthy donors. (B) Reconstruction of the hematopoietic hierarchy pseudo-time ordering in Monocle. Cells are colored by types (HSC, MEP, GMP, ETP, and ProB). (C) Average expression of characteristic genes for lineages are highlighted in a differentiation tree. HSC genes: SPINK2, CRHBP, MEIS1, and MLLT3; MEP genes: GATA1, HBD, TFRC, UROD, NFIA, and KLF1; myeloid progenitor genes: MPO, CEBPA, ELANE, IRF8, and LGALS1; lymphoid progenitor genes: DNTT, CXCR4, CD79A, BLNK, IGLL1, and EBF1. The characteristic gene list is from our previous findings using scRNA-seq and validated by qualitative polymerase chain reaction and literature mining (supplemental Figure 2). (D) Expression of GATA2 and GATA1 highlighted in the differentiation tree. (E) Dynamic expression of GATA2 and GATA1 along pseudo-time of HSC differentiation into MEP. The x-axis shows pseudo-time ordering from HSC to MEP estimated by Monocle 2. The y-axis shows normalized gene expression by scaleData function in Seurat package. (F) Top 20 coexpressed (pink) and anticoexpressed (blue) genes with GATA2 and GATA1 (yellow). Red and blue lines connecting the genes indicate the top positive and negative correlations, respectively. Same plots showing positive and negative correlations of all values are in supplemental Figure 4.
GATA transcription factors in normal hematopoiesis
We examined GATA2 and GATA1 expression and coexpression with other genes along differentiation pathways. GATA2 expression was high in HSCs and declined as cells differentiated along the MEP trajectory. Expression of GATA1 increased as cells differentiated from HSCs to MEPs and remained high during erythroid maturation. Expression of both GATA2 and GATA1 was largely absent in other cell types (Figure 1D-E). GATA1-coexpressed genes were highly enriched in pathways of hemoglobin metabolism, O2/CO2 exchange in erythrocytes, and cell cycle and mitosis. Genes coexpressed with GATA2 were involved in pathways to maintain diverse stem cell functions including stem cell hemostasis (the pathway of interleukin [IL]-3, fms-related receptor tyrosine kinase 3 [FLT3], IL-6, or activator protein 1 [AP-1] transcription factor, and NOTCH signaling), and also some downstream functional pathways (the signaling pathway of erythropoietin, thrombopoietin, granulocyte-colony stimulating factor, CCAAT enhancer binding protein α/β [CEBPA/CEBPB], or T-cell receptor [TCR]/B-cell receptor [BCR]). Anticoexpressed genes of both GATA1 and GATA2 were similarly and uniformly enriched in T cell, B cell, and the innate immune response and activation. Top 20 coexpressed and anticoexpressed genes of GATA factors are shown in Figure 1F and supplemental Table 2. These data implicated engagement of GATA2 in diverse stem cell functions and GATA1 in maintaining erythroid-megakaryocytic differentiation, and roles of both in cell differentiation opposing the early myeloid/lymphoid trajectory.
Mapping cellular hierarchy shows distinct differentiation patterns in GATA2 deficiency
The patients in this study had germline GATA2 mutations affecting the gene’s zinc-finger domains (Figure 2A). The clinical and laboratory characteristics of the patients are shown in Table 1. Consistent with previous reports,4,6,10 these patients showed stereotypical laboratory abnormalities with prominent monocyte, B-cell, and NK-cell deficiency and/or pancytopenia (Figure 2B).
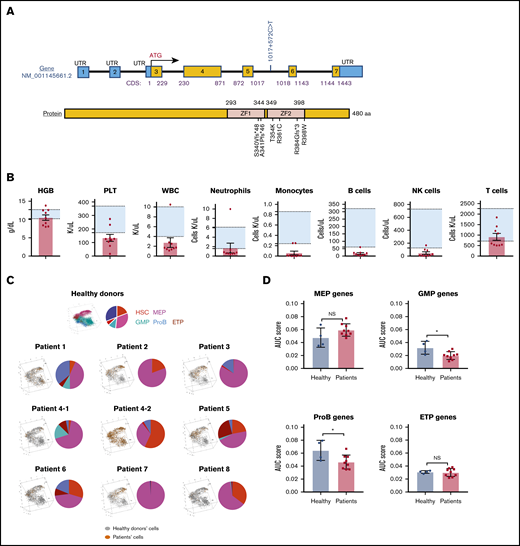
Gene mutations, blood cell counts, and hematopoietic differentiation in patients with GATA2 deficiency. (A) Schematic diagrams of GATA2 messenger RNA and protein. Mutations of the GATA2 gene or protein lesions in patients are indicated. (B) Patients’ hemoglobin levels (HGB), platelet counts (PLT), white blood cell counts (WBC), neutrophil counts, monocyte counts, B-cell counts, NK-cell counts, and T-cell counts. Background shading shows a normal reference range for each parameter. (C) Patients’ cells were mapped onto the differentiation tree (left) by the nearest neighbor method, based on transcriptome similarity with cells from healthy donors. A pie chart (right) in each panel shows percentages of subpopulations in HSPCs. (D) AUC scores were computed based on expression of lineage signature genes. Signature scores of MEP, GMP, ProB, and ETP in patients were compared with those in healthy donors using 2-sided, unpaired Mann-Whitney U test. A column plot shows means ± standard deviation. *P < .05. Sample patient 4-2 was obtained before HSC transplantation, 8 months after patient 4-1. During this interval, patient 4 had extensive progression of human papilloma virus infection, but there was no significant difference in blood counts and BM biopsy appearance. NS, not significant.
Gene mutations, blood cell counts, and hematopoietic differentiation in patients with GATA2 deficiency. (A) Schematic diagrams of GATA2 messenger RNA and protein. Mutations of the GATA2 gene or protein lesions in patients are indicated. (B) Patients’ hemoglobin levels (HGB), platelet counts (PLT), white blood cell counts (WBC), neutrophil counts, monocyte counts, B-cell counts, NK-cell counts, and T-cell counts. Background shading shows a normal reference range for each parameter. (C) Patients’ cells were mapped onto the differentiation tree (left) by the nearest neighbor method, based on transcriptome similarity with cells from healthy donors. A pie chart (right) in each panel shows percentages of subpopulations in HSPCs. (D) AUC scores were computed based on expression of lineage signature genes. Signature scores of MEP, GMP, ProB, and ETP in patients were compared with those in healthy donors using 2-sided, unpaired Mann-Whitney U test. A column plot shows means ± standard deviation. *P < .05. Sample patient 4-2 was obtained before HSC transplantation, 8 months after patient 4-1. During this interval, patient 4 had extensive progression of human papilloma virus infection, but there was no significant difference in blood counts and BM biopsy appearance. NS, not significant.
Clinical and laboratory characteristics of patients with GATA2 deficiency
| Patient | Age, y /sex | Variant | Family history | BM diagnosis, cellularity, % | Cytogenetics | Infection | Other clinical features | |
|---|---|---|---|---|---|---|---|---|
| Nucleotide | Amino acid | |||||||
| 1 | 17/F | c.1017G>T | p.S340Vfs*48 | + | Hypoplastic MDS, 30% | 45,XX,–7[11]/47,XX,+8[1]/46,XX[8] | No | |
| 2 | 42/F | c.1017G>T | p.S340Vfs*48 | + | Hypoplastic MDS, 30% | 47,XX,+8[17]/46,XX[3] | No | |
| 3 | 22/F | c.1061C>A | p.T354K | + | Hypoplastic MDS, 20%-30% | Normal | MAC, Aspergillus | Pulmonary fibrosis |
| 4 | 32/F | c.1192C>T | p.R398W | – | Hypoplastic MDS, 5-10%, 20% | Normal | HPV genital, EBV | |
| 5 | 33/F | c.1017+572C>T | + | Hypoplastic MDS, 40% | Normal | Warts, lung infections, pyoderma gangrenosum and panniculitis, oral thrush, and herpes | ||
| 6 | 13/M | c.1021delG | p.A341Pfs*46 | – | Hypoplastic MDS, 20%-25% | Normal | Warts, cellulitis, respiratory infections | Emberger syndrome |
| 7 | 14/M | c.1150delA | p.R384Gfs*3 | – | Hypoplastic MDS, 30% | Normal | No | Mediastinal T cell lymphoma, deafness, and lupus pernio |
| 8 | 39/M | c.1081C>T | p.R361C | + | Hypoplastic MDS, 15%-20% | 47,XY,+1,der(1;7)(q10;p10),+8[6]/46,XY[14] | No | |
No known somatic mutations were detected by whole exome sequencing (data not shown). Patients received supportive treatment while seeking HSC transplantation.
+, positive; –, negative; EBV, Epstein-Barr virus; F, female; HPV, human papilloma virus; M, male; MAC, Mycobacterium avium complex.
To examine differentiation of HSPCs in GATA2 deficiency, cells from individual patients were compared with the normal differentiation continuum. Patients showed heterogeneity in differentiation patterns which were distinctive when compared with the pattern of normal hematopoiesis (Figure 2C). In general, consistent with earlier observations of lack of lymphoid and myeloid progenitors,15-17 there was prominent deficiency in granulocytes/monocytes/lymphocytes differentiation, but MEP differentiation was relatively preserved. Based on gene signatures within each lineage, we computed an AUC score of gene expression in each lineage for individual patients (supplemental Methods). Compared with healthy donors, there were significantly lower GMP and ProB scores in patients, MEP scores tended to be higher, and there were no obvious changes in ETP scores (Figure 2D).
A distinct transcriptional profile of HSPCs in GATA2 deficiency
When comparing gene expression of CD34+ cells of 9 patients’ samples with those of 4 healthy donors, we found distinct differences (supplemental Figure 6; supplemental Table 3). We performed GSEA to study skewed gene sets. There was highly aberrant enrichment of genes involved in cell cycle, heme metabolism, and the immune response (Figure 3A). To explore perturbed programs of potential biological significance, pathway analysis was performed for the most differentially expressed genes (supplemental Table 4). Upregulated genes were enriched in cell cycle, cell metabolism, hemoglobin, and erythrocyte functions (Figure 3B); downregulated genes were enriched in the innate and adaptive immune responses (Figure 3C). These results indicated global effects of GATA2 mutations on early hematopoiesis, with defects in lymphopoiesis and myelopoiesis.
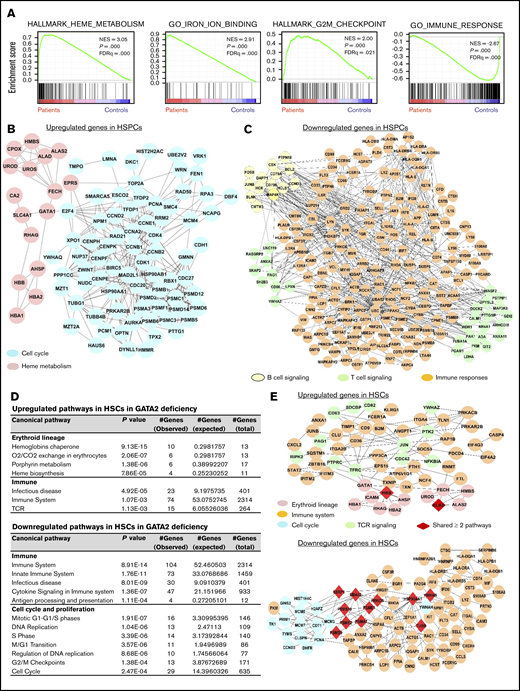
Pathway analysis of differentially expressed genes in SPCs of GATA2 deficiency. (A-C) Results in total CD34+ HSPCs. (D-E) Results in HSCs. (A) GSEA of differentially expressed genes in GATA2 deficiency compared with those in healthy donors. (B) A network of upregulated genes in cell cycle and heme metabolism in HSPCs of GATA2 deficiency. (C) A network of downregulated genes in B and T cell signaling and immune responses in HSPCs of GATA2 deficiency. (D) Lists of upregulated (top) and downregulated (bottom) genes in HSCs in GATA2 deficiency. (E) Networks of upregulated (top) and downregulated (bottom) genes in different pathways in HSCs in GATA2 deficiency. FDRq, false discovery rate q value; NES, normalized enrichment score.
Pathway analysis of differentially expressed genes in SPCs of GATA2 deficiency. (A-C) Results in total CD34+ HSPCs. (D-E) Results in HSCs. (A) GSEA of differentially expressed genes in GATA2 deficiency compared with those in healthy donors. (B) A network of upregulated genes in cell cycle and heme metabolism in HSPCs of GATA2 deficiency. (C) A network of downregulated genes in B and T cell signaling and immune responses in HSPCs of GATA2 deficiency. (D) Lists of upregulated (top) and downregulated (bottom) genes in HSCs in GATA2 deficiency. (E) Networks of upregulated (top) and downregulated (bottom) genes in different pathways in HSCs in GATA2 deficiency. FDRq, false discovery rate q value; NES, normalized enrichment score.
Comparisons were then made within individual cell types (supplemental Table 5). In HSCs, upregulated genes in GATA2 deficiency were enriched in erythroid cell differentiation and red cell functions (the chaperone pathway of hemoglobin, O2/CO2 exchange in erythrocytes, and heme biosynthesis); downregulated genes were highly enriched in the immune responses (immune system, infectious disease, and cytokine signaling) and cell cycle and proliferation (Figure 3D-E; supplemental Figure 7). Overall, skewed gene sets in HSCs in GATA2 deficiency showed upregulation in apoptosis and downregulation in DNA repair and DNA replication; gene sets in the hematopoietic lineage, especially the immune response, were downregulated whereas heme metabolism genes were upregulated; and gene sets related to maintaining quiescence (E2F and MYC targets) were also downregulated (supplemental Figure 8). These data indicated an unbalanced differentiation program favoring erythropoiesis, and intrinsic defects in myeloid/lymphoid differentiation and turnover of HSCs. To understand the deficiency of B lymphocytes, NK cells, and monocytes in this disease, we specifically explored transcriptome changes in lymphoid and myeloid progenitors. Genes of the immune response were upregulated in ProBs, whereas they were largely downregulated in GMPs and ETPs. Cell cycle and mitosis genes were upregulated in ProBs but were downregulated in ETPs. In MEPs, upregulated genes were mainly related with cell cycle and mitosis, as well as hemoglobin synthesis pathways, whereas immune genes were downregulated (supplemental Table 6). In summary, scRNA-seq revealed globally dysregulated transcription in stem and progenitor cells in GATA2 deficiency, and GATA2 mutations modified hematopoiesis such that different lineages exhibited distinct profiles.
HSCs are less primed to myeloid/lymphoid differentiation, but the erythroid/megakaryocytic program is preserved in GATA2 deficiency
Lack of myeloid/lymphoid cells (B and NK lymphocytes, and monocytes) was prominent despite GATA2 gene expression restriction to stem cells and early MEPs. Based on our earlier findings of lineage-biased differentiation potential and multilineage priming status of stem cells,24,40,41 we hypothesized that skewed programs determined cell fate prior to lineage specification. We calculated AUC scores of expression levels of erythroid/megakaryocytic and myeloid/lymphoid gene programs and plotted their dynamics along pseudo-time in HSCs in patients and healthy donors. We observed significantly lower B cell gene programs and higher erythroid/megakaryocytic programs in patients’ HSCs (Figure 4A-B; supplemental Figure 9).
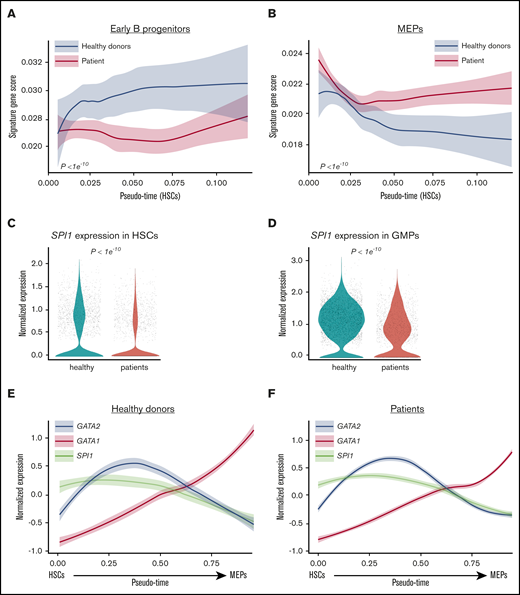
Lineage priming programs in HSC and transcription factors switch. AUC scores of signature genes of early B progenitors (A) and MEP (B) in HSCs. The x-axis shows pseudo-time ordering of HSCs. The y-axis shows AUC scores of expression of lineage signature genes. Normalized expression levels of SPI1 in HSCs (C) and GMPs (D). Dynamic expression of GATA2 (blue), GATA1 (red), and SPI1 (also known as PU.1; brown) in differentiation from HSCs to MEPs determined by pseudo-time ordering with Palantir in healthy donors (E) and patients (F). The x-axis shows pseudo-time ordering from HSC to MEP estimated by Monocle 2. The y-axis shows normalized gene expression by scaleData function in Seurat package.
Lineage priming programs in HSC and transcription factors switch. AUC scores of signature genes of early B progenitors (A) and MEP (B) in HSCs. The x-axis shows pseudo-time ordering of HSCs. The y-axis shows AUC scores of expression of lineage signature genes. Normalized expression levels of SPI1 in HSCs (C) and GMPs (D). Dynamic expression of GATA2 (blue), GATA1 (red), and SPI1 (also known as PU.1; brown) in differentiation from HSCs to MEPs determined by pseudo-time ordering with Palantir in healthy donors (E) and patients (F). The x-axis shows pseudo-time ordering from HSC to MEP estimated by Monocle 2. The y-axis shows normalized gene expression by scaleData function in Seurat package.
GATA2 functions to regulate transcription by interacting with other proteins or by binding to gene promoter regions. Among GATA2-interacting proteins and promoter-binding genes, expression levels of some (but not all) were aberrant in GATA2-deficient patients (supplemental Figure 10). In particular, SPI1 (also known as PU.1) was downregulated in HSCs and GMPs in patients (Figure 4C-D; supplemental Figure 11). SPI1 has important roles in lymphoid and myeloid lineage differentiation42,43 ; its downregulation may contribute to the myeloid/lymphoid deficiency in GATA2 deficiency. We visualized GATA2, GATA1, and SPI1 expression with differentiation from HSC to MEP in patients’ and healthy donors’ cells and observed the crossing of GATA2 and SPI1 expression occurred prior to the GATA2 and GATA1 expression switch (Figure 4E-F).
Distinct gene coexpression networks in GATA2 deficiency
Genes do not function independently but do so in concert through complex regulatory networks. We evaluated gene-correlation scores in patients and healthy donors. Most GATA2-deficient patients exhibited higher correlation across gene sets than did healthy individuals (Figure 5A-B; supplemental Figure 12), indicating loss of heterogeneity in gene programs and probably constrained cell differentiation as a result of skewing to specific lineages in GATA2 deficiency.
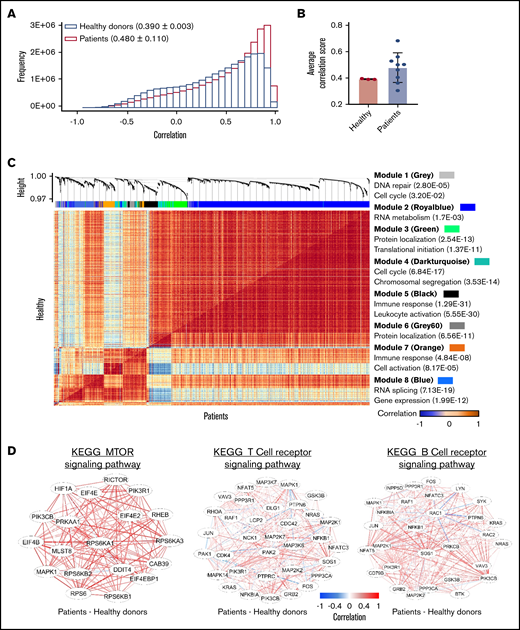
Gene coexpression analysis in GATA2 deficiency. (A) Gene correlation distribution in healthy donors (pink; 0.390 ± 0.003) and patients (blue; 0.480 ± 0.110) The x-axis shows gene correlation score after imputations with MAGIC. The y-axis shows frequency. (B) A bar graph shows comparison of average correlation scores in patients with those in healthy donors. (C) A comparative correlation heatmap shows correlation between pairs of genes ranging from negative correlation (blue) to positive correlation (red) in healthy donors (upper left) and patients (lower right). The upper panel shows unsupervised modules of differentially coexpressed genes defined by weighted gene coexpression network analysis. Modules of genes are distinguished by colors. GO terms for each module of genes identified in the coexpression matrix are listed. Detailed information of individual gene modules is presented in supplemental Table 7. (D) Gene coexpression networks enriched in the KEGG_MTOR signaling pathway (left), the T-cell receptor signaling pathway (middle), and the B-cell receptor signaling pathway (right). Gene correlation networks are illustrated as the difference between patients and healthy donors.
Gene coexpression analysis in GATA2 deficiency. (A) Gene correlation distribution in healthy donors (pink; 0.390 ± 0.003) and patients (blue; 0.480 ± 0.110) The x-axis shows gene correlation score after imputations with MAGIC. The y-axis shows frequency. (B) A bar graph shows comparison of average correlation scores in patients with those in healthy donors. (C) A comparative correlation heatmap shows correlation between pairs of genes ranging from negative correlation (blue) to positive correlation (red) in healthy donors (upper left) and patients (lower right). The upper panel shows unsupervised modules of differentially coexpressed genes defined by weighted gene coexpression network analysis. Modules of genes are distinguished by colors. GO terms for each module of genes identified in the coexpression matrix are listed. Detailed information of individual gene modules is presented in supplemental Table 7. (D) Gene coexpression networks enriched in the KEGG_MTOR signaling pathway (left), the T-cell receptor signaling pathway (middle), and the B-cell receptor signaling pathway (right). Gene correlation networks are illustrated as the difference between patients and healthy donors.
To systematically identify gene modules with coordinated activities in GATA2 deficiency at the single-cell level, we first performed weighted gene coexpression network analysis. We constructed coexpression networks of patient and healthy HSPCs, with genes divided into multiple modules containing highly correlated (or anticorrelated) genes. Gene clustering and enriched GO terms are shown in supplemental Figure 13. Correlated genes in both patients and healthy donors shared similarities in forming clusters related to erythroid, myeloid, and lymphoid cell differentiation and function (heme metabolic process, cell signaling, and immune responses), cell proliferation (cell cycle and mitosis), and metabolism (RNA, protein, and lipid biosynthesis).
Next, we analyzed differential coexpression of genes of HSPCs to explore correlations between pairs of genes in GATA2 deficiency (supplemental Table 7). Differentially coexpressed gene pairs were highly enriched in GO terms for the immune response and myeloid leukocyte activation, cell cycle, and mitosis (Figure 5C). Similarly, differential coexpression in individual lineages was also enriched in the immune response, cell division and proliferation, and cell metabolism (supplemental Figures 14 and 15).
Last, we specifically examined differentially coexpressed gene pairs for enrichment in certain KEGG pathways. We found higher correlation of genes in mechanistic target of rapamycin kinase signaling (related with cell cycle) and T- and B-cell receptor signaling (immune responses) pathways in patients (Figure 5D; supplemental Figure 16).
Taken together, these results suggested that GATA2 mutations resulted in altered gene coexpression in HSPCs. GATA2-deficient cells exhibited constrained gene coregulation, and differentially coregulated gene pairs were enriched in the immune response. This is likely related to constrained myeloid/lymphoid differentiation and the production the prominent immunodeficiency of the GATA2 syndromes.
Aneuploidy participates in modifying hematopoiesis in GATA2 deficiency
Consistent with results of conventional clinical cytogenetics, chromosomal abnormalities were found in patients 1, 2, and 8 by comprehensive chromosome relative expression analysis (Figure 6A). Sliding window analysis of chromosomal copy number variations indicated patient 8 had a complex karyotype (Figure 6A-B). We noted aneuploidy in HSCs and all descendent lineages (Figure 6C). Overall percentages of monosomy 7 cells (77%) and of trisomy 8 cells (87%) in HSPCs inferred from scRNA-seq were similar to cytogenetics (11 of 20 metaphases with monosomy 7 in patient 1 and 17 of 20 metaphases with trisomy 8 in patient 2).
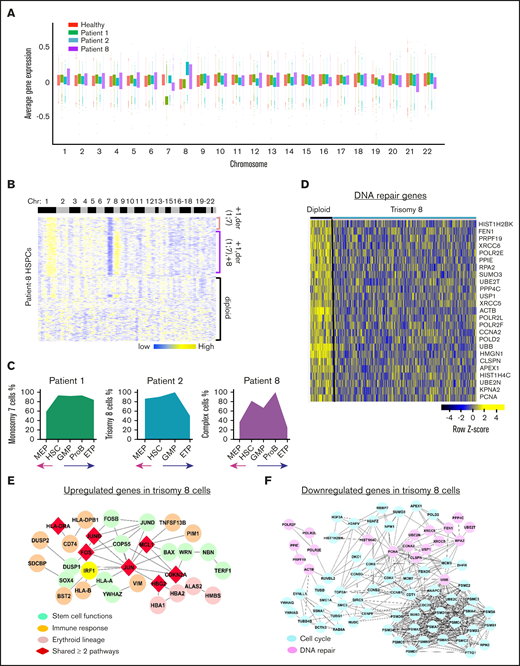
Aneuploidy in GATA2 deficiency. (A) Average gene expression for each chromosome in single cells from patients 1, 2, and 8. Average gene expression levels of individual chromosomes from 4 healthy donors were used for comparison. Chromosomal mapping read values were median centered. Top and bottom of the bars represent the 25% and 75% quartiles, respectively. (B) Heatmaps of chromosomal copy number variations (CNVs) signals of patient 8 obtained by the sliding window analysis. scRNA-seq data of patients were normalized against those of healthy donors. Copy number changes were examined in 22 chromosomes (columns) for patients’ individual cells (rows). Chromosome numbers are indicated on the top row. Three populations of cells are indicated on the right as +1,der(1;7); +1,der(1;7),+8; and diploid cells. (C) Percentages of aneuploid cells in subsets of HSPCs in patients 1, 2, and 8. The x-axis shows frequency of aneuploid cells. The y-axis shows HSPC subsets. (D) A heatmap of downregulated DNA repair genes in trisomy 8 cells in GATA2 deficiency. Networks of upregulated (E) and downregulated (F) genes in trisomy 8 cells in GATA2 deficiency.
Aneuploidy in GATA2 deficiency. (A) Average gene expression for each chromosome in single cells from patients 1, 2, and 8. Average gene expression levels of individual chromosomes from 4 healthy donors were used for comparison. Chromosomal mapping read values were median centered. Top and bottom of the bars represent the 25% and 75% quartiles, respectively. (B) Heatmaps of chromosomal copy number variations (CNVs) signals of patient 8 obtained by the sliding window analysis. scRNA-seq data of patients were normalized against those of healthy donors. Copy number changes were examined in 22 chromosomes (columns) for patients’ individual cells (rows). Chromosome numbers are indicated on the top row. Three populations of cells are indicated on the right as +1,der(1;7); +1,der(1;7),+8; and diploid cells. (C) Percentages of aneuploid cells in subsets of HSPCs in patients 1, 2, and 8. The x-axis shows frequency of aneuploid cells. The y-axis shows HSPC subsets. (D) A heatmap of downregulated DNA repair genes in trisomy 8 cells in GATA2 deficiency. Networks of upregulated (E) and downregulated (F) genes in trisomy 8 cells in GATA2 deficiency.
To characterize transcriptomes of aneuploid cells in the context of germline GATA2 mutations, we compared gene expression of monosomy 7 cells with that of diploid cells in the sample of patient 1. Loss of chromosome 7 impacted gene expression in HSPCs (supplemental Table 8; supplemental Figure 17). Functional pathway analysis revealed that cell cycle pathways, DNA damage response pathways (DNA repair, telomere maintenance, and chromosome maintenance), and programmed cell death genes were downregulated in monosomy 7 cells, consistent with our previous report in MDS.22 However, we noted immune responses (antigen processing and presentation, BCR signaling, and TCR signaling) and hematopoiesis differentiation (IL-6 or FLT3 signaling, granulocyte-macrophage colony-stimulating factor–mediated signaling, and EPO signaling pathways) to be upregulated in monosomy 7 cells in GATA2 deficiency, and thus observed a more heterogenous signature of monosomy 7 in GATA2 deficiency than in typical MDS (supplemental Figure 18).
Trisomy 8 cells in patient 2 exhibited downregulation of cell cycle, mitosis, and programmed cell death pathways; some upregulated genes were involved in stem cell functions (AP-1, ATF-2, and IL-6 signaling), erythroid cell functions, and immune pathways (Figure 6E-F; supplemental Table 9). Overall, trisomy 8 cells in GATA2 deficiency manifested downregulated genes in cell proliferation, aberrant stemness, and lineage differentiation; additionally, a group of DNA repair genes was downregulated in trisomy 8 cells (Figure 6D). In a single patient with MDS and trisomy 8 (but no germline GATA2 mutation, data not shown), cell cycle and DNA repair genes were upregulated, whereas immune related genes were downregulated (supplemental Figure 19). This additionally suggests modification of the transcriptome by a germline GATA2 mutation.
In dissecting chromosomal changes at single-cell resolution, we observed 3 cell populations in patient 8: diploid cells, cells with der(1;7), and cells with both der(1;7) and trisomy 8. Derivation of chromosomes 1 and 7 appeared to be the initial event, preceding trisomy 8, and there were many more differentially expressed genes in cells with 3 chromosomal abnormalities than in others (supplemental Figure 20). Cells with complex cytogenetics showed upregulated metabolism and defects in hemostasis and multilineage hematopoiesis differentiation (hemoglobin chaperone, O2/CO2 exchange, granzyme, and immune system), cell cycle, and mitosis.
Discussion
A major obstacle to experiments in BM failure syndromes is the inherent paucity of cells available for study. In this study, we used scRNA-seq to characterize transcriptomes of HSPCs in GATA2 deficiency, in a comprehensive approach to gene programs in early hematopoiesis in disease, unlikely to be achieved using bulk samples containing heterogeneous cell populations.
Mechanisms responsible for the serious hematologic manifestations of GATA2 deficiency are not well understood. One hypothesis is that the combination of HSC loss and BM generative stress results in cytopenias, marrow dysplasia, and ultimately clonal evolution and malignant transformation.44 Our results suggest that GATA2 mutations modulate hematopoiesis, so that different lineages display aberrant gene programs. In particular, from the varied and unpredicted changes in immune gene expression in B cell, granulocyte/monocyte, and T cell progenitors, we observed that mutations of the same gene had variable consequences in discrete cell subsets. GATA2 mutations also reshaped gene–gene correlations, evidenced by global differences in the gene coexpression network. The overall gene correlation networks were largely shared between patients and healthy donors in hematopoietic cell differentiation, cell cycle, and cell metabolism, but there were striking differences in gene coexpression networks and in differentially coexpressed genes related to the immune response and cell cycle in GATA2 deficiency. Less diversity of cell types in GATA2 deficiency was associated with and may be causally related to constraints in gene coexpression in patients compared with healthy donors.
GATA2 is important in maintaining homeostasis of stem cells.45-47 Heterozygous knockout mice with reduced endogenous levels of Gata2 are born at normal Mendelian ratios but exhibit an ∼50% reduction in the number of adult marrow HSCs, and their Gata2+/− HSCs have reduced repopulating functionality. Gata2+/− HSCs are more quiescent and susceptible to apoptosis.45 In humans, uniformly reduced GATA2 expression is observed in patients regardless of specific mutation types,18 believed to result in haploinsufficiency and clinical manifestations. We observed defects in gene pathways (E2F and MYC targets) in HSCs that control exit from quiescence, and that impact DNA replication and repair, cell cycle, and apoptosis. A lower GATA2 gene dose may compromise the proliferation, survival, and response to regenerative stress of primitive HSCs.
We observed myeloid/lymphoid genes expression to be generally lower in HSPCs in GATA2 deficiency, whereas erythroid/megakaryocytic programs were relatively preserved. The preferential loss of myeloid/lymphoid cells in GATA2 deficiency was surprising, especially as GATA2 expression was largely absent in myeloid/lymphoid progenitors and GATA2 anticoexpressed genes were greatly enriched in the category of immune responses. We sought earlier defects in stem cells, prior to lineage specification, as the gene programs characteristic of multiple lineages are coexpressed at low levels in HSCs, and subsequently, at the commencement of differentiation, the gene program of 1 trajectory increases as expression of genes representative of other trajectories are repressed.25,40,41,48,49 Indeed, skewed immune and erythroid gene expression in the HSCs of patients was evident in the current study. We observed significantly decreased B progenitor gene expression and preserved erythroid/megakaryocytic gene expression in HSCs, suggesting intrinsic defects in early stem cells and multipotent progenitors affecting lymphoid differentiation. The apparent defect in myeloid/lymphoid lineages seen in the current study and by others15,16 may be partly ascribed to a skewed differentiation potential in HSCs. Recent findings have proposed that antagonism between PU.1 and GATA2, rather than GATA1, drives myeloid/lymphoid vs erythroid/megakaryocyte lineage commitments.23,50-52 On the erythroid/megakaryocytic trajectory, GATA2 downregulation and reciprocal GATA1 upregulation maintain cell differentiation.23,53 The lineage choice between monocytes and granulocytes appears to depend on expression levels of PU.1 and CEBPA, such that reduced expression of PU.1 is followed by an augmented granulopoiesis relative to monocyte development.42,54,55 SPI1 is downregulated in peripheral blood (PB) CD34+ cells16 and in PB mononuclear cells19 of patients with GATA2 deficiency. Consistent with these findings, we observed downregulation of SPI1 in both HSCs and GMPs in the patients’ cells. That changes in expression of SPI1 and GATA2 occurred earlier than that of GATA2 and GATA1 suggests that PU.1 and GATA2 are determinative prior to or at the initiation of lineage commitment. Downregulation of PU.1 in HSCs would thus lead to myeloid/lymphoid lineage deficiency. Neutropenia is frequent in GATA2 deficiency patients but it is less marked than monocytopenia; we were not able to discriminate between these 2 closely related differentiation pathways in our single-cell experiments. Downregulation of SPI1 in GMPs may contribute to the preferred loss of monocyte instead of granulocytes in GATA2 deficiency. However, the mechanisms of SPI1 downregulation in GATA2 deficiency remains to be elucidated.56
Monosomy 7, trisomy 8, and unbalanced aberration der(1;7) occur in GATA2-related MDS.9 We characterized transcriptomes of aneuploid cells in the setting of germline GATA2 mutations. For trisomy 8 cells, we found prominent defects in cell cycle and DNA repair, possibly rendering these cells vulnerable to second-hit somatic mutations and additional chromosomal abnormalities. Cells with complex cytogenetic abnormalities exhibited prominent defects in multilineage differentiation. Monosomy 7 and trisomy 8 cells had different transcriptome profiles in GATA2 deficiency compared with typical MDS, suggestive of (yet unknown) modification of transcriptional programs by the germline GATA2 mutations.
Our experiments and interpretation of data have limitations. First, the clinical spectrum of our cohort was necessarily limited, given the broad clinical heterogeneity of GATA2 deficiency, the rarity of the syndrome, and the cost of the experiments. In the future, if feasible, larger cohorts would be desirable. Earlier observations of weak genotype–phenotype relationships but uniformly decreased GATA2 expression and a distinct gene expression signature regardless of specific mutation18 were our justification to compare HSPCs between all patients and healthy donors regardless of mutation type, clinical phenotype, and karyotype. Indeed, there was general agreement in patterns of gene expression among our patients, and results were consistent even after removing aneuploid cells in analyses (supplemental Figure 21), suggesting that aberrant gene expression patterns reflected a common effect of GATA2 deficiency. For this pilot study, we recruited patients with dysplasia to maximize the likelihood of discovering potentially functional effects of GATA2 deficiency, but of course we were not able to distinguish earlier, more subtle influences on hematopoiesis before overt disease onset in asymptomatic individuals. For technical reasons, we focused on the transcriptome in stem and progenitor cells and did not examine late downstream changes in more mature cells. Also, due to the very low frequency of DC and NK cell progenitors within the marrow CD34+ population, efforts to define such rare cell populations were not successful. However, consistent with findings in PB,16,18 we found expression of IRF8, a regulator of DC, NK, and monocyte differentiation, lower in patients than in healthy donors. We also observed genes of NK cells and DCs57 to be less abundant in the HSPCs of patients compared with those in healthy donors (supplemental Results). The current study provides a transcriptome signature of hematopoiesis in GATA2 deficiency but limited information concerning regulatory mechanisms. With rapid advances in single-cell technologies, single-cell multiomics studies58-60 for epigenetics, genomics, transcriptomics, and proteins in future experiments might be powerfully combined for this purpose.
In summary, our single-cell analysis characterizes the transcriptome of stem and lineage progenitors in GATA2 deficiency, providing potential new insights into the mechanisms of germline GATA2 mutations in modulating early hematopoiesis. Such an approach is practical for other hematologic diseases that affect blood cell production and predispose patients to myeloid malignancies.
The data reported in this article have been deposited in the Gene Expression Omnibus database (accession number GSE135194).
Acknowledgments
The authors thank Nina Manaye (National Cancer Institute, National Institute of Health [NIH]) and Olga Rios (National Heart, Lung, and Blood Institute [NHLBI], NIH) for assistance in obtaining samples. The authors thank patients and healthy volunteers who donated BM.
Sequencing and technical support were provided by the DNA Sequencing and Genomics Core of NHLBI. FACS sorting was provided by Keyvan Keyvanfar of the hematology flow cytometry core and the NHLBI flow cytometry core. This research was supported by the Intramural Research Program of the NHLBI.
Authorship
Contribution: Z.W. designed and performed the experiments, analyzed data, and wrote the manuscript; S.G. performed bioinformatics analysis and wrote the manuscript; C.D. collected and analyzed clinical data; J.C. and R.S. performed experiments; C.P. collected samples and clinical data; S.K., A.P.H., K.R.C., D.D.H., and S.M.H. supervised data analysis and edited the manuscript; and N.S.Y. conceived, designed, and supervised the experiments, analyzed results, and edited the manuscript.
Conflict-of-interest disclosure: The authors declare no competing financial interests.
Correspondence: Zhijie Wu, Hematology Branch, National Heart, Lung, and Blood Institute, National Institutes of Health, 10 Center Dr, Bethesda, MD 20892; e-mail: zhijie.wu@nih.gov.

