

Key Points
RV and BTZ synergize to reduce immune suppression and drug resistance of MM.
BTZ triggers viral replication in the tumor microenvironment enhancing anticancer cytotoxic and immune modulatory signals.

Abstract
The oncolytic reovirus (RV) has demonstrated clinical efficacy and minimal toxicity in a variety of cancers, including multiple myeloma (MM). MM is a malignancy of plasma cells that is considered treatable but incurable because of the 90% relapse rate that is primarily from drug resistance. The systemic nature of MM and the antitumor immunosuppression by its tumor microenvironment presents an ongoing therapeutic challenge. In the present study, we demonstrate that RV synergizes with the standard-of-care MM drug bortezomib (BTZ) and, importantly, enhances its therapeutic potential in therapy-resistant human MM cell lines in vitro. Using the syngeneic Vk*MYC BTZ-resistant immunocompetent transplantable MM murine model, we also demonstrate that mice harboring BTZ-insensitive MM tumors respond to the RV/BTZ combination treatment in terms of decreased tumor burden and improved overall survival (P < .00001). We demonstrate that BTZ augments RV replication in tumor-associated endothelial cells and myeloma cells, leading to enhanced viral delivery and thereby stimulating cytokine release, immune activity, apoptosis, and reduction of the MM-associated immune suppression. We conclude that combined RV/BTZ is an attractive therapeutic strategy with no safety signals for the treatment of MM.
Introduction
Multiple myeloma (MM) is a plasma cell malignancy that is still considered incurable despite the advent of next-generation proteosome inhibitors, thalidomide analogs, and immune modulators such as elotuzumab (anti-SLAMF7 monoclonal antibody [mAb]) and daratumumab (anti-CD38 mAb).1-3 The ability of MM to evade the immune system via multiple mechanisms such as recruitment of polarized M2 macrophages, myeloid-derived suppressor cells (MDSCs), expansion of T regulatory cells (Tregs), reduced T-cell cytotoxic activity/responsiveness to interleukin-2 (IL-2), defects in B-cell immunity, and induction of dendritic cell dysfunction may be contributors to the failure in achieving durable clinical responses.4-6 Recent progress in the understanding of anticancer immune regulation and development of more efficacious immunomodulatory agents including chimeric antigen receptor-T cells and bispecific T-cell engagers has led to modest improved survival in MM patients.7-16
Reovirus (RV) is a double-stranded RNA virus with minimal pathogenicity in humans.17 RV has significant oncolytic potential against both solid and hematological malignancies,18-38 including MM, and is 1 of the few oncolytic viruses that has reached phase 3 clinical trials as a biological therapeutic.39 The mechanism of action of RV includes exploitation of activated aberrant oncogenic signaling pathways in tumor cells, thereby allowing viral RNA translation and productive oncolysis.40-42
Our previous findings have shown that RV synergizes with sunitinib (a multityrosine kinase inhibitor and immune modulator) to augment immune modulation/oncolysis via suppression of tumor-infiltrating MDSCs and Tregs while also altering cytokine profiles that favor tumor regression in a renal cell carcinoma preclinical model.43 Similarly, preclinical models also suggest that bortezomib (BTZ) sensitizes tumors to oncolysis and is associated with lymphocyte-stimulatory effects in vivo, thereby partially overcoming immunosuppressive actions of the tumor.44-51
Here, we demonstrate that RV-BTZ combination therapy can reverse myeloma-induced immune suppression. Our findings suggest RV and BTZ, in addition to their established roles in sensitizing tumor cell death, can produce T- and natural killer (NK)–cell stimulatory effects and reduce Tregs, resulting in marked tumor regression and superior overall survival (OS). These findings provide novel insights for future exploration of treatment refractory MM in clinical trials.
Methods
Human myeloma cell lines and RV
RPMI8226 cells were obtained from the American Type Culture Collection (Manassas, VA). OPM2 and KMS11 were from the German Collection of Microorganisms and Cell Cultures (Braunschweig, Germany). Cells were maintained in RPMI 1640 medium (Gibco BRL, Burlington, ON, Canada) containing 10% fetal bovine serum (FBS) for RPMI8226 and KMS11 and 12% serum for OPM2. RV serotype 3 was grown and purified, as described previously.25 BTZ was purchased from Selleck chemicals (Selleckchem, ON, Canada).
Viability and in vitro synergy assay of cell lines
In vitro synergy was performed as previously described.43 RPMI 8226 and KMS11 cells were seeded at a density of 2.5 × 10⁴ cells/well and OPM2 at 5 × 10⁴ cells/well into 96-well plates in 20 µL of medium. RV doses ranging from 1 to 480 multiplicity of infection (MOI) was next added in 10 µL medium and incubated for 45 minutes. BTZ (concentration range, 0.5-32 nM) diluted in 170 µL of medium was then added and incubated for 48 hours. Following the addition of WST-1 to represent a 10:1 ratio of medium:WST, absorbance was quantified using a BioTek plate reader (Winooski, VT). Percent viability was calculated as the absorbance ratio of treated/untreated cells × 100.
Effective dose for 50% cytotoxicity (ED50) values were generated from dose-response data using Calcusyn software (Biosoft; Great Shelford, Cambridge, United Kingdom). ED50 values for RV or BTZ were combined in various concentrations, but with consistent ratios, and percent of viability was determined. Using Calcusyn software, combination index (CI) values were generated and synergism determined per the Chou-Talalay method.52
RV progeny assays
MM cells were grown in 24-well plates and infected with ED50 values of RV or RV + BTZ and incubated up to 72 hours and frozen at −80°C. Following 3 freeze-thaw cycles, the cell supernatants were subjected to viral plaque titration on the RV-sensitive/indicator L929 cell line.22
In vivo studies
All animal experiments were performed under the Institutional Animal Care and Use Committee approval (no. AC12-0126) of University of Calgary and conformed to all regulatory standards. To confirm our in vitro findings in a preclinical model that mimics the human clinical scenario, we used the Vk*MYC syngeneic transplantable mouse model of myeloma.51,53 C57BL/6 wild-type nonirradiated mice (Charles River, Montreal, QC, Canada) were transplanted with 8 × 10⁵ BTZ-insensitive Vk12598 myeloma cells (a kind gift from L. Bergsagel) and serum paraproteins (monoclonal spike [M-spike]) were assessed weekly by high-resolution electrophoresis. Following the appearance of an M-spike ∼3 weeks posttransplantation of tumor, mice were treated as indicated in Figure 2A. Mice were euthanized after 4 days of treatment in a first experiment and their spleens and bone marrow (BM) were formalin fixed and paraffin embedded for immunohistochemistry. In a second experiment, to address the long-term immune modulatory effects and survival, mice were euthanized with the onset of morbidity as per institutional guidelines; their spleens and BM were harvested and frozen in FBS + 10% dimethyl sulfoxide for immunophenotyping. Survival was assessed until day 112.
Flow cytometry
Frozen spleen and BM cells from treated animals were thawed at 37°C and washed in RPMI medium containing 5% FBS. Approximately 2 × 10⁶ cells were stained with conjugated mAbs (supplemental Table 1). Intracellular Foxp3 staining used Mouse Foxp3 Buffer Set (BD Bioscience, San Jose, CA) per manufacturer protocol. Samples were analyzed using a Beckman Coulter XL (Mississauga, ON, Canada) and BD Accuri C6 (BD Bioscience, San Jose, CA) flow cytometers and analyzed by FCS EXPRESS and FlowJo software, version 10.0.7r2 (FlowJo Enterprise, San Jose, CA).
Viral RNA in situ hybridization
In situ hybridization of reoviral RNA was conducted according to our previously published protocols54-56 that use a 5′ digoxigenin-tagged set of 2 locked nucleic acid oligoprobes and a detection system that uses an alkaline phosphatase–conjugated digoxigenin antibody. Negative controls included myeloma cases not exposed to RV and omission of the probe; myeloma cell lines either infected or sham-infected with RV served as additional controls.
Immunohistochemistry and coexpression analysis
Serial formalin fixed and paraffin embedded sections were stained and scored for various markers shown in supplemental Table 1 per previously published protocols.54-56 Coexpression analyses were done using the Nuance system (PerkinElmer, Waltham, MA)54-56 per previously published protocols. In brief, a given tissue was tested for 2 different antigens using fast red as the chromogen for 1 target followed by immunohistochemistry using DAB (brown) as the second chromogen with hematoxylin as the counterstain. The results were then analyzed by the Nuance and InForm systems (PerkinElmer).54-56
Statistical analysis
Treatment groups were compared with each control group using a Kruskal-Wallis (K-W) rank-sum test. A significant K-W test was followed by the pairwise post hoc method of Conover57 with adjustment of family-wide error rate using Holm’s method,58 except for a priori hypotheses. Exact Wilcoxon-Mann-Whitney test with family-wide error rate control using Holm’s method within each cell line was used for planned pairwise comparisons. Bar plots with mean values ± 1 standard error of the mean or scatter plots of individual values provided graphical representations of each group. Viral progeny production postinfection and M-spike experiment data were evaluated using generalized estimating equations (GEE),59 with standard errors determined via the bootstrap. Time to event/survival curves were constructed according to the Kaplan-Meier method and compared using the log-rank test among each treatment group. Test statistics were 2-sided and adopted a significance level of .1 unless otherwise noted. Analyses were carried out with software program R (version 3.4.2).60
Results
RV replicates in human MM cell lines, leading to synergistic cytotoxicity when combined with BTZ
The productive infection and oncolytic activity of RV monotherapy against a variety of human MM cells lines, ex vivo MM specimens in in vivo animal models and phase 1 clinical trials has been demonstrated.20,21,38 However, because BTZ resistance is a significant clinical problem, we sought to examine the efficacy of combination therapy of BTZ/RV.
As depicted in Figure 1A, we used RV-resistant OPM2 cells and compared them with RV-sensitive RPMI8226 and moderately sensitive KMS11 cells. Treatment with either live RV (LV) or BTZ led to significant reductions in viability compared with dead RV (DV) control at 48 hours (P < .03; Figure 1A), and ED50:ED50 combinations (Table 1) of LV and BTZ led to significantly (P < .03) enhanced cell death in comparison with monotherapy. To assess in vitro synergy between RV and BTZ, CI values according to the Chou-Talalay method were determined.52 Treatment of cells with fixed ratios (ED50:ED50) of 1× ED50 or 2× ED50 doses of RV and BTZ revealed a synergistic response (CI ≤1) for all 3 cell lines (Table 2). At descending ED50 fixed ratio doses, both KMS11 and OPM2 demonstrated synergy, whereas RV-sensitive RPMI8226 showed antagonism.
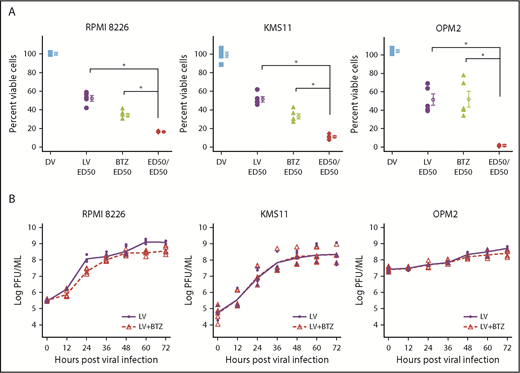
In vitro synergy of reovirus with BTZ in oncolysis of RPMI 8226, KMS11, and OPM2 human myeloma cell lines. (A) Viability of human myeloma cells following single or dual treatment. RPMI 8226, KMS11, and OPM2 cells were treated with constant ratios of ED50 values generated for reovirus (2.31, 13.25, and 63.05 MOI, respectively) and BTZ (2.8, 4.76, and 0.87 nM, respectively). Cell viability was assessed at 48 hours via the WST assay. N = 4 independent experiments. *P < .05, Conover’s test. (B) Viral progeny production in RPMI8226, KMS11, and OPM2 following treatment with LV alone or LV in combination with BTZ. Myeloma cells in 24-well plates were infected with ED50 values of LV or a combination of ED50 values of LV and BTZ (as in panel A). Samples were collected at 12-hour time points up to 72 hours; virus yields were determined by plaque titration on L929 cells and represented as log plaque-forming unit per milliliter. The linear rates of viral progeny production in the 2 groups were similar within the 3 cell lines, but the rate in the RPMI8226 cell line was nearly triple that of OPM2. N = 3, 3 independent experiments. DV accomplished through ultraviolet-inactivation.25
In vitro synergy of reovirus with BTZ in oncolysis of RPMI 8226, KMS11, and OPM2 human myeloma cell lines. (A) Viability of human myeloma cells following single or dual treatment. RPMI 8226, KMS11, and OPM2 cells were treated with constant ratios of ED50 values generated for reovirus (2.31, 13.25, and 63.05 MOI, respectively) and BTZ (2.8, 4.76, and 0.87 nM, respectively). Cell viability was assessed at 48 hours via the WST assay. N = 4 independent experiments. *P < .05, Conover’s test. (B) Viral progeny production in RPMI8226, KMS11, and OPM2 following treatment with LV alone or LV in combination with BTZ. Myeloma cells in 24-well plates were infected with ED50 values of LV or a combination of ED50 values of LV and BTZ (as in panel A). Samples were collected at 12-hour time points up to 72 hours; virus yields were determined by plaque titration on L929 cells and represented as log plaque-forming unit per milliliter. The linear rates of viral progeny production in the 2 groups were similar within the 3 cell lines, but the rate in the RPMI8226 cell line was nearly triple that of OPM2. N = 3, 3 independent experiments. DV accomplished through ultraviolet-inactivation.25
RV and BTZ combination therapy ED50 values
| Cell line | RV MOI | BTZ, nM |
|---|---|---|
| RPMI 8226 | 2.31 | 2.80 |
| KMS11 | 13.25 | 4.76 |
| OPM2 | 63.05 | 0.87 |
| Cell line | RV MOI | BTZ, nM |
|---|---|---|
| RPMI 8226 | 2.31 | 2.80 |
| KMS11 | 13.25 | 4.76 |
| OPM2 | 63.05 | 0.87 |
RV and BTZ combination therapy CI values
| Cell line | Dose 1: ED50/8 | Dose 2: ED50/4 | Dose 3: ED50/2 | Dose 4: ED50 | Dose 5: 2 × ED50 |
|---|---|---|---|---|---|
| RPMI8226 | 3.31 ± 1.69 | 2.01 ± 0.67 | 2.30 ± 0.55 | 0.70 ± 0.01 | 0.43 ± 0.01 |
| KMS11 | 0.16 ± 0.70 | 0.05 ± 0.01 | 0.06 ± 0.01 | 0.10 ± 0.01 | 0.17 ± 0.03 |
| OPM2 | 0.12 ± 0.01 | 0.20 ± 0.02 | 0.29 ± 0.02 | 0.38 ± 0.04 | 0.30 ± 0.02 |
CI values for RV and BTZ were generated using Calcusyn software. Synergism was determined per Chou-Talalay method; bold type indicates CI <1, denoting a synergistic response, CI >1 denotes an antagonistic response, and CI = 1 denotes an additive response.
Because certain drugs are known to stimulate viral replication,61 we proceeded to determine whether the synergy of combination treatment was due to augmented viral progeny production post-BTZ treatment. The 3 MM cell lines were treated with ED50 values of RV or a combination of RV + BTZ; samples were collected at varying time points between 0 and 72 hours and viral progeny determined. Viral progeny was not increased in the LV + BTZ group, suggesting that vital proliferation was not augmented by combination treatment (Figure 1B). GEE analysis indicated an overall modest reduction of mean RV log plaque-forming units of 0.37 and 0.07, respectively, over time for RPMI8226 and OPM2 with the combination treatment.
Favorable tumor microenvironment changes following combination therapy in vivo
We next investigated early events such as in situ virus replication and immunological events in an in vivo setting. The BTZ-insensitive Vk*MYC syngeneic murine model of MM is a well-established immunocompetent model for studying immunotherapies and drug effects preclinically.51,53 We used the BTZ-insensitive (Vk12598) transplantable variant to investigate whether RV + BTZ in combination has superior therapeutic outcomes and to examine whether BTZ would augment the viroimmunotherapeutic effects of RV.
Nonirradiated C57/BL6 mice bearing Vk12598 MM tumor were treated with LV or DV (IV), BTZ (intraperitoneally), or a combination of these agents along with vehicle controls (VCs) as described in “Methods” (Figure 2A). Figure 2B illustrates RV staining in splenic tissue in mice treated with LV or LV + BTZ.
![Early tumor microenvironment events following RV + BTZ combination therapy in vivo. (A) Schematic representation of treatment time line in mice. (B) To evaluate early tumor microenvironment events, mice were euthanized after 4 days of treatment; their spleens and BM were then formalin fixed and paraffin embedded. Serial sections were stained and scored for various markers (supplemental Table 1) per previously published IHC protocols.54-56 Optimal conditions were determined using various myeloma cell lines with different sensitivities infected with RV, and included a dilution of 1:1000 and a rabbit/anti-goat secondary antibody (ABCAM, 1:500 dilution). Myeloma tumor burden in the treated cohorts for Figures 2B-F and 3-5 are given in Table 3. Reoviral capsid protein was detected within myeloma cells in scattered foci in mice treated only with LV (arrows), whereas many more viral positive myeloma cells were seen in the spleen after live virus and BTZ treatment (magnification ×200 = ×10 [ocular lens] and ×20 [objective lens]). (C) LV + BTZ combination therapy leads to significantly higher RV protein production. Bar diagrams representing quantified LV RNA and protein in BM and spleen myeloma tumor. N = 3; ***P < .001, Conover’s test. (D) Splenic myeloma caspase 3 expression images of IHC sections. Note the low activated caspase-3 expression in the mice treated with the VC or DV. Foci of myeloma cells positive for caspase-3 were seen in the spleen of the mice treated with LV alone, whereas there was a diffuse and strong increase in caspase-3 expression in the mice treated with LV and BTZ (magnification ×200 = ×10 and ×20). (E) Significantly higher caspase 3 is expressed in MM tumor of LV + BTZ combination therapy. Bar diagrams representing quantified caspase 3. N = 3; ***P < .001, **P < .01, *P < .05, Conover’s test. (F) Coexpression of CD138 and caspase 3 in spleen myeloma cells. Coexpression of caspase 3 in CD138+ myeloma cells (right, fluorescent yellow) in RV + BTZ–treated spleens confirms that it is primarily myeloma cells that undergo apoptosis (magnification ×400 = ×10 and ×40). (B,D) Camera: Ventana Vias Zeiss Axio; acquisition software: Nuance. Composite figure via Adobe Photoshop CS4. PFU, plaque-forming unit; TFC, tumor-free control.](https://ash.silverchair-cdn.com/ash/content_public/journal/bloodadvances/3/5/10.1182_bloodadvances.2018025593/2/m_advances025593f2-1.png?Expires=1769101650&Signature=0VY-cbNOhhLFTpFWlfu6VzmCq5UjRWU5kTgDUUm-TnxDTPNCSUwz2jFk5n0Nq31srPWWV5k5SN1BjTqSJymzCtlpbw1D4LAw73HDNP~Jp34QJB7fi-evd6lK-WRZHtcdiKm25nPLEiqDiTM0jPG4CCFawV7dZu4wXsaTp113RyZJIvRrKjS43cDB89kLa9BIdgyiy6NFviDvjGyHpe5OGF~gVad7HHAARUkyhedtyi4-iUePKXHP9558ce9iUjVwr3wqX8~rHiWZjxgCC1uXnDsI2vnDbZeNHWEgjSUWq6TvKU1f8G8FgRW-YOJE2GuzyE4DIsV81RcFlGTsRrOzXw__&Key-Pair-Id=APKAIE5G5CRDK6RD3PGA)
![Early tumor microenvironment events following RV + BTZ combination therapy in vivo. (A) Schematic representation of treatment time line in mice. (B) To evaluate early tumor microenvironment events, mice were euthanized after 4 days of treatment; their spleens and BM were then formalin fixed and paraffin embedded. Serial sections were stained and scored for various markers (supplemental Table 1) per previously published IHC protocols.54-56 Optimal conditions were determined using various myeloma cell lines with different sensitivities infected with RV, and included a dilution of 1:1000 and a rabbit/anti-goat secondary antibody (ABCAM, 1:500 dilution). Myeloma tumor burden in the treated cohorts for Figures 2B-F and 3-5 are given in Table 3. Reoviral capsid protein was detected within myeloma cells in scattered foci in mice treated only with LV (arrows), whereas many more viral positive myeloma cells were seen in the spleen after live virus and BTZ treatment (magnification ×200 = ×10 [ocular lens] and ×20 [objective lens]). (C) LV + BTZ combination therapy leads to significantly higher RV protein production. Bar diagrams representing quantified LV RNA and protein in BM and spleen myeloma tumor. N = 3; ***P < .001, Conover’s test. (D) Splenic myeloma caspase 3 expression images of IHC sections. Note the low activated caspase-3 expression in the mice treated with the VC or DV. Foci of myeloma cells positive for caspase-3 were seen in the spleen of the mice treated with LV alone, whereas there was a diffuse and strong increase in caspase-3 expression in the mice treated with LV and BTZ (magnification ×200 = ×10 and ×20). (E) Significantly higher caspase 3 is expressed in MM tumor of LV + BTZ combination therapy. Bar diagrams representing quantified caspase 3. N = 3; ***P < .001, **P < .01, *P < .05, Conover’s test. (F) Coexpression of CD138 and caspase 3 in spleen myeloma cells. Coexpression of caspase 3 in CD138+ myeloma cells (right, fluorescent yellow) in RV + BTZ–treated spleens confirms that it is primarily myeloma cells that undergo apoptosis (magnification ×400 = ×10 and ×40). (B,D) Camera: Ventana Vias Zeiss Axio; acquisition software: Nuance. Composite figure via Adobe Photoshop CS4. PFU, plaque-forming unit; TFC, tumor-free control.](https://ash.silverchair-cdn.com/ash/content_public/journal/bloodadvances/3/5/10.1182_bloodadvances.2018025593/2/m_advances025593f2-2.png?Expires=1769101650&Signature=m5KqfZRln7iQN9qMLVyzJlQY0Tttrdfx0H4eM0Em1C6wVYc-xiRgyUfz-lOJ0nvG5A65h1xNc9R81lWsMhIaiadcdquVh732F9rTz~fGlRj2zTPJVaFj9d8PQtOYdTvNluRaLk7Sk52ts3aZNb7v3DJddjCTZjqPFom1NDczkC~n3dd1UT2CYcvg-tGf9nR2Yq8u8eLkLdQWTYkJ~ad7xdmW3ucjeMKRl01x1WvNYX6KYzBlsF5spJiFxKnL6xyEp-oAkIV1GycH2HmxKziFvoRv6uj58YpZK9c9CUeCN1T9sWrWrxtRIqhFW627L3QLVlCl4s3GO5g0RVZP7eBN7w__&Key-Pair-Id=APKAIE5G5CRDK6RD3PGA)
Early tumor microenvironment events following RV + BTZ combination therapy in vivo. (A) Schematic representation of treatment time line in mice. (B) To evaluate early tumor microenvironment events, mice were euthanized after 4 days of treatment; their spleens and BM were then formalin fixed and paraffin embedded. Serial sections were stained and scored for various markers (supplemental Table 1) per previously published IHC protocols.54-56 Optimal conditions were determined using various myeloma cell lines with different sensitivities infected with RV, and included a dilution of 1:1000 and a rabbit/anti-goat secondary antibody (ABCAM, 1:500 dilution). Myeloma tumor burden in the treated cohorts for Figures 2B-F and 3-5 are given in Table 3. Reoviral capsid protein was detected within myeloma cells in scattered foci in mice treated only with LV (arrows), whereas many more viral positive myeloma cells were seen in the spleen after live virus and BTZ treatment (magnification ×200 = ×10 [ocular lens] and ×20 [objective lens]). (C) LV + BTZ combination therapy leads to significantly higher RV protein production. Bar diagrams representing quantified LV RNA and protein in BM and spleen myeloma tumor. N = 3; ***P < .001, Conover’s test. (D) Splenic myeloma caspase 3 expression images of IHC sections. Note the low activated caspase-3 expression in the mice treated with the VC or DV. Foci of myeloma cells positive for caspase-3 were seen in the spleen of the mice treated with LV alone, whereas there was a diffuse and strong increase in caspase-3 expression in the mice treated with LV and BTZ (magnification ×200 = ×10 and ×20). (E) Significantly higher caspase 3 is expressed in MM tumor of LV + BTZ combination therapy. Bar diagrams representing quantified caspase 3. N = 3; ***P < .001, **P < .01, *P < .05, Conover’s test. (F) Coexpression of CD138 and caspase 3 in spleen myeloma cells. Coexpression of caspase 3 in CD138+ myeloma cells (right, fluorescent yellow) in RV + BTZ–treated spleens confirms that it is primarily myeloma cells that undergo apoptosis (magnification ×400 = ×10 and ×40). (B,D) Camera: Ventana Vias Zeiss Axio; acquisition software: Nuance. Composite figure via Adobe Photoshop CS4. PFU, plaque-forming unit; TFC, tumor-free control.
Early tumor microenvironment events following RV + BTZ combination therapy in vivo. (A) Schematic representation of treatment time line in mice. (B) To evaluate early tumor microenvironment events, mice were euthanized after 4 days of treatment; their spleens and BM were then formalin fixed and paraffin embedded. Serial sections were stained and scored for various markers (supplemental Table 1) per previously published IHC protocols.54-56 Optimal conditions were determined using various myeloma cell lines with different sensitivities infected with RV, and included a dilution of 1:1000 and a rabbit/anti-goat secondary antibody (ABCAM, 1:500 dilution). Myeloma tumor burden in the treated cohorts for Figures 2B-F and 3-5 are given in Table 3. Reoviral capsid protein was detected within myeloma cells in scattered foci in mice treated only with LV (arrows), whereas many more viral positive myeloma cells were seen in the spleen after live virus and BTZ treatment (magnification ×200 = ×10 [ocular lens] and ×20 [objective lens]). (C) LV + BTZ combination therapy leads to significantly higher RV protein production. Bar diagrams representing quantified LV RNA and protein in BM and spleen myeloma tumor. N = 3; ***P < .001, Conover’s test. (D) Splenic myeloma caspase 3 expression images of IHC sections. Note the low activated caspase-3 expression in the mice treated with the VC or DV. Foci of myeloma cells positive for caspase-3 were seen in the spleen of the mice treated with LV alone, whereas there was a diffuse and strong increase in caspase-3 expression in the mice treated with LV and BTZ (magnification ×200 = ×10 and ×20). (E) Significantly higher caspase 3 is expressed in MM tumor of LV + BTZ combination therapy. Bar diagrams representing quantified caspase 3. N = 3; ***P < .001, **P < .01, *P < .05, Conover’s test. (F) Coexpression of CD138 and caspase 3 in spleen myeloma cells. Coexpression of caspase 3 in CD138+ myeloma cells (right, fluorescent yellow) in RV + BTZ–treated spleens confirms that it is primarily myeloma cells that undergo apoptosis (magnification ×400 = ×10 and ×40). (B,D) Camera: Ventana Vias Zeiss Axio; acquisition software: Nuance. Composite figure via Adobe Photoshop CS4. PFU, plaque-forming unit; TFC, tumor-free control.
As depicted in Figure 2C, reoviral RNA was evident in all LV-treated mouse spleens and BM, confirming viral RNA proliferation in the Vk*MYC model as early as 4 days posttreatment. However, productive viral replication (protein) was evident in RV + BTZ–treated mice only (P < .001). We next verified whether combination treatment would also trigger tumor apoptosis. As shown in Figure 2D-F, significantly increased active caspase 3 was seen in LV + BTZ treatment in comparison with LV or BTZ treatments alone (P ≤ .03), and caspase 3 was primarily expressed in CD138+ myeloma cells. Table 3 provides the average tumor infiltrations in spleen and BM 4 days posttreatment. As expected, the tumor infiltration assessed by immunohistochemistry (IHC) was a reflection of the tumor burden (M-spike) at the onset of treatment and did not reflect decreases in numerical values at this early time point.
Myeloma tumor burden (mean M-spike) of mice at onset of treatment and percent infiltration of tumor in mouse spleen and BM 4 d posttreatment
| M-spike (SE), g/L | Spleen % tumor infiltration (SE) | BM % tumor infiltration (SE) | |
|---|---|---|---|
| VC | 6.15 (2.46) | 69.5 (1.5) | 61.5 (4.5) |
| DV | 7.33 (2.78) | 81 (5) | 65 (12) |
| DV + BTZ | 4.85 (3.65) | 50 (9) | 46.5 (5.5) |
| BTZ | 4.37 (4.27) | 41 (28) | 32 (5) |
| LV | 4.54 (3.05) | 48.5 0.5) | 48.5 (6.5) |
| LV + BTZ | 13.14 (7.38) | 57.5 (8.5) | 68.5 (8.5) |
SE, standard error.
To identify factors that trigger these early synergistic events, we examined RV capsid production in the tumor microenvironment (TME). As shown in supplemental Figure 1, RV protein expression was evident in endothelial cells surrounding the myeloma cells, as well as the MM cells themselves. Interestingly, the perivascular distribution of reoviral protein paralleled CD31 staining, indicating that BTZ stimulates reoviral replication in CD31+ endothelial cells; this suggests enhanced transport of RV to MM tumor in the combination treatment.
LV + BTZ combination therapy leads to enhanced immune stimulation
Because viroimmunotherapeutic effects have been a subject of interest with RV and cancer treatment, we next examined cytokine profiles and other immune correlates that may have been upregulated in the myeloma TME. As illustrated in Table 4, combination therapy, along with productive RV replication, significantly enhanced interferon-β (IFN-β) and IFN-γ expression, and upregulated NF-κB, a key transcription factor that drives various immune correlates such as TLR3, MHC1, and TAP1. Reflective of this enhanced immune driver expression, marked accumulation of CD3 cells were seen in the combination treatments in both BM and spleen (Figure 3).
Cytokine and immune modulatory molecule upregulation in mouse myeloma TEM following RV and BTZ combination treatment
| Sample | IFN-β, no. + MNC/×200 (SD) | IFN-γ, no. + MNC/×200 (SD) | MHC1, no. + MNC/×200 (SD) | TAP1, no. + MNC/×200 (SD) | TLR3, no. + MNC/×200 (SD) | NF-κB, no. + MNC/×200 (SD) |
|---|---|---|---|---|---|---|
| Tumor-free control spleen | 0 | 0 | 12.3 (4.4) | 2.0 (0.7) | 0 | 1.1 (0.4) |
| Vehicle control myeloma spleen | 7.1* (1.3) | 15.2 (5.5) | 19.5 (4.0) | 4.1 (1.1) | 13.5 (2.3) | 12.2 (3.3) |
| DV myeloma spleen | 4.9 (2.0) | 11.9 (5.9) | 27.4 (7.9) | 12.2 (4.7) | 20.1 (6.3) | 32.9 (6.0) |
| BTZ myeloma spleen | 15.0 (6.6) | 23.2 (8.2) | 29.0 (7.7) | 5.0 (2.8) | 34.3 (7.7) | 33.9 (5.7) |
| DV + BTZ myeloma spleen | 18.1 (5.8) | 28.9 (9.0) | 25.2 (8.2) | 15.9 (3.3) | 27.9 (9.2) | 28.9 (7.1) |
| LV myeloma spleen (low productive infection) | 14.1 (4.9) | 18.8 (4.3) | 111.9 (9.7) | 48.9 (7.7) | 109.4 (9.2) | 69.5 (5.9) |
| LV + BTZ myeloma spleen (productive infection) | 83.2 (8.95) | 76.1 (7.9) | 218.15 (17.1) | 91.3 (9.65) | 116.0 (9.25) | 76.35 (7.1) |
SD, standard deviation; MNC, mononuclear cell.
All cell counts were done at the interface of myeloma cells and normal spleen and represent the number of positive cells at ×200. N = 2, mean of 10 fields (SD).
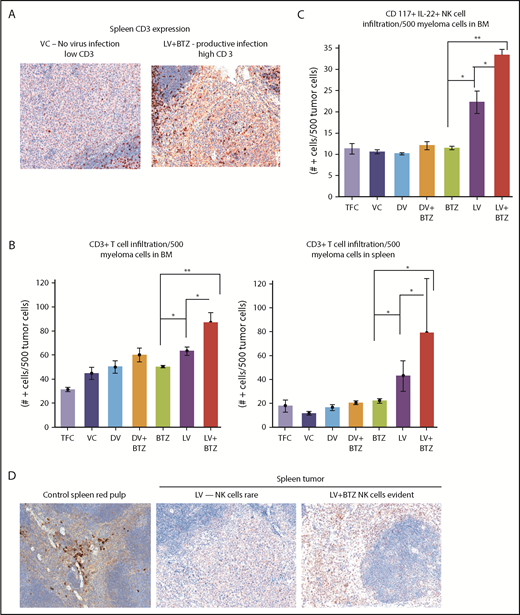
Early tumor microenvironment events indicate that RV + BTZ combination therapy leads to significantly enhanced immune activation. (A) IHC staining of CD3 in spleens of mice. Note the rare tumor associated CD3+ cells in the mice treated with the VC compared with the strong infiltration by such cells in the tumor after treatment with LV and BTZ (magnification ×200 = ×10 and ×20). (B) Bar plots representing quantified CD3+ cells in BM and spleen. N = 3; **P < .01, *P < .05, Conover’s test. (C) Bar plots representing quantified CD117+ IL22+ NK cells in BM. N = 3; **P < .01, *P < .05, Conover’s test. (D) IHC sections of mouse spleens stained for NK cells. IHC staining of CD117+ IL22+ NK cells in spleens of mice. Note the rare NK cell distribution in LV-treated spleens, robust expression of NK cells in LV + BTZ–treated spleens, and red pulp areas of mouse spleen (magnification ×200 = ×10 and ×20). (A,D) Camera: Ventana Vias Zeiss Axio; acquisition software: Nuance. Composite figure via Adobe Photoshop CS4.
Early tumor microenvironment events indicate that RV + BTZ combination therapy leads to significantly enhanced immune activation. (A) IHC staining of CD3 in spleens of mice. Note the rare tumor associated CD3+ cells in the mice treated with the VC compared with the strong infiltration by such cells in the tumor after treatment with LV and BTZ (magnification ×200 = ×10 and ×20). (B) Bar plots representing quantified CD3+ cells in BM and spleen. N = 3; **P < .01, *P < .05, Conover’s test. (C) Bar plots representing quantified CD117+ IL22+ NK cells in BM. N = 3; **P < .01, *P < .05, Conover’s test. (D) IHC sections of mouse spleens stained for NK cells. IHC staining of CD117+ IL22+ NK cells in spleens of mice. Note the rare NK cell distribution in LV-treated spleens, robust expression of NK cells in LV + BTZ–treated spleens, and red pulp areas of mouse spleen (magnification ×200 = ×10 and ×20). (A,D) Camera: Ventana Vias Zeiss Axio; acquisition software: Nuance. Composite figure via Adobe Photoshop CS4.
In addition, examination of the NK populations in the BM of mice demonstrated significantly higher (P < .01; Figure 3C) NK cells in LV + BTZ–treated animals compared with LV or BTZ monotherapy treatments. LV alone treatment tended to accumulate more (P < .02) NK cells than BTZ alone treatment. Within the spleens, NK cells were common in the red pulp areas and LV + BTZ treatments, but they were rare in the monotherapy-treated spleens (Figure 3D). Interestingly, LV monotherapy and LV + BTZ treatment significant upregulated PD-L1, PD-L2, and IDO-1 expression in myeloma cells in both the BM and spleen in comparison with BTZ treatment alone (Figure 4).
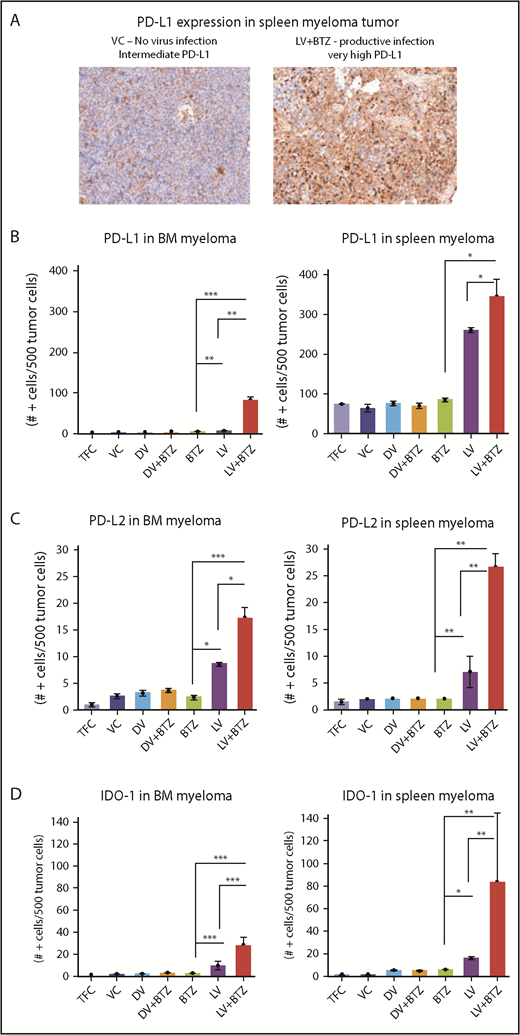
RV + BTZ combination therapy upregulates immune check point expression in MM tumor as early as 4 days posttreatment. (A) IHC staining images of spleen myeloma PD-L1 in mice. Note the rare expression of PD-L1 in the tumors of mice treated with the VC as compared with the strong expression of this checkpoint protein in the tumor after treatment with live virus and BTZ (magnification ×200 = ×10 and ×20; camera: Ventana Vias Zeiss Axio; acquisition software: Nuance; composite figure via Adobe Photoshop CS4). Bar plots representing quantified PD-L1 (B), PD-L2 (C), and IDO expression (D) in MM cells in BM and spleen. N = 3; ***P < .001, **P < .01, *P < .05, Conover’s test.
RV + BTZ combination therapy upregulates immune check point expression in MM tumor as early as 4 days posttreatment. (A) IHC staining images of spleen myeloma PD-L1 in mice. Note the rare expression of PD-L1 in the tumors of mice treated with the VC as compared with the strong expression of this checkpoint protein in the tumor after treatment with live virus and BTZ (magnification ×200 = ×10 and ×20; camera: Ventana Vias Zeiss Axio; acquisition software: Nuance; composite figure via Adobe Photoshop CS4). Bar plots representing quantified PD-L1 (B), PD-L2 (C), and IDO expression (D) in MM cells in BM and spleen. N = 3; ***P < .001, **P < .01, *P < .05, Conover’s test.
Because tumor-associated macrophages (TAMs; F4/80+/CD31+) and MDSCs (CD11b+Gr1+) may play an important role in the outcome of therapy, we also verified the number of these cells in the myeloma TME and further delineated whether the F4/80+/CD31+ macrophages were of the IL-10– or IL-12–secreting phenotypes. The number of IL-10–secreting M2-TAMs increased significantly with LV treatment in the BM TME; this was further augmented with combination treatment (P ≤ .01; Figure 5A-B). No significant differences were found in the CD11b + Gr1–expressing MDSCs between treatments (Figure 5C).
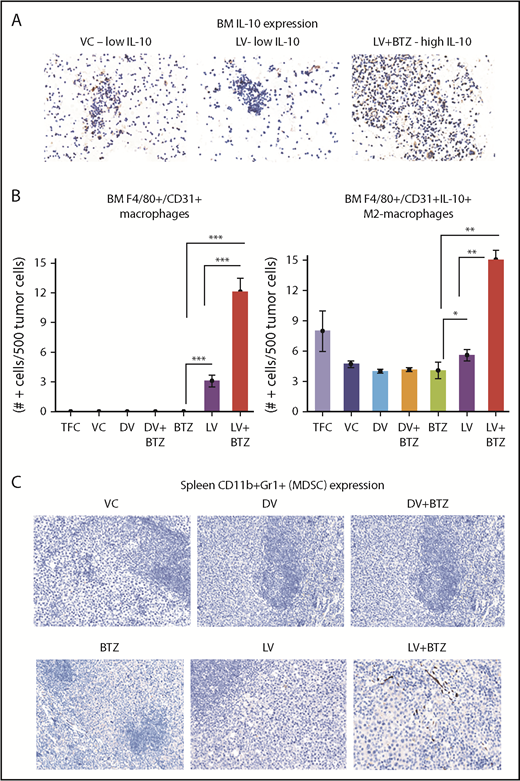
Dual treatment of RV + BTZ upregulates TME-associated M2 type macrophages in mouse BM. (A) Images depicting IHC staining for IL-10 in mouse BM. Note the low IL-10 expression in the mice treated with VC or LV alone compared with the strong expression of this cytokine in the BM after treatment with LV and BTZ (magnification ×200 = ×10 and ×20; camera: Ventana Vias Zeiss Axio; acquisition software: Nuance; composite figure via Adobe Photoshop CS4). (B) Bar plots representing quantified BM F4/80+/CD31+ macrophages (left) and IL-10–secreting M2 macrophages (right). N = 3; ***P < .001, **P < .01, *P < .05, Conover’s test. (C) Images depicting CD11b+Gr1+ (classic markers of MDSC) staining in mouse spleen TME (magnification ×200 = ×10 and ×20). At early stages (day 4) posttreatment, there is no difference in CD11b+Gr1+ MDSCs between vehicle control and the treated samples.
Dual treatment of RV + BTZ upregulates TME-associated M2 type macrophages in mouse BM. (A) Images depicting IHC staining for IL-10 in mouse BM. Note the low IL-10 expression in the mice treated with VC or LV alone compared with the strong expression of this cytokine in the BM after treatment with LV and BTZ (magnification ×200 = ×10 and ×20; camera: Ventana Vias Zeiss Axio; acquisition software: Nuance; composite figure via Adobe Photoshop CS4). (B) Bar plots representing quantified BM F4/80+/CD31+ macrophages (left) and IL-10–secreting M2 macrophages (right). N = 3; ***P < .001, **P < .01, *P < .05, Conover’s test. (C) Images depicting CD11b+Gr1+ (classic markers of MDSC) staining in mouse spleen TME (magnification ×200 = ×10 and ×20). At early stages (day 4) posttreatment, there is no difference in CD11b+Gr1+ MDSCs between vehicle control and the treated samples.
RV + BTZ combination therapy demonstrates superior therapeutic efficacy and OS
Because the majority of early TME changes following combination therapy demonstrated indications of favorable outcome, we next examined treatment efficacy over time and on OS. To evaluate changes in treatment effects over time as a contributing factor for efficacy, 2 separate GEE analyses of M-spike data were performed. The first was for observations up to week (W) 3. Because most animals in the VC and DV groups died by W4, the second analysis up to W4 was performed with missing VC values replaced by predicted values (Figure 6A, left).
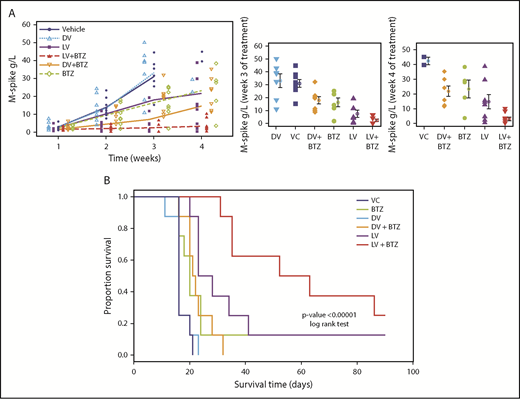
RV + BTZ treatment leads to significant reductions in MM tumor burden and superior OS. C57BL/6 wild-type recipient mice were injected with Vk12598 myeloma cells (8 × 10⁵) IV and treated per the schematic in Figure 2A. Mice were bled weekly posttreatment and serum paraprotein was evaluated via high-resolution serum electrophoresis. (A) Left: M-spike changes in mice posttreatment from week W1 through W4. GEE analysis up to W3 indicated that cohorts of LV, LV + BTZ, DV + BTZ, and BTZ were different from the VC group at W2 and W3, but not at W1 (P < .05). DV vs VC showed no differences at all time points. GEE trend analysis of W1 through W4 data also indicated treatment groups were different (P < .05) from the VC group at W2, W3, and W4, but not at W1. Center and left: Mean M-spike data at weeks 3 and 4, respectively. (B) Kaplan-Meier survival plots of mice posttreatment. P < .00001, log-rank test.
RV + BTZ treatment leads to significant reductions in MM tumor burden and superior OS. C57BL/6 wild-type recipient mice were injected with Vk12598 myeloma cells (8 × 10⁵) IV and treated per the schematic in Figure 2A. Mice were bled weekly posttreatment and serum paraprotein was evaluated via high-resolution serum electrophoresis. (A) Left: M-spike changes in mice posttreatment from week W1 through W4. GEE analysis up to W3 indicated that cohorts of LV, LV + BTZ, DV + BTZ, and BTZ were different from the VC group at W2 and W3, but not at W1 (P < .05). DV vs VC showed no differences at all time points. GEE trend analysis of W1 through W4 data also indicated treatment groups were different (P < .05) from the VC group at W2, W3, and W4, but not at W1. Center and left: Mean M-spike data at weeks 3 and 4, respectively. (B) Kaplan-Meier survival plots of mice posttreatment. P < .00001, log-rank test.
Using K-W analysis with Conover post hoc tests, we next tested whether at specific time points (ie, W3 and W4), the treatment effects would be different from the controls. As depicted in Figure 6A (center), M-spike values (indicative of MM tumor burden) of VC and DV were significantly higher than other treatments (P < .05). Although BTZ was able to reduce tumor burden, the mean M-spike was still significantly higher than LV or combination LV + BTZ treatments. At week 4, only 2 mice were left for VC and DV, with no mean differences (P = .2, results not shown), and only LV and LV + BTZ tumor burdens were significantly lower than VC (Figure 6A, right; P < .05). No significant differences were found between BTZ or DV + BTZ and VC. Although the mean M-spike of LV was lower than BTZ and DV + BTZ, no statistical differences were noted. At W4, the tumor burden of LV + BTZ subjects maintained the lowest values and was significantly lower than LV (P < .05). Taken together, these data strongly suggest that long-term treatment with LV + BTZ is more effective than single-agent treatment. As an alternative assessment of tumor burden, we compared the spleen sizes of each treatment group. As illustrated in supplemental Figure 2, the spleens of VC and DV were enlarged based on MM infiltration tumor, whereas those of LV + BTZ treatment had spleens that were equivalent to normal, tumor-free animals.
The significant reductions in tumor burden seen in combination treatment translated to superior OS as per Kaplan-Meier analysis. A highly significant OS benefit (P < .00001) was noted, with mice receiving dual therapy surviving longer (median survival, 57.5 days) than mice that received monotherapy (median survival, 16-25.5 days; Figure 6B)
RV + BTZ therapy reverses myeloma-induced immune suppression and enhances memory cell generation in vivo
Because T-cell responses are believed to be imperative for tumor immune responses, we next evaluated various T-cell subsets in the BM and spleen following long-term treatment. Consistent with a viroimmunotherapeutic effect, LV monotherapy resulted in an increased accumulation of CD8+ (P < .0001) and CD4+ (P ≤ .003) splenic tumor-infiltrating lymphocytes (TILs) compared with the VC (Figure 7A-B). Confirming previous findings, BTZ as a single agent also enhanced both CD8+ and CD4+ TILs (P < .05); however, this increase was less than that generated by LV. LV + BTZ treatment was similar to the effect of LV alone and was significantly higher than VC (P = .00), but not different from the tumor-free control. It appears that treatment of MM with either BTZ or RV leads to the restoration of TILs to that of a normal disease-free animal, but this effect is augmented by LV + BTZ treatment. Interestingly, the BM CD8+ and CD4+ TILs were higher than the TFC, but were not statistically different from the VC and other treatments, indicating that the most active immune site is the spleen (supplemental Figure 3). When the splenic T cells were further delineated for CD25 (T-cell activation marker) expression, LV + BTZ showed a significantly higher proportion of activated CD4+ and CD8+ T cells (supplemental Figure 4). Similarly, a small but higher proportion of exhausted T cells expressing PD-L1 was found in the combination treatment (supplemental Figure 5). The myeloma tumor burden of the various cohorts (assessed via M-spike) is given in Figure 7H.
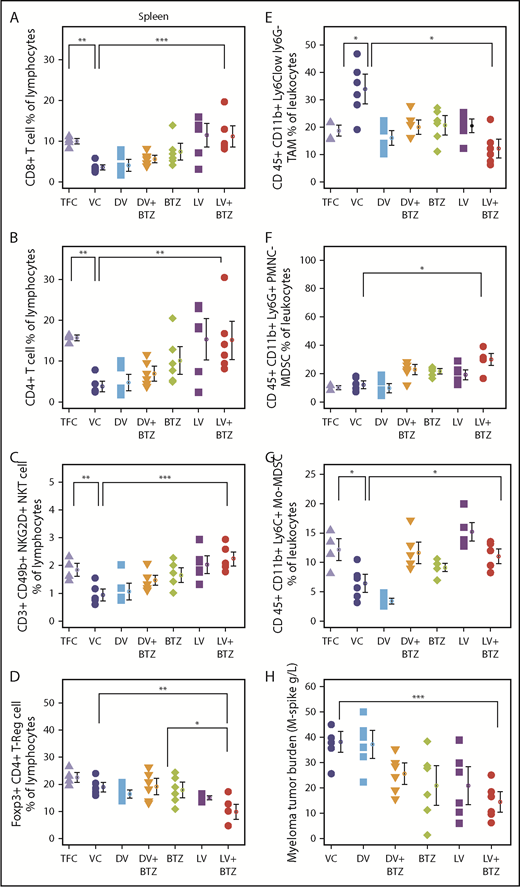
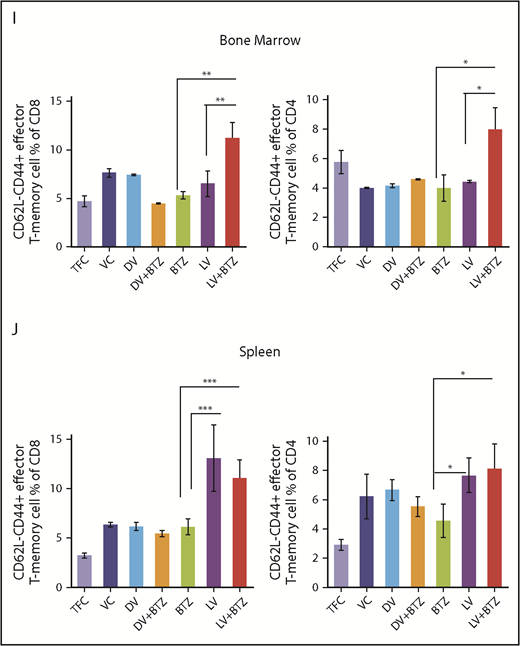
RV + BTZ treatment leads to significant immune modulation, memory cell generation, and reverses myeloma-induced immune suppression. Mouse spleens and BM of the long-term survival experiment (Figure 6B) were harvested whenever they depicted extreme morbidity. Cells were immunophenotyped for CD8+, CD4+ T cells, NKT, and Treg and T- effector memory cells. Dot plots representing CD8+ T cell (A), CD4+ T cell (B), CD3+CD49b+ NKG2D+NKT cell (C), and Foxp3+CD4+ Treg cell (D) percent of lymphocytes. N = 6; ***P < .001, **P < .01, *P < .05, Conover’s test. (E-G) Dot plots representing TAMs and MDSCs. (E) CD45+CD11b+Ly6Clow Ly6G− TAMs. (F) CD45+CD11b+Ly6G+ PMNC MDSCs. (G) CD45+CD11b+Ly6C+ monocytic origin MDSCs. N = 6; ***P < .001, **P < .01, *P < .05, Conover’s test. (H) Myeloma tumor burden of treated cohorts assessed by M-spike. N = 6; ***P < .001, **P < .01, *P < .05, Conover’s test. Bar plots depicting BM (I) and splenic (J) memory T cells analyzed by flow cytometry. N = 4; ***P < .001, **P < .01, *P < .05, Conover’s test. PMNC, polymorphonuclear.
RV + BTZ treatment leads to significant immune modulation, memory cell generation, and reverses myeloma-induced immune suppression. Mouse spleens and BM of the long-term survival experiment (Figure 6B) were harvested whenever they depicted extreme morbidity. Cells were immunophenotyped for CD8+, CD4+ T cells, NKT, and Treg and T- effector memory cells. Dot plots representing CD8+ T cell (A), CD4+ T cell (B), CD3+CD49b+ NKG2D+NKT cell (C), and Foxp3+CD4+ Treg cell (D) percent of lymphocytes. N = 6; ***P < .001, **P < .01, *P < .05, Conover’s test. (E-G) Dot plots representing TAMs and MDSCs. (E) CD45+CD11b+Ly6Clow Ly6G− TAMs. (F) CD45+CD11b+Ly6G+ PMNC MDSCs. (G) CD45+CD11b+Ly6C+ monocytic origin MDSCs. N = 6; ***P < .001, **P < .01, *P < .05, Conover’s test. (H) Myeloma tumor burden of treated cohorts assessed by M-spike. N = 6; ***P < .001, **P < .01, *P < .05, Conover’s test. Bar plots depicting BM (I) and splenic (J) memory T cells analyzed by flow cytometry. N = 4; ***P < .001, **P < .01, *P < .05, Conover’s test. PMNC, polymorphonuclear.
Because memory T cells are pivotal players in eradicating relapsed disease, we next studied BM and splenic effector memory T cells of the mice following long-term treatment. These ranged between 3% and 13.2% and, interestingly, mice that received combination therapy demonstrated higher numbers of effector memory cells (Figure 7I-J).
Immune dysfunction seen in myeloma patients may involve both innate and adaptive immune subsets; therefore, we next examined NK T-cell populations. As illustrated in Figure 7C, treatment with either BTZ or LV significantly increased activated NK T cells in spleen in comparison with VC; this effect was further enhanced by combination treatment. The NK T-cell population in the LV + BTZ–treated group was not significantly different from TFC and was reminiscent of normal, disease-free animals. In all immune subpopulations assessed, the VC and DV controls had the lowest numbers, which was reminiscent of an untreated myeloma patient.
Long-term treatment effects on immune suppressive populations indicate that RV + BTZ treatment significantly suppressed splenic Tregs in comparison with VC (P < .01) or BTZ (P < .05) (Figure 7D; supplemental Figure 3D) and significantly lowered the splenic and BM TAMs (CD 45+ CD11b+ Ly6Clow ly6G−)(Figure 7E; supplemental Figure 3E). Although splenic polymorphonuclear MDSCs (CD 45+ CD11b+ Ly6G+) were higher with dual treatment, monocytic origin MDSCs (CD 45+ CD11b+ Ly6C+) were restored to that of disease-free animals (Figure 7F-G). Taken together, these results highlight the potential of BTZ to synergistically augment RV-mediated adaptive immune responses during long-term treatment.
Discussion
Plasma cell clonal evolution and development of drug resistance is a major obstacle in the treatment of MM.62 In addition, immune regulatory networks in the myeloma TME downregulates host antitumor immune responses.15 The current study represents the first preclinical evidence that BTZ-insensitive myeloma could be rendered sensitive with RV in conjunction with low-dose BTZ, in which the augmented immunotherapeutic effects in addition to direct oncolysis leads to highly significant survival advantages.
We initially verified the effects of combination RV + BTZ in 3 human MM cell lines with variable sensitivity to RV and BTZ. Notably, ED50 values used in combination therapy led to significant synergistic (CI <1) cytolysis of all 3 cell lines. Interestingly, GEE trend analysis indicated that RV + BTZ combination treatment does not enhance virus progeny production in vitro. Previously, we had demonstrated that RV as well RV + BTZ–mediated cell death is manifested via apoptosis21,63 and autophagy.64
To recapitulate the human scenario in which patients develop BTZ insensitivity, we used the Vk*MYC BTZ-insensitive syngeneic murine MM model. Increased RV RNA expression was seen in both spleen and BM tumor in cohorts that received RV, confirming successful delivery to the TME, with the highest RV protein seen in the LV + BTZ treatment group. Coexpression analyses confirmed productive RV infection of endothelial and adjacent myeloma cells. The ability of BTZ to drive pro-angiogenic BM cells in the MM TME65 and the transient RV replication in tumor-associated endothelial cells with vascular endothelial growth factor manipulation has been reported previously for a melanoma model.66 Thus, the significant viral load seen in RV + BTZ treatments is possibly from the BTZ-driven pro-angiogenic factors that stimulate endothelial cell division and subsequent augmentation of productive RV replication and delivery to MM tumor. We also have noted that BTZ triggers upregulation of endoplasmic reticulum stress proteins in the endothelial cells in comparison with RV alone, consistent with endoplasmic reticulum stress and apoptosis in MM as previously reported.67 Therefore, such BTZ-driven apoptosis of endothelial cells may facilitate RV replication and allow targeting to myeloma tumor areas, maximizing productive replication. This in association with vascular collapse resulting from the high viral load, could further drive anti-MM events such as inadequate vasculature for MM tumor survival and concomitant augmentation of innate and adaptive immune activity in this site as observed in the melanoma model.66 Thus, this unique mechanism of BTZ-driven RV replication in the MM TME is noteworthy.
In addition to their direct cytotoxic effects on cancer cells, both RV and BTZ are known to induce immunotherapeutic effects in vivo. Although the majority of immune modulatory effects of RV seen preclinically and clinically have been encouraging, those of BTZ have been conflicting,32,33,43,68-74 suggesting that although low-dose BTZ can have positive immune modulatory effects, high-dose BTZ may be immunosuppressive.74
Analysis of early TME events demonstrated that combination treatment with productive RV replication significantly enhanced pro-inflammatory cytokine release, NF-κB activation, and TLR3, MHC1, and TAP1 expression: all events that are known to culminate in a torrent of immune activation.75 Significantly higher caspase 3 expression in MM in the combination treatment confirmed that RV + BTZ in vivo synergistic events leads to enhanced myeloma lysis with subsequent tumor (neo-) antigen release that attracts CD3 and NK-cell infiltration to these sites. Tumor upregulation of PD-L1 and PD-L2 and overexpression of MDSCs and TAMs following RV, as well as BTZ treatment, is well documented and have been proposed as prospective candidates for therapeutic intervention.43,76-81 In this study, the upregulation of M2-polarized TAMs, and the upregulation of PD-L1, PD-L2, and IDO-1 in LV- and BTZ-treated MM cells, although likely to be tumor-promoting events alone, was reversed using the combination thus negating this immunosuppression.
The primary end -point of this study using RV + BTZ combination therapy in a BTZ-insensitive MM model was to evaluate OS. In concordance with the early TME events, cohorts that received combination treatment demonstrated highly significant (P < .00001) OS compared with those with single-agent treatment. When the 3 surviving mice (1RV, 1BTZ, 1RV + BTZ) were rechallenged with Vk*MYC tumor, only the 1 with prior RV + BTZ therapy survived an additional 110 days, whereas the other 2 died within 35 days. This was consistent with the anti-MM memory T cell response generated by the combination treatment (data not presented given the nonstatistical power of this observation).
Analysis of immune subpopulations following long-term treatment indicated that CD8, CD4, NKT, and activated NK and CD8+CD25+/CD4+CD25+ cells to be statistically higher in the combination treatment mice. In addition, animals with RV + BTZ treatment exhibited significantly lower Tregs and TAMs, further suggesting that this strategy is a viable treatment option for MM.
Recent reports of PD-L1 blockade following RV or LCL161 (inhibitors of apoptosis protein-antagonists) treatment in myeloma models have shown significant enhancement in OS,51,81 and treatment of MM patient specimens with RV has shown upregulated PD-L1 expression.81 US Food and Drug Administration termination of myeloma anti-PD-1+ lenalidomide + low-dose dexamethasone clinical trials owing to severe toxicity issues advises alternative approaches.82 Our results demonstrate that RV or RV + BTZ treatment significantly upregulates the PD-L1/PD-1 axis and supplicates the exploitation of this phenomenon with anti-PD-L1/PD-1 treatment of MM with RV + BTZ combination. A recent clinical trial involving brain tumor treatment with RV has documented a similar scenario, and IFN induction by RV has been identified as the driving mechanism behind the PD-L1/PD-1 upregulation.83 As demonstrated in this study, preconditioning the TME with a targeted RV-mediated IFN stimulation and subsequent upregulation of the PD-L1/PD-1 axis with enhanced immune cell infiltration opens up avenues for efficacious checkpoint blockade.
The current study represents the first preclinical evidence in which BTZ, a frontline-approved MM agent could synergize and augment RV's immunotherapeutic efficacy in BTZ-insensitive myeloma.
For original data, contact Chandini M. Thirukkumaran (cmthiruk@ucalgary.ca).
The full-text version of this article contains a data supplement.
Acknowledgments
This work was supported by operating grants by the Cancer Research Society of Canada, Myeloma Canada Alberta Innovates Health Solutions (grants 21132 and 18222), and Oncolytics Biotech Inc (D.M. and C.M.T.).
Authorship
Contribution: C.M.T. and D.M. conceptualization the study; C.M.T., Z.Q.S., and D.M. undertook the study design; C.M.T., Z.Q.S., J.L., G.J.N., A.A.M., S.T., K.G., and A.Y. collected and analyzed data; K.A.K. and Y.D. provided statistical analysis; M.C., A.C.C., M.C.C., and P.L.B. provided reagents; C.M.T. wrote the manuscript; D.M., G.J.N., K.A.K., A.C.C., M.C., V.H.J.-Z., D.S., and C.M.T. reviewed and edited the manuscript; and C.M.T. and D.M. supervised the study.
Conflict-of-interest disclosure: M.C.C. is the chief executive officer of Oncolytics Biotech Inc. The remaining authors declare no competing financial interests.
Correspondence: Don Morris, Department of Oncology, Cumming School of Medicine, University of Calgary, 1331 29th St NW, Calgary, AB T2N4N2, Canada; e-mail: don.morris@ahs.ca.

