

Key Points
Depletion of TGF-β1 in platelets attenuates aortic stenosis progression in a new, aggressive, and robust mouse model.
Platelet-derived TGF-β1 induces signaling in VEC, thereby driving aortic stenosis progression in mice.

Abstract
Aortic stenosis (AS) is a degenerative heart condition characterized by fibrosis and narrowing of aortic valves (AV), resulting in high wall shear stress (WSS) across valves. AS is associated with high plasma levels of transforming growth factor-β1 (TGF-β1), which can be activated by WSS to induce organ fibrosis, but the cellular source of TGF-β1 is not clear. Here, we show that platelet-derived TGF-β1 plays an important role in AS progression. We first established an aggressive and robust murine model of AS, using the existing Ldlr−/−Apob100/100 (LDLR) breed of mice, and accelerated AS progression by feeding them a high-fat diet (HFD). We then captured very high resolution images of AV movement and thickness and of blood flow velocity across the AV, using a modified ultrasound imaging technique, which revealed early evidence of AS and distinguished different stages of AS progression. More than 90% of LDLR animals developed AS within 6 months of HFD. Scanning electron microscopy and whole-mount immunostaining imaging of AV identified activated platelets physically attached to valvular endothelial cells (VEC) expressing high phosphorylated Smad2 (p-Smad2). To test the contribution of platelet-derived TGF-β1 in AS, we derived LDLR mice lacking platelet TGF-β1 (TGF-β1platelet-KO-LDLR) and showed reduced AS progression and lower p-Smad2 and myofibroblasts in their AV compared with littermate controls fed the HFD for 6 months. Our data suggest that platelet-derived TGF-β1 triggers AS progression by inducing signaling in VEC, and their subsequent transformation into collagen-producing-myofibroblasts. Thus, inhibiting platelet-derived TGF-β1 might attenuate or prevent fibrotic diseases characterized by platelet activation and high WSS, such as AS.
Introduction
Aortic stenosis (AS) is a common degenerative heart disease that affects millions of people, and its prevalence is expected to rise sharply as the world’s population ages.1,2 A major hallmark of AS is increased collagen synthesis and calcification, resulting in stiffening of the valve leaflets and narrowing of valves. These changes increase wall shear stress (WSS) across the narrowed valve and subsequent pressure overload on the heart. AS cases are classified as mild, moderate, or severe on the basis of the extent of narrowing of the aortic valve (AV) orifice area (AVA) as a result of calcification, fibrosis, and changes in flow gradient (AV peak-velocity), as diagnosed by echocardiography.3,4 The estimated 5-year survival of patients with severe AS is only 15% to 50%.5 A challenge in studying AS is the lack of sufficiently robust animal models. Hyperlipidemic and atherosclerotic mutant mouse models do not adequately simulate all phases of human AS pathology, with the possible exception of LDL receptor-deficient and ApoB100-only (Ldlr−/−Apob100/100; designated as LDLR) mice.6,7
Transforming growth factor-β1 (TGF-β1) is a multifunctional cytokine involved in the pathogenesis of several fibrotic diseases, which are a common outcome of most chronic inflammatory diseases that affect almost all organs in the body and are irreversible, and for which there are no effective therapies.8,9 TGF-β1 stimulates pathological fibrosis by inducing the production of matrix proteins, particularly collagen, via canonical Smad signaling.10-13 All cells can produce and secrete TGF-β1 in a latent form, but platelets contain ∼100 times more TGF-β1 than other cell types, and also release TGF-β1 in a latent form,14 although the mechanism of latent TGF-β1 activation in vivo is not clear. We have shown that WSS can activate latent TGF-β1 released from platelets in vitro.15 We also demonstrated that platelets contribute to 40% to 50% of total circulating TGF-β1 levels, and that mice with targeted deletion of TGF-β1 in their megakaryocytes and platelets are partially protected from developing cardiac hypertrophy, fibrosis, and systolic dysfunction in a surgically-induced pressure overload transverse aortic constriction model that simulates high WSS.16 Platelets can also be activated by WSS,17 suggesting that conditions that generate WSS, such as AS, may activate platelets to release latent TGF-β1, which can subsequently be activated by WSS.
Elevated systemic TGF-β1 is observed in AS,18 and AS progression is associated with increased plasma levels of TGF-β1 in mice.19 Because platelets are the major source of plasma TGF-β1, and platelet activation is observed in AS,19-23 we hypothesized that platelet-released TGF-β1 may directly contribute to AS progression. To study AS progression, we first established an aggressive and robust mouse model (LDLR) that enhances spontaneous AS progression and high WSS across AV. To test the specific role of platelet-derived TGF-β1 in AS progression, we generated LDLR mice with platelet-specific depletion of Tgfb1 (TGF-β1platelet-KO-LDLR). Using a modified method of echocardiography, we studied AS progression in mice and identified a novel mechanism that shows activated platelets are physically attached to valvular endothelial cells, inducing Smad2 signaling and subsequent collagen production, a hallmark of AS.
Methods
Detailed methods and materials are found in the supplemental Data.
Mice
Hypercholesterolemic mice deficient for low-density lipoprotein receptors (Ldlr−/−), which express ApoB-100 (Ldlr−/−Apob100/100) only, designated as LDLR, were obtained from Jackson Laboratories (B6;129S-Ldlrtm1HerApobtm2Sgy/J, stock no. 003000) and bred in-house. WT C57BL/6 mice were also obtained from the Jackson Laboratory (stock no. 000664) and served as controls. TGF-β1platelet-KO-LDLR mice (Pf4Cre;Tgfb1flox/flox;Ldlr−/−Apob100/100) and TGF-β1flox-LDLR littermate controls (Tgfb1flox/flox;Ldlr−/−Apob100/100) were generated by crossing LDLR mice with Pf4Cre;Tgfb1flox/flox mice (see breeding and crossing strategy in supplemental Figure 1A-B; supplemental Table 1). Genotyping and sequencing of megakaryocyte genomic DNA shows that Tgfb1 is inverted in Pf4Cre;Tgfb1flox/flox animals, and depletion of TGF-β1 in platelets was confirmed by enzyme-linked immunosorbent assay (ELISA) and immunoblotting with TGF-β1-specific antibodies.
Experimental design
LDLR, TGF-β1platelet-KO-LDLR, TGF-β1flox-LDLR littermate controls, and WT C57BL/6 mice (both males and females) were used for this study. All mice were fed the high-fat diet (HFD) and maintained for up to 6 months, or as indicated in the respective figures and legends. Echocardiography ultrasound images were obtained at the indicated timepoints (see detailed experimental plans, supplemental Figure 2), and AS progression and severity (mild/moderate/severe) were monitored by our modified-view echocardiography ultrasound imaging techniques (supplemental Figure 3), using Vevo-2100.
Echocardiography
Ultrasound echocardiography imaging was performed in Isoflurane-anesthetized (1%-3% inhalation) mice at indicated timepoints (supplemental Figure 2). To ensure accuracy of all measurements, physiological parameters were monitored and recordings were only taken if the heart rate was 450 to 550 beats per minute and respiration was 50 to 100 breaths per minute. Consistent heart rate is imperative for accurate heart function evaluation, and body temperature significantly affects heart rate.24,25
Echocardiography is the gold standard noninvasive method to measure AS in humans. However, the mouse heart rate is 10 times faster (500-600 beats per minute), making the acquisition of high-resolution images of the very thin nondiseased valves challenging. Thus, using B-mode imaging with a Vevo 2100 MS550D transducer (VisualSonics, Toronto, Canada), we established an angle that resulted in very clear images of aortic valve leaflets, left ventricular outflow tract (LVOT), and peak blood flow velocity across the valve. LVOT was measured from the long-axis view and was used to normalize the cusp separation (supplemental Figure 3A). This view was obtained by tilting the lower left corner of the platform downward by about 30° and angling the transducer up such that it interfaced with the chest cavity by about 45°. A good parasternal long axis view is defined as having clearly defined left ventricle walls and a continuous left ventricle from the aortic root to the apex of the heart. Moreover, it should lie completely horizontal in the visual plane, and the right ventricle should be clearly seen on top of the left ventricle. LVOT is the measured diameter of the location where the left ventricle meets the aorta, as illustrated in supplemental Figure 3B.
For clear images of aortic valve cusps, an aortic arch view was obtained after a modified method, as described by Pistner et al.26 This was achieved by angling the right side of the platform as far downward as possible. The transducer was oriented so that it interfaced with the left side of the mouse’s body at approximately 45°, and was rotated so that it ran parallel with the length of the mouse’s body. Moving the transducer medially across the chest brings the valve into view to visualize both leaflets rapidly opening and closing (supplemental Figure 3C). If there was visual interference by the lung, the transducer was oriented at a shallower angle. Slight rotation of the transducer was sometimes necessary to bring both aortic valve leaflets into view. After visualization of the aortic valves (supplemental Figure 3D), high-quality videos and images were captured using an ECG-Gated Kilohertz Visualization mode, which captures video with up to 10 000 frames per second, in which the 2 leaflets can clearly be seen opening and closing (supplemental Video 1). The distance between the 2 cusps when the valve is fully open during systole, defined as cusp separation, was measured (supplemental Figure 3D) and then normalized over the LVOT diameter (supplemental Figure 3B), which is important in that it accounts for varying LVOT sizes in individual mice, a measure defined as fractional valve opening. We also used an improved method to measure peak blood flow velocity across the valves (jet) with a combination of color and pulse-wave Doppler that allows alignment along the maximum flow direction (supplemental Figure 3E). In this mode, red defines blood flowing from the left ventricle to the aorta. The area in the middle where the color changes from red to blue is known as aliasing, indicating the point at which the blood flow rate is highest (supplemental Figure 3E). AV peak velocity (jet) is defined as the speed at which the blood flows across the AV at systole, and is measured by placing a pulse-wave Doppler probe where the flow aliases and angling the probe so that it runs parallel with the flow. LVOT peak velocity was also measured from the aortic arch view, using color and pulse-wave Doppler. The peak AV velocity was measured and used to calculate WSS, using the formula in supplemental Figure 3F. AVA is the gold standard to determine AS severity in humans and is measured directly using planimetry, and indirectly via continuity equation.27 We compared our AS parameters (fractional valve opening, peak velocity, and calculated WSS) with AVA (calculated using the continuity equation and planimetry) in LDLR mice and found a strong correlation (data not shown). Our echocardiography method directly measures both the area and velocity and is relatively easy to perform even in mice with 10 times faster heartbeats.
One limitation of the Vevo2100 system is that it uses pulse-wave instead of continuous-wave Doppler, used in clinical ultrasounds. However, because the pulse repetition frequency of the high-frequency pulse-wave Doppler probe MS550D (32 mHz) used in the Vevo2100 System is much higher than clinical systems, it can measure high velocity up to a maximum 3000 mm/s, which is much higher than we measured in mice with severe AS.
Statistics
All data are expressed as means, with error bars representing the standard error of the mean (SEM). Statistical calculations were performed using GraphPad Prism and SAS. Significance of differences was calculated by nonparametric Student t test and Welch’s correction was used where appropriate, such as when comparing differences between 2 groups with different sample sizes. Significance of differences between multiple groups was calculated using 2-way ANOVA with Tukey’s correction. χ2 test was used to compare significance of differences between different timepoints with Fisher’s exact test to calculate P values. P < .05 was considered significant.
Results
A robust mouse model of aortic stenosis simulates human AS pathology
We developed a new improved mouse model to investigate the role of platelet-derived TGF-β1 in AS progression based on LDL receptor-deficient and ApoB100-only (Ldlr−/−Apob100/100; designated as LDLR) mice6 that spontaneously develop AS at very old ages, at least partially simulating human disease progression. AS progression in LDLR mice can be exacerbated by feeding them a Western diet,28 but only 30% to 50% of the mice develop severe AS.6 Thus, this model lacks sufficient robustness to detect AS progression at early stages.
To establish a mouse model that more precisely simulates human AS, we fed LDLR and control C57BL/6 (WT) mice a HFD containing sixfold higher cholesterol than the Western diet, commencing at 6 weeks of age for up to 6 months (supplemental Figure 2), and found that LDLR mice fed the HFD had higher plasma cholesterol levels than WT mice receiving the HFD (supplemental Figure 5). Using our new ultrasound method (supplemental Figure 3), we found that almost all (>90%) LDLR mice developed moderate to severe aortic stenosis 6 months after HFD, whereas WT mice on HFD did not (Figure 1A), as measured by lower fraction of valve opening, higher peak velocity, and WSS in the former (Figure 1A).
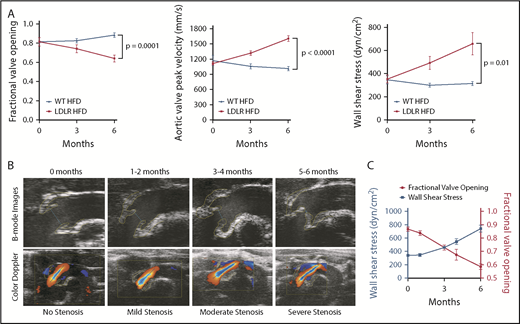
Development of aortic stenosis in LDLR mice. (A) Stenosis parameters (fractional valve opening, WSS, and AV peak velocity) in LDLR mice on HFD (n = 10-48) and WT mice on HFD (n = 5-13) at 0, 3, and 6 months after initiation of HFD, as measured by echocardiography. (B, top) Ultrasound images of AV from LDLR mice at indicated time on HFD. (B, bottom) Ultrasound B-mode images with color Doppler of blood flow through aortic valves in LDLR mice at indicated timepoints. Yellow lines outline the aortic valves and blue lines indicate cusp separation at systole. Black line represents the Doppler line in the color Doppler images. (C) Fractional valve opening (right y-axis) and wall shear stress (left y-axis) in LDLR mice fed HFD at indicated timepoints (n = 7-31). Two-tailed unpaired Student t test with Welch’s correction was used to compare 2 groups with different sample sizes. Data represented as mean ± SEM throughout.
Development of aortic stenosis in LDLR mice. (A) Stenosis parameters (fractional valve opening, WSS, and AV peak velocity) in LDLR mice on HFD (n = 10-48) and WT mice on HFD (n = 5-13) at 0, 3, and 6 months after initiation of HFD, as measured by echocardiography. (B, top) Ultrasound images of AV from LDLR mice at indicated time on HFD. (B, bottom) Ultrasound B-mode images with color Doppler of blood flow through aortic valves in LDLR mice at indicated timepoints. Yellow lines outline the aortic valves and blue lines indicate cusp separation at systole. Black line represents the Doppler line in the color Doppler images. (C) Fractional valve opening (right y-axis) and wall shear stress (left y-axis) in LDLR mice fed HFD at indicated timepoints (n = 7-31). Two-tailed unpaired Student t test with Welch’s correction was used to compare 2 groups with different sample sizes. Data represented as mean ± SEM throughout.
Our new echocardiography ultrasound imaging method resulted in high-resolution images that captured early evidence, and with subtle differences in valve stenosis, an improvement over earlier models and methods,6,29,30 we are now able to demonstrate different stages of AS progression in mice (Figure 1B). LDLR mice on HFD gradually developed AS in a time-dependent manner, mild at 1 to 2 months, moderate at 3 to 4 months, and severe by 5 to 6 months (Figure 1B-C; supplemental Table 2). We observed reduced valve cusp separation distances (blue line between cusps in upper panels, Figure 1B) and increased AV peak velocity measured by a combination of color and pulse-wave Doppler (red and blue aliases become longer as AS progresses; lower panels, Figure 1B).
LDLR mice on HFD also displayed thickened aortic valve leaflets and increased total valve area (thickness) compared with WT mice on HFD, as revealed by histology and a new, modified ultrasound imaging technique (Figure 2A-B; the values obtained by histology and ultrasound significantly correlated, Figure 2C). Supplemental Video 1 shows that aortic valve leaflets fully opened and closed in WT (supplemental Video 1A), but the thickened leaflets of LDLR mice (supplemental Video 1B) only opened to one third the normal size, showing clear images of valve leaflet thickening and functional impairment after 6 months of HFD. Excessive collagen accumulation in the aortic valve is a hallmark of AS, and we indeed observed higher collagen levels in the aortic valves of LDLR vs WT mice on HFD, as measured by 2 independent methods, immunohistochemistry and picrosirius red staining (Figure 2D-E; the values obtained by the 2 methods significantly correlated, Figure 2F).
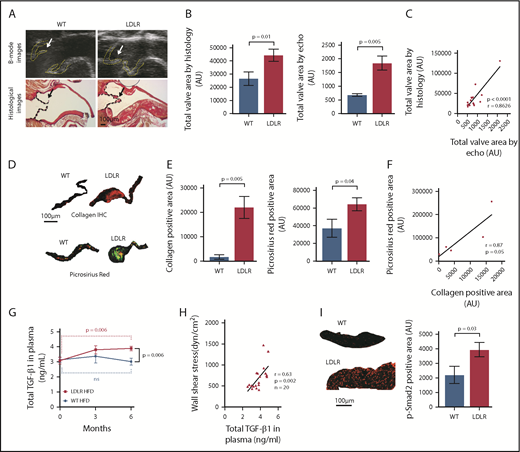
A robust and aggressive mouse model of aortic stenosis. (A) Ultrasound B-mode images (upper panels) and histological pictures (lower panels) of aortic valves in WT and LDLR mice on HFD. Yellow lines and black lines outline the AVs; arrows indicate AV leaflets. (B) Total valve area measured from echocardiographic images (n = 14 WT; n = 9 LDLR) and from histological images (n = 14 WT; n = 19 LDLR) of AV from mice at 6 months on HFD. (C) Pearson correlation of AV areas measured from echocardiography and histology (r = 0.8626; P < .0001; n = 16). (D-E) Immunohistochemistry for α-1 type I collagen (n = 4 WT; n = 5 LDLR) and picrosirius red staining for collagen (n = 8 WT; n = 17 LDLR) in AV from WT and LDLR mice after 6 months on HFD. Quantification of collagen staining in the valves by immunohistochemical (left) and picrosirius red (right) staining. (F) Pearson correlation of collagen positive area measured from immunohistochemical and picrosirius red-stained images of AV in LDLR mice after 6 months on HFD (r = 0.87; P = .055; n = 5). (G) Total TGF-β1 levels in the plasma of LDLR and WT mice at 0, 3, and 6 months on HFD, as measured by ELISA. (H) Pearson correlation of WSS across aortic valves and plasma TGF-β1 levels in LDLR mice at 6 months on HFD (r = 0.63; P = .002; n = 20). (I) Representative images of immunofluorescent staining for p-Smad2 in aortic valves from WT and LDLR mice after 6 months on HFD and quantification of p-Smad2–positive nuclei in the aortic valves of WT (n = 5) and LDLR (n = 10) mice after 6 months of HFD (see supplemental Figure 6 for individual valves with p-Smad2 staining). Two-tailed unpaired Student t test with Welch’s correction was used to compare 2 groups with different sample sizes. Data represented as mean ± SEM throughout.
A robust and aggressive mouse model of aortic stenosis. (A) Ultrasound B-mode images (upper panels) and histological pictures (lower panels) of aortic valves in WT and LDLR mice on HFD. Yellow lines and black lines outline the AVs; arrows indicate AV leaflets. (B) Total valve area measured from echocardiographic images (n = 14 WT; n = 9 LDLR) and from histological images (n = 14 WT; n = 19 LDLR) of AV from mice at 6 months on HFD. (C) Pearson correlation of AV areas measured from echocardiography and histology (r = 0.8626; P < .0001; n = 16). (D-E) Immunohistochemistry for α-1 type I collagen (n = 4 WT; n = 5 LDLR) and picrosirius red staining for collagen (n = 8 WT; n = 17 LDLR) in AV from WT and LDLR mice after 6 months on HFD. Quantification of collagen staining in the valves by immunohistochemical (left) and picrosirius red (right) staining. (F) Pearson correlation of collagen positive area measured from immunohistochemical and picrosirius red-stained images of AV in LDLR mice after 6 months on HFD (r = 0.87; P = .055; n = 5). (G) Total TGF-β1 levels in the plasma of LDLR and WT mice at 0, 3, and 6 months on HFD, as measured by ELISA. (H) Pearson correlation of WSS across aortic valves and plasma TGF-β1 levels in LDLR mice at 6 months on HFD (r = 0.63; P = .002; n = 20). (I) Representative images of immunofluorescent staining for p-Smad2 in aortic valves from WT and LDLR mice after 6 months on HFD and quantification of p-Smad2–positive nuclei in the aortic valves of WT (n = 5) and LDLR (n = 10) mice after 6 months of HFD (see supplemental Figure 6 for individual valves with p-Smad2 staining). Two-tailed unpaired Student t test with Welch’s correction was used to compare 2 groups with different sample sizes. Data represented as mean ± SEM throughout.
We found that LDLR mice on HFD had significantly higher plasma TGF-β1 levels than WT mice, which directly correlated with WSS (Figure 2G-H), indicating that platelet activation by high WSS might be responsible for the elevated plasma TGF-β1 levels, consistent with our ex vivo platelet release of TGF-β1 by WSS.31 Compared with WT mice on HFD, LDLR mice on the HFD also displayed higher p-Smad2 (Figure2I; supplemental Figure 6A). Increased WSS and total TGF-β1 correlated with higher p-Smad2 (supplemental Figure 6B-C), indicating that shear activates platelet TGF-β1, which then induces p-Smad2 signaling in valvular cells. Calcification of aortic valves is another hallmark of AS in humans, but calcification in LDLR mice is controversial.30 We stained for evidence of such calcification using both Alizarin red and Von Kossa, but did not detect any significant calcification in AV of WT or LDLR mice fed HFD for 6 months (supplemental Figure 7); these data are consistent with previous results showing very little or no calcification in LDLR mice.29 As a positive control, we observed calcium staining in the atherosclerotic plaques in the ascending aortas of LDLR mice fed HFD (supplemental Figure 7), showing that our staining procedures worked in the areas where there is calcification.
Thus, we have established a robust mouse model of AS (which simulates human pathology, valvular fibrosis, narrowing of AV, and high peak velocity) that can be used for mechanistic analyses and preclinical drug testing.
Activated platelets are physically associated with valvular endothelial cells
We imaged whole-mount aortic valves of LDLR mice fed the HFD. Unexpectedly, this analysis revealed that activated platelets co-expressing CD41 and CD62P surrounded valvular nucleated cells (Figure 3A, upper panels). SEM imaging of the same whole-mount valve used for immunostaining confirmed that activated platelets were physically attached to the surface of the valvular cells (Figure 3A; supplemental Figure 8; arrows indicate platelets, which were also pseudo colored as yellow in the higher magnification). Fewer platelets were observed in WT vs LDLR mice valves 6 months after HFD (Figure 3B).
![Figure 3. Platelets are associated with valvular cells. (A) Whole-mount confocal staining (CD41 [green], CD62P [red], and 4′,6-diamidino-2-phenylindole [DAPI; blue]; upper-left and upper-middle panels) for activated platelets and corresponding SEM (valve surface) images of the same area (lower-left and lower-middle panels) in LDLR mice 6 months after HFD. Yellow arrows indicate activated platelets. High-magnification whole-mount staining (upper-right panel) and SEM (lower-right panel) images of aortic valve (from LDLR mice fed with HFD) show activated platelets are physically attached to valvular cells (yellow and green arrows). (B) Representative SEM images of aortic valve leaflets from WT and LDLR mice 6 months after HFD showing fewer activated platelets in WT than LDLR valves, indicated by yellow arrows (smaller platelet aggregates) and blue arrows (larger platelet aggregates). Quantification of the total number of platelet aggregates on the surface of valve leaflets in WT (n = 5) or LDLR (n = 6) mice analyzed after 6 months of HFD. Two-tailed unpaired Student t test was used to compare the 2 groups. Data represented as mean ± SEM throughout.](https://ash.silverchair-cdn.com/ash/content_public/journal/bloodadvances/3/5/10.1182_bloodadvances.2018025817/2/m_advances025817f3.png?Expires=1767754229&Signature=goCBM7da8~GfopK7jRI5HCvUWePe6m7ILz5JZ-pKukIYqjOXpRuTY7tynkUC93FR18fVj8rXhCC-FX~hdyWuvG4zFBWXOsNLkJHJ9P62vdhTZKCS5rinmnS8LeAd-ybbaoDNWy92lR2jtnjubkTFRwngcwoa8nOChTRKYAc-ch8WquXlp--8bHG2jq2TmccKIE98thr3njMMr11xV6cuo2w9Dq7Sq~fUZQoDffl~eVZlczQaXu3MxD9Hf7f53B~rrxFO~MQQTicIF5Xhwc2WlrDzgbZTOqkl5vbCqH1cI4Vn~hVBMwwCDuPMjLQOHCan8pQsxBdOx-c5TDda~L3zJA__&Key-Pair-Id=APKAIE5G5CRDK6RD3PGA)
Platelets are associated with valvular cells. (A) Whole-mount confocal staining (CD41 [green], CD62P [red], and 4′,6-diamidino-2-phenylindole [DAPI; blue]; upper-left and upper-middle panels) for activated platelets and corresponding SEM (valve surface) images of the same area (lower-left and lower-middle panels) in LDLR mice 6 months after HFD. Yellow arrows indicate activated platelets. High-magnification whole-mount staining (upper-right panel) and SEM (lower-right panel) images of aortic valve (from LDLR mice fed with HFD) show activated platelets are physically attached to valvular cells (yellow and green arrows). (B) Representative SEM images of aortic valve leaflets from WT and LDLR mice 6 months after HFD showing fewer activated platelets in WT than LDLR valves, indicated by yellow arrows (smaller platelet aggregates) and blue arrows (larger platelet aggregates). Quantification of the total number of platelet aggregates on the surface of valve leaflets in WT (n = 5) or LDLR (n = 6) mice analyzed after 6 months of HFD. Two-tailed unpaired Student t test was used to compare the 2 groups. Data represented as mean ± SEM throughout.
Platelets are associated with valvular cells. (A) Whole-mount confocal staining (CD41 [green], CD62P [red], and 4′,6-diamidino-2-phenylindole [DAPI; blue]; upper-left and upper-middle panels) for activated platelets and corresponding SEM (valve surface) images of the same area (lower-left and lower-middle panels) in LDLR mice 6 months after HFD. Yellow arrows indicate activated platelets. High-magnification whole-mount staining (upper-right panel) and SEM (lower-right panel) images of aortic valve (from LDLR mice fed with HFD) show activated platelets are physically attached to valvular cells (yellow and green arrows). (B) Representative SEM images of aortic valve leaflets from WT and LDLR mice 6 months after HFD showing fewer activated platelets in WT than LDLR valves, indicated by yellow arrows (smaller platelet aggregates) and blue arrows (larger platelet aggregates). Quantification of the total number of platelet aggregates on the surface of valve leaflets in WT (n = 5) or LDLR (n = 6) mice analyzed after 6 months of HFD. Two-tailed unpaired Student t test was used to compare the 2 groups. Data represented as mean ± SEM throughout.
Platelet-derived TGF-β1 promotes AS progression
On the basis of our previous findings that platelet-derived TGF-β1 contributes to cardiac fibrosis in a surgically-induced transverse aorta constriction model,16 and on the association of elevated circulating TGF-β1 levels in LDLR mice,19 we hypothesized that platelet TGF-β1 may directly promote AS progression.
To definitively assess the role of platelet-derived TGF-β1 in AS progression, we specifically depleted TGF-β1 levels in megakaryocytes/platelets by crossing Ldlr−/−Apob100/100 mice with Pf4CreTgfb1flox/flox mice to generate Pf4CreTgfb1flox/flox;Ldlr−/−Apob100/100 mice, designated TGF-β1platelet-KO-LDLR, and their littermate controls Tgfb1flox/flox;Ldlr−/−Apob100/100, designated TGF-β1flox-LDLR. Sequencing and genotyping showed that the Tgfb1flox allele was inverted in TGF-β1platelet-KO-LDLR, which resulted in more than 80% lower levels of platelet TGF-β1 and more than 40% lower plasma TGF-β1 than TGF-β1flox-LDLR control mice (Figure 4A). These mice have normal platelet functions, as no differences in platelet aggregation with thrombin and ADP were observed compared with control mice (data not shown), suggesting that platelet TGF-β1 does not contribute to platelet functions. Both TGF-β1platelet-KO-LDLR (553 ± 176; n = 19) and TGF-β1flox-LDLR (635 ± 220; n = 9) mice have higher cholesterol 6 months after HFD (P = .34). Mixed-genotype mice (Pf4Cre mice heterozygous for Ldlr−/+ or WT for Apobwt/wt) on HFD displayed similar fractional valve opening as WT C57BL/6 mice on HFD (supplemental Figure 9A), indicating that they did not develop AS, as expected. Mixed-genotype mice also exhibited lower plasma cholesterol levels compared with both TGF-β1platelet-KO-LDLR and TGF-β1flox-LDLR mice (supplemental Figure 9B), showing that both alleles of Ldlr- are required to maintain high plasma levels of cholesterol, as expected.
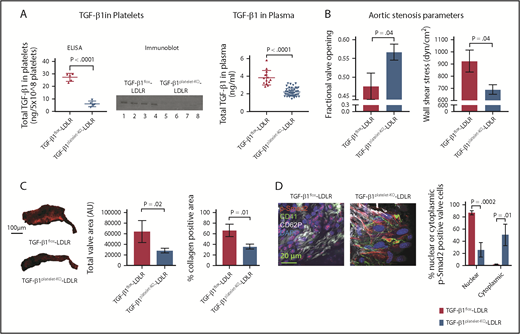
Platelet TGF-β1 contributes to AS progression. (A) ELISA and immunoblot for total platelet TGF-β1 (left and middle panel) in TGF-β1platelet-KO-LDLR mice (n = 5) and TGF-β1flox-LDLR controls (n = 5). Immunoblot with anti-TGF-β1 antibody showing 25 kD TGF-β1 bands (lanes 1, 2, 3, and 4 represent platelet releasates from TGF-β1flox-LDLR controls, and lanes 5, 6, 7, and 8 represent platelet releasates from TGF-β1platelet-KO-LDLR mice). Equal number of platelets (5 × 10⁸) were used to prepare platelet releasates from each mouse. Total plasma TGF-β1 (right panel) in TGF-β1platelet-KO-LDLR mice (n = 45) and TGF-β1flox-LDLR controls (n = 14). (B) AS parameters: fractional valve opening and WSS in TGF-β1platelet-KO- LDLR mice (n = 15) and TGF-β1flox-LDLR controls (n = 7) at 6 months on HFD, as measured by echocardiography. (C) Representative images (left panel) of α-1 type I collagen stained aortic valves from TGF-β1platelet-KO- LDLR mice and TGF-β1flox-LDLR control mice after 6 months on HFD. Quantification of total valve area (middle panel) and collagen-positive area (right panel) in aortic valves of TGF-β1platelet-KO- LDLR mice (n = 4) and TGF-β1flox-LDLR controls (n = 4) at 6 months on HFD from immunohistochemical staining images. (D) Whole-mount confocal (maximum intensity projection) images showing activated platelets adjacent to valvular cells in a TGF-β1platelet-KO-LDLR mouse and a TGF-β1flox-LDLR control. Images also show intracellular p-Smad2 localization in the valvular cells. Whole-mount staining done for CD41 (green), CD62P (gray), p-Smad2 (red), and DAPI (blue). Quantification of nuclear or cytoplasmic p-Smad2 in aortic valves of TGF-β1platelet-KO-LDLR and littermate TGF-β1flox-LDLR control mice at 6 months on HFD (right panel). Two-tailed unpaired Student t test with Welch’s correction was used to compare 2 groups with different sample sizes. Data represented as mean ± SEM throughout.
Platelet TGF-β1 contributes to AS progression. (A) ELISA and immunoblot for total platelet TGF-β1 (left and middle panel) in TGF-β1platelet-KO-LDLR mice (n = 5) and TGF-β1flox-LDLR controls (n = 5). Immunoblot with anti-TGF-β1 antibody showing 25 kD TGF-β1 bands (lanes 1, 2, 3, and 4 represent platelet releasates from TGF-β1flox-LDLR controls, and lanes 5, 6, 7, and 8 represent platelet releasates from TGF-β1platelet-KO-LDLR mice). Equal number of platelets (5 × 10⁸) were used to prepare platelet releasates from each mouse. Total plasma TGF-β1 (right panel) in TGF-β1platelet-KO-LDLR mice (n = 45) and TGF-β1flox-LDLR controls (n = 14). (B) AS parameters: fractional valve opening and WSS in TGF-β1platelet-KO- LDLR mice (n = 15) and TGF-β1flox-LDLR controls (n = 7) at 6 months on HFD, as measured by echocardiography. (C) Representative images (left panel) of α-1 type I collagen stained aortic valves from TGF-β1platelet-KO- LDLR mice and TGF-β1flox-LDLR control mice after 6 months on HFD. Quantification of total valve area (middle panel) and collagen-positive area (right panel) in aortic valves of TGF-β1platelet-KO- LDLR mice (n = 4) and TGF-β1flox-LDLR controls (n = 4) at 6 months on HFD from immunohistochemical staining images. (D) Whole-mount confocal (maximum intensity projection) images showing activated platelets adjacent to valvular cells in a TGF-β1platelet-KO-LDLR mouse and a TGF-β1flox-LDLR control. Images also show intracellular p-Smad2 localization in the valvular cells. Whole-mount staining done for CD41 (green), CD62P (gray), p-Smad2 (red), and DAPI (blue). Quantification of nuclear or cytoplasmic p-Smad2 in aortic valves of TGF-β1platelet-KO-LDLR and littermate TGF-β1flox-LDLR control mice at 6 months on HFD (right panel). Two-tailed unpaired Student t test with Welch’s correction was used to compare 2 groups with different sample sizes. Data represented as mean ± SEM throughout.
Importantly, we found that TGF-β1platelet-KO-LDLR mice fed the HFD were protected from developing AS, as shown by improved fractional valve opening and WSS compared with TGF-β1flox-LDLR controls 6 months after HFD (Figure 4B). Histological and immunohistochemistry analyses showed reduced aortic valve thickening and collagen deposition in TGF-β1platelet-KO-LDLR mice compared with TGF-β1flox-LDLR controls after 6 months on HFD (Figure 4C; supplemental Figure 10A). Activated platelets coexpressing CD41 and CD62P were adjacent to p-Smad2–positive valvular cells in both TGF-β1platelet-KO-LDLR and TGF-β1flox-LDLR littermate control mice, but p-Smad2 was primarily expressed in the cytoplasm of valvular cells in TGF-β1platelet-KO-LDLR mice, and p-Smad2 staining was much higher and primarily expressed in nuclei of valvular cells in TGF-β1flox-LDLR mice (Figure 4D; supplemental Figure 10B-C; supplemental Video 2A-B). These data suggest that activated platelet-derived TGF-β1 stimulated p-Smad2 signaling in valvular cells in LDLR mice.
Because persistent severe AS results in the deterioration of heart function, we evaluated heart function parameters and found that LDLR mice on the HFD exhibited significantly reduced systolic heart function compared with WT mice fed the HFD for 6 months (supplemental Figure 9C). The heart function of LDLR mice further deteriorated after 10 months of HFD, whereas TGF-β1platelet-KO-LDLR mice were partially protected from heart function deterioration even after 12 months on HFD (supplemental Figure 9C). No difference in heart function was observed between mixed genotypes and WT mice fed the HFD for 6 months (supplemental Figure 9C). Similar to WT, mixed-genotype mice did not develop AS (supplemental Figure 9A). These data are consistent with our previous results that platelet TGF-β1 contributes to cardiac dysfunction in a high shear pressure overload model.16
Higher p-Smad2 signaling, myofibroblasts are observed in LDLR and littermate controls than in TGF-β1platelet-KO-LDLR and WT mice
To determine how platelet-derived TGF-β1 triggers AS progression and induces collagen synthesis in aortic valves, we performed multicolor immunofluorescence staining of valves to monitor phenotypic transformations and TGF-β signaling. Although WT mice fed HFD displayed uniform expression of the mesenchymal marker, vimentin, in aortic valves, LDLR mice fed the HFD showed a subset of cells expressing higher levels of vimentin at the tip of the aortic valve facing the aorta (Figure 5A). These high vimentin-expressing cells also expressed p-Smad2 and α-SMA (Figure 5B-C). In contrast, valves from WT mice fed the HFD either did not express these markers or expressed them with much less intensity than LDLR mice. We also stained valves from LDLR and WT mice on HFD with isolectinB4, which stains valvular endothelial cells (VEC) on the surface of the AV, and found that the WT valve expressed isolectinB4 uniformly in the VEC lining, whereas isolectinB4 cells in the LDLR valve migrated toward the inner layers of the valve (Figure 5D).
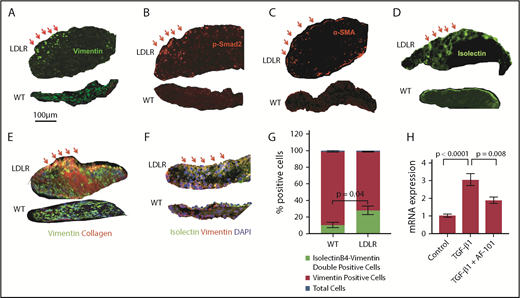
VEC undergo mesenchymal transition. Aortic valve sections from WT and LDLR mice fed with HFD for 6 months were stained with vimentin (A), p-Smad2 (B), α-SMA (C), isolectinB4 (D), and α-1 type I collagen (E); nuclei were stained with DAPI (blue). Red arrows indicate a subset of cells expressing high levels of these markers in LDLR mice, but not WT. (F) Valve sections from WT and LDLR mice fed with HFD for 6 months were stained with vimentin and isolectinB4. (G) Quantification of double-positive (isolectinB4+vimentin), vimentin-positive cells, and total nucleated cells by counting DAPI. (H) Real-time polymerase chain reaction for Col1α1 in human umbilical vein endothelial cells stimulated with platelet-derived TGF-β1 for 3 hours, with or without anti-TGF-β1 antibody (AF-101-NA).
VEC undergo mesenchymal transition. Aortic valve sections from WT and LDLR mice fed with HFD for 6 months were stained with vimentin (A), p-Smad2 (B), α-SMA (C), isolectinB4 (D), and α-1 type I collagen (E); nuclei were stained with DAPI (blue). Red arrows indicate a subset of cells expressing high levels of these markers in LDLR mice, but not WT. (F) Valve sections from WT and LDLR mice fed with HFD for 6 months were stained with vimentin and isolectinB4. (G) Quantification of double-positive (isolectinB4+vimentin), vimentin-positive cells, and total nucleated cells by counting DAPI. (H) Real-time polymerase chain reaction for Col1α1 in human umbilical vein endothelial cells stimulated with platelet-derived TGF-β1 for 3 hours, with or without anti-TGF-β1 antibody (AF-101-NA).
Aortic valves in LDLR mice also displayed a dramatic increase in collagen expression around vimentin-positive cells compared with WT mice fed the HFD, and a subset of collagen-expressing cells were localized with vimentin-expressing cells (Figure 5E). Aortic valves from LDLR mice on HFD displayed higher numbers of isolectinB4 and vimentin double-positive cells with no change in total vimentin single-positive cells or total nucleated cells (blue DAPI-stained nuclei between WT and LDLR mice fed with HFD for 6 months; Figure 5F-G). Other myofibroblast/fibroblast markers, including PR2D3, TE7, and ER-TR7, were also higher in LDLR mice than in WT mice on HFD (supplemental Figure 11A).
To test whether endothelial cells can produce collagen by TGF-β1 signaling, we stimulated cultured primary endothelial cells with the platelet-derived, activated form of TGF-β1. We observed an almost threefold increase in collagen synthesis that could be blocked by an anti-TGF-β1 neutralizing antibody (Figure 5H). Moreover, primary endothelial cells stimulated with the activated form of platelet TGF-β1 displayed increased α-SMA and vimentin expression (supplemental Figure 11B).
We then stained whole-mount valves and observed higher numbers of cells expressing isolectinB4, vimentin, and α-SMA in TGF-β1flox-LDLR mice on HFD, whereas far fewer cells with colocalization of these markers were observed in the valves of TGF-β1platelet-KO-LDLR mice on HFD (Figure 6A-B; supplemental Figure 12). Quantification of α-SMA–positive areas showed lower levels in TGF-β1platelet-KO-LDLR compared with their littermate controls (Figure 6B).
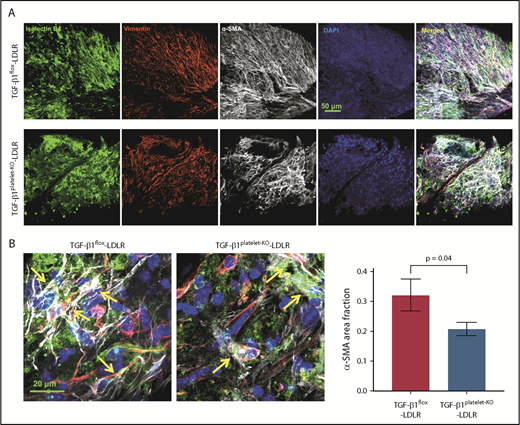
Platelet TGF-β1 contributes to VEC-mesenchymal transition. (A) Whole-mount aortic valve staining with isolectinB4 (green), vimentin (red), α-SMA (gray), and DAPI (blue) in littermate TGF-β1flox-LDLR control mice (top) and TGF-β1platelet-KO-LDLR mice (lower) at 6 months on HFD. (B) Higher-magnification images showing colocalization (yellow arrows) of isolectinB4, vimentin, and α-SMA in aortic valves from the 2 groups of mice. Quantification of α-SMA–positive area fraction in whole-mount images of aortic valves from TGF-β1flox-LDLR control mice and TGF-β1platelet-KO-LDLR mice after 6 months on HFD (right).
Platelet TGF-β1 contributes to VEC-mesenchymal transition. (A) Whole-mount aortic valve staining with isolectinB4 (green), vimentin (red), α-SMA (gray), and DAPI (blue) in littermate TGF-β1flox-LDLR control mice (top) and TGF-β1platelet-KO-LDLR mice (lower) at 6 months on HFD. (B) Higher-magnification images showing colocalization (yellow arrows) of isolectinB4, vimentin, and α-SMA in aortic valves from the 2 groups of mice. Quantification of α-SMA–positive area fraction in whole-mount images of aortic valves from TGF-β1flox-LDLR control mice and TGF-β1platelet-KO-LDLR mice after 6 months on HFD (right).
Taken together, these data suggest that platelet-derived TGF-β1-mediated signaling in VEC can trigger their transformation into collagen-producing myofibroblasts, causing AS progression.
Discussion
Our work shows that platelet-derived TGF-β1 directly contributes to AS progression in a robust mouse model of AS that simulates human pathology, including narrowing of AV, causing high WSS, and that genetically depleting TGF-β1 mainly in megakaryocytes/platelets halts AS progression.
We modified and improved an ultrasound imaging technique that, in combination with color and pulse-wave Doppler techniques, allowed us to accurately measure fractional valve opening and peak blood flow velocity gradients across the AV. These improved methods represent the first such usage in mice and captured high-resolution images of AV, yielding accurate, consistent, and reproducible data that defined AS severity in mice commensurate with the human classification (mild, moderate, and severe). Our data reconcile a significant body of previously published findings, including improvements in the robustness of the AS phenotype from 30% to more than 90% in LDLR mice. We believe this difference might partly be a result of underestimation of AS parameters using previous methods and low-resolution images.6,29
Although the AVA is the gold standard to determine AS severity in humans, it is measured indirectly, using continuity equation. We compared our AS parameters (fractional valve opening, peak velocity, and calculated WSS) with calculated AVA in our LDLR mice and found a strong correlation (data not shown), indicating that our more direct and accurate measurement methods can be adapted in humans relatively easily. Moreover, our robust method and model should be valuable in analyzing subtle differences in AS severity between genetic groups, and for future preclinical evaluation of drugs.
Our study shows that activated platelets surround VEC and stimulate p-Smad2 signaling in aortic valves of LDLR mice, suggesting that TGF-β1 is released from platelets locally and is probably activated by high WSS or oscillatory shear, a hallmark of AS progression. These data support a new concept that local TGF-β1 release from platelets exerts a more potent signaling effect on VEC than systemic TGF-β1. While this manuscript was under review, Bouchareb et al20 reported that activated platelets promote osteogenic program in calcific aortic valve stenosis, which complements our results showing activated platelets are physically associated with VEC driving AS pathology. Endothelial cell-to-mesenchymal transition has been shown to play a key role in the development of cardiac valves during embryogenesis,32-35 but whether a similar phenomenon occurs in adult valve pathology is not known. Our data reveal a novel mechanism in which a subset of VEC, apparently surrounded by activated platelets in the region that senses turbulent/oscillatory shear,36,37 migrates inwards, undergoing VEC-to-mesenchymal transition and giving rise to collagen-producing myofibroblasts, thus contributing to AS. Although the origin of myofibroblasts (alternatively, excessive collagen-producing cells) is controversial, the role of other cell types, such as valvular interstitial cells, recently identified CD45-positive cells in mitral valve pathogenesis,38,39 and/or specialized stem cells (not yet discovered in valves), as well as inflammatory cells, cannot be ruled out. To our knowledge, there has been no in vivo study to date showing this possible mechanism in AS.
Our study is clinically significant because plasma TGF-β1 levels in patients with severe AS have been reported by Villar et al to be increased before valve replacement, and slightly decreased after valve replacement.18 However, the basal plasma TGF-β1 levels in healthy volunteers reported by Villar et al are much higher than recent values reported in healthy controls or patients with heart failure implanted with left ventricular assist devices.31 The higher levels observed in controls by Villar et al could be a result of in vitro platelet activation during blood drawing and plasma preparation, and we have shown that appropriate precautions are indeed required to ensure accurate measurement of plasma TGF-β1 levels.31 Although total latent TGF-β1 was measured in patients with AS, the levels of active TGF-β1 remain unknown because the current assay is not sensitive enough to measure low levels of active TGF-β1 in plasma. Future work should be directed at elucidating the levels of active TGF-β1 and signaling in patients with AS, which will require more sensitive assays, appropriate quality controls, and collection of plasma by methods that do not activate platelets,31 as well as serial (longitudinal) blood collection from patients with AS before and after valve replacement surgery. Platelets from TGF-β1platelet-KO-LDLR mice were activated equally well as those from WT mice (data not shown), suggesting that platelet TGF-β1 does not contribute to platelet activation, but the role of other factors released from platelets in AS cannot be ruled out.
Alternative models such as pressure overload by transverse aortic constriction or ascending aortic constriction are needed to confirm our study, but they also have limitations, as they require surgery, which would activate platelets to release uncontrolled TGF-β1. However, they could be used to investigate the proposed mechanism, as these models induce complex shear of both steady and oscillatory shear stress in the aortic root, distal and proximal to the banding, which may affect the areas of the valve that face the aorta, where activated platelets were observed.
It will be important to achieve and verify localized inhibition of platelet-derived TGF-β1 and signaling at VEC in AS. This could be accomplished via compounds that partially inhibit the activation of latent TGF-β1 (released from platelets), or potentially via pharmacological or genetic inhibition of TGF-β receptors or SMAD signaling within VEC themselves. The use of long-term antiplatelet agents in mice is limited because of bleeding, as the IIbIIIa antibody, even at low doses, resulted in bleeding and death in mice.16 Another possibility is blocking TGF-β1, but pan-TGF-β antibody trials in many fibrotic diseases have proven discouraging, perhaps because of its regulatory role in immune functions.40,41 Our preliminary data with N-acetylcysteine shows halting AS progression from moderate to severe stage in LDLR mice fed HFD (R.V., B.M., S.W., and J.A., manuscript in preparation), indicating a potential therapeutic strategy, as it appears to specifically block WSS-induced TGF-β1 activation.15 Thus, future experiments should be designed to block the surge in TGF-β1 release and subsequent activation and signaling to prevent AS. Although our model is highly effective in studies of fibrosis through transition of VECs to collagen-producing myofibroblasts, leading to fibrosis, AV narrowing, and WSS, all major hallmarks of human AS, it has not proven to be as useful in studying calcification, which involves valvular interstitial cells and could be the topic of future studies with other mouse models, such as the hypercholesterolemia and diabetic model, and using more sensitive staining methods for calcium.29,42
Our study supports the need for analysis of longitudinal studies in patients with AS, particularly those receiving antiplatelet agents. From a clinical point of view, our robust method and AS model should be considered for use in preclinical evaluation of future pharmacological agents to attenuate or prevent AS progression.
The full-text version of this article contains a data supplement.
Acknowledgments
The authors thank all members of the Cardiovascular Biology Research Program at Oklahoma Medical Research Foundation (OMRF) for sharing reagents, equipment, and for their valuable comments and suggestions; K. Kouzbari for performing ELISA; B. Flower for confocal imaging in OMRF Core Facility; S. Tummala for critical Vet evaluation; M. West for mouse colony maintenance; M. Julio for statistical assistance; X. Geng and Oklahoma State University Core Facility for SEM assistance; and M. Occhipinti, K. Tessneer, and A. Andersen (Life Science Editors) for editorial assistance. The authors thank J. Laurence for his valuable comments and suggestions. The authors also thank A. Needles, L. Hughes, and N. Sacadura of Fujifilm-VisualSonics, Inc for their kind assistance with ultrasound questions and software.
This work was supported by grants from the National Institutes of Health, National Heart, Lung, and Blood Institute (R01HL123605 to J.A.), National Institute of General Medical Sciences (GM114731; US4GM104938), and National Cancer Institute (R01CA213987).
Authorship
Contribution: R.V. and B.M. performed the experiments and prepared figures and drafted the manuscript; S.W., S.G., and T.R. performed select experiments; S.C. performed select statistical analyses; and J.A. conceived the idea, designed the experiment, supervised the project, and wrote the manuscript.
Conflict-of-interest disclosure: The authors declare no competing financial interests.
Correspondence: Jasimuddin Ahamed, Cardiovascular Biology Research Program, Oklahoma Medical Research Foundation, 825 NE 13th St, Oklahoma City, OK 73104; e-mail: ahamedj@omrf.org.

