

Key Points
Newly diagnosed myeloma patients with high-risk disease are more likely to achieve early response.
Rapid or late achievement of VGPR or better with first-line treatment does not affect long-term survival outcomes.

Abstract
We evaluated the impact of achieving a rapid response in 840 newly diagnosed multiple myeloma patients from 2004 to 2015. Rates of very good partial response (VGPR) or better were 29% (240/840) after 2 cycles of treatment, 42% (350/840) after 4 cycles of treatment, and 66% (552/840) as best response. Early responders after 2 cycles of treatment had higher rates of light chain disease, anemia, renal failure, International Staging System (ISS) stage III disease, and high-risk cytogenetics, especially t(4;14), and were more likely to have received triplet therapy and undergo transplant. Median progression-free survival (PFS) and overall survival (OS) were not different among patients with ≥VGPR and <VGPR after 2 cycles (PFS, 28 vs 30 months, P = .6; OS, 78 vs 96 months, P = .1) and 4 cycles (PFS, 31 vs 29 months; OS, 89 vs 91 months, P = .9), although both were improved, with ≥VGPR as best response (PFS, 33 vs 22 months, P < .001; OS, 102 vs 77 months, P = .003). On multivariate analysis stratified by transplant status, achievement of ≥VGPR after 2 cycles was not associated with improved PFS (hazard ratio [95% confidence interval]; transplant cohort, 1.1 [0.7-1.6]; nontransplant cohort, 1.2 [0.8-1.7]) or OS (transplant cohort, 1.6 [0.9-2.9]; nontransplant cohort, 1.5 [1.0-2.4]). Covariates in the model included high-risk cytogenetics, ISS stage III, triplet therapy, creatinine ≥2 mg/dL, light chain disease, and age. Although patients with high-risk disease are more likely to achieve early response, a rapid achievement of a deep response by itself does not affect long-term outcomes.
Introduction
Recent years have seen an improvement in survival for patients with multiple myeloma (MM), which is attributable to the development of new myeloma-directed drugs, autologous stem cell transplant, and combination treatment approaches.1-3 However, survival outcomes still remain heterogeneous across patients, and, various factors, including disease biology, treatment, response, and patient-related factors, can impact prognosis. Response to first-line treatment is 1 of the most important prognostic factors associated with progression-free survival (PFS) and overall survival (OS) in patients with newly diagnosed MM (NDMM).4-6 Several studies have shown that achieving a complete response (CR) or a very good partial response (VGPR) is associated with improved survival, and this is an important milestone in the treatment of patients with MM.7-9 Moreover, data in recent years have shown that eradication of any minimal residual disease results in further improvement in survival among patients achieving a CR or VGPR.4,10 Although the relationship between the depth of best response and survival outcomes is well established, the results of studies evaluating the impact of the rapidity of response on long-term outcomes have been conflicting.
Prica et al found that achievement of a partial response (PR) or better by cycle 2 of steroid-based induction did not improve PFS (20.7 vs 20.0 months; P = .24) or OS (64.4 vs 51.3 months; P = .13).11 On the other hand, 2 studies reported that a decrease in monoclonal protein of ≥50% after the first cycle of vincristine-doxorubicin-dexamethasone and of ≥30% after the first cycle of melphalan-prednisone were associated with a survival advantage.12,13 On the contrary, an Arkansas study evaluated 301 patients enrolled into their tandem autologous stem cell transplant (ASCT) Total Therapy III trial and found that OS was inferior among patients with the top-tertile reduction in serum-free light chain compared with the rest of the patients when the response was measured before cycle 2 (2-year OS, 81% vs 91%; hazard ratio [HR], 2.97; P = .003) and before ASCT (2-year OS, 79% vs 92%; HR, 3.31; P = .001).14
The objective of our retrospective study was to evaluate the prognostic impact of the kinetics of response with first-line treatment in patients with NDMM.
Patients and methods
We retrospectively evaluated 2705 consecutive NDMM patients seen at Mayo Clinic within 90 days of diagnosis between January 2004 and December 2015 and included patients in whom the following response data were available: after 2 and 4 cycles of first-line therapy and overall best response. The Institutional Review Board approved this study, and all patients had previously provided consent for review of their medical records for research purposes. Hematologic response assessment was carried out per the International Myeloma Working Group consensus response criteria.4 Early response was defined as achieving VGPR or better after 2 and 4 cycles of treatment (separate analyses). Patients who achieved VGPR or better were compared with those who did not achieve VGPR. VGPR was selected as the end point, because determination of a CR requires a bone marrow biopsy, which is not done frequently in clinical practice for response assessment. High-risk cytogenetics was defined as the presence of ≥1 of the following abnormalities on fluorescent in situ hybridization (FISH): deletion 17p/monosomy 17, t(4;14), or t(14;16).
Categorical variables were compared using the Fisher’s exact test, whereas continuous variables were compared using the Wilcoxon rank-sum test. OS was estimated from the start of first-line treatment until death or last follow-up. PFS was estimated from the start of first-line treatment to disease progression or death or last follow-up. Survival analysis was performed using the Kaplan-Meier method, and differences were tested using the log-rank test. Multivariate analyses for survival were performed using the Cox proportional hazards model. All reported P values were 2 sided at the 5% significance level. HRs with 95% confidence intervals (CIs) are reported. Data were analyzed with JMP version 14 (SAS Inc., Cary, NC). Survival outcomes were compared for patients who achieved a VGPR or better compared with those who did not. In addition, because this study was conducted over a long time period, we evaluated survival outcomes based on the time period of diagnosis for patients with NDMM. Patients diagnosed from 2004 to 2009 were compared with those diagnosed from 2010 to 2015.
Results
Of the 2705 consecutive NDMM patients seen at Mayo Clinic between January 2004 and December 2015, response assessment data after 2 and 4 cycles of treatment and overall response were available for 840 patients (study cohort). Rates of VGPR or better were as follows: 29% (240/840) after 2 cycles, 42% (350/840) after 4 cycles, and 66% (552/840) as overall best response. Only 4% (10/240) of patients who achieved VGPR/CR at the end of cycle 2 lost their response at the end of cycle 4. On the other hand, 20% (120/600) of patients who did not achieve VGPR/CR after 2 cycles had achieved VGPR/CR by the end of cycle 4.
The baseline characteristics and treatment details of patients with ≥VGPR and <VGPR after 2 cycles of first-line treatment are described in Table 1. Overall, early responders (≥VGPR after 2 cycles) were observed to have higher rates of light chain–only disease (44% vs 20%, P < .001), anemia (36% vs 28%, P = .04), renal insufficiency (21% vs 9%, P < .001), hypercalcemia (10% vs 5%, P = .03), and high-risk cytogenetics (28% vs 19%, P = .03; specifically t(4;14): 13% vs 7%, P = .02) and were more likely to have International Staging System (ISS) stage III disease (39% vs 27%, P = .002). Patients who achieved early VGPR after 2 cycles of therapy were also more likely to have received a triplet regimen (62% vs 41%, P < .001) or a proteasome inhibitor–based regimen (66% vs 36%, P < .001). They were also more likely to receive ASCT as part of first-line treatment (52% vs 41%, P < .001)
Baseline characteristics of patients with ≥VGPR and <VGPR after 2 cycles of first-line treatment
| Baseline characteristics | ≥VGPR after 2 cycles (N = 240) | <VGPR after 2 cycles (N = 600) | P |
|---|---|---|---|
| Age, median (range), y | 63 (27-90) | 64 (28-92) | .6 |
| Age ≥70 y, n (%) | 59 (25) | 171 (29) | .3 |
| Males, n (%) | 152 (63) | 334 (56) | .04 |
| Light chain disease, n (%) | 105 (44) | 118 (20) | <.001 |
| ISS stage III | 69/175 (39) | 119/445 (27) | .002 |
| Hemoglobin <10 g/dL | 81/229 (36) | 152/547 (28) | .04 |
| Creatinine ≥2 mg/dL | 48/226 (21) | 48/539 (9) | <.001 |
| Calcium ≥11 mg/dL | 21/219 (10) | 27/533 (5) | .03 |
| β2 microglobulin >5.5 μg/mL | 76/202 (38) | 133/463 (29) | .02 |
| Albumin ≤3.5 g/dL | 113/192 (59) | 252/520 (49) | .01 |
| Lactate dehydrogenase >222 U | 27/166 (16) | 59/445 (13) | .4 |
| BMPCs ≥50% | 129/231 (56) | 282/541 (52) | .3 |
| PCLI ≥1% | 50/101 (50) | 125/296 (42) | .2 |
| FISH | |||
| Trisomies | 75/165 (46) | 288/454 (63) | <.001 |
| 17p deletion/monosomy 17 | 18/165 (11) | 50/454 (11) | .97 |
| t(4;14) | 22/165 (13) | 32/454 (7) | .02 |
| t(14;16) | 8/165 (5) | 21/454 (5) | .9 |
| High-risk FISH | 46/165 (28) | 88/454 (19) | .03 |
| First-line treatment, n (%) | |||
| Doublet/triplet/other | 77/149/14 (32/62/6) | 299/247/54 (50/41/9) | <.001 |
| PI-based therapy | 158 (66) | 213 (36) | <.001 |
| ASCT in first-line therapy | 131 (55) | 280 (47) | .03 |
Unless otherwise noted, all data are n/N (%). Bold type indicates P < .05.
BMPCs, bone marrow plasma cells; PCLI, plasma cell labeling index; PI, proteasome inhibitor.
Survival outcomes
The median follow-up for the entire cohort was 71 months (95% CI, 67-79) from the start of first-line treatment. Survival outcomes for OS and PFS based on achievement of VGPR or better response after 2 and 4 cycles of treatment and as overall response are shown in Table 2 and Figure 1. There was no statistically significant difference in PFS for patients who achieved ≥VGPR vs <VGPR after completing 2 cycles (median, 28 vs 30 months, P = .6) and 4 cycles (31 vs 29 months, P = .1) of treatment. Patients who achieved VGPR or better as overall best response had significantly better PFS (33 vs 22 months, P < .001; Figure 1A-C). Similarly, there was no difference in OS based on early achievement of VGPR vs not after 2 cycles (median, 78 vs 96 months; P = .1) and 4 cycles (median, 89 vs 91 months; P = .9) of therapy. However, OS was significantly superior in patients who achieved VGPR or better as overall best response compared with those who did not (median, 102 vs 77 months, P = .003; Figure 1D-F). Interestingly, as described above, patients with early VGPR after 2 cycles had a nonstatistically significant lower OS but no difference in PFS.
Survival outcomes for PFS and OS based on response (≥VGPR vs <VGPR)
| Patients, n (%) | PFS, median | OS, median | |
|---|---|---|---|
| Entire cohort (N = 840) | |||
| ≥VGPR after 2 cycles | 240 (29) | 28 vs 30, P = .6 | 78 vs 96, P = .1 |
| ≥VGPR after 4 cycles | 350 (42) | 31 vs 29, P = .1 | 89 vs 91, P = .9 |
| ≥VGPR, best response | 552 (66) | 33 vs 22, P < .001 | 102 vs 77, P = .003 |
| Intact monoclonal protein cohort (n = 616) | |||
| ≥VGPR after 2 cycles | 134 (22) | 27 vs 31, P = .3 | 71 vs 97, P = .008 |
| ≥VGPR after 4 cycles | 215 (35) | 32 vs 30, P = .4 | 96 vs 92, P = .6 |
| ≥VGPR, best response | 368 (60) | 34 vs 23, P < .001 | 103 vs 77, P = .03 |
| Light chain evaluable cohort (n = 223) | |||
| ≥VGPR after 2 cycles | 105 (47) | 28 vs 28, P = .5 | 102 vs 77, P = .5 |
| ≥VGPR after 4 cycles | 134 (60) | 30 vs 27, P = .06 | 81 vs 84, P = .5 |
| ≥VGPR, best response | 183 (82) | 30 vs 18, P < .001 | 94 vs 47, P = .008 |
Data for PFS and OS are in months. Bold type indicates P < .05.
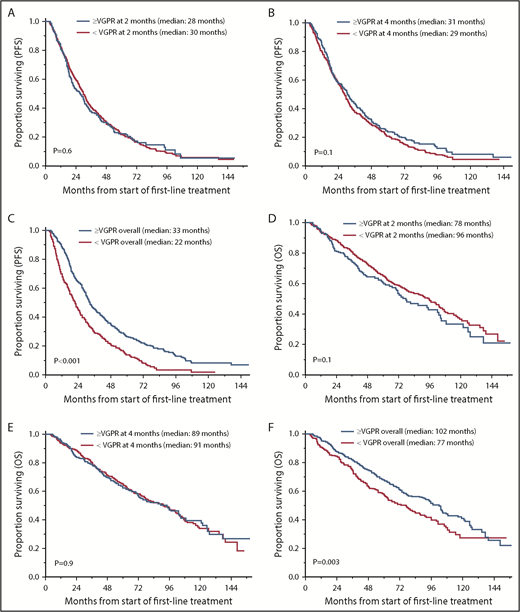
OS and PFS in patients who achieved ≥VGPR and <VGPR. (A) PFS based on response after 2 cycles. ≥VGPR, n = 240; median PFS, 28 months; 95% CI, 22-31. <VGPR, n = 600; median PFS, 30 months; 95% CI, 27-32; P = .6. (B) PFS based on response after 4 cycles. ≥VGPR, n = 350; median PFS, 31 months; 95% CI, 27-35. <VGPR, n = 490; median PFS, 29 months; 95% CI, 26-31; P = .1. (C) PFS based on best response with first-line treatment. >VGPR, n = 552; median PFS, 33 months; 95% CI, 31-36. <VGPR, n = 288; median PFS, 22 months, 95% CI, 18-25; P < .001. (D) OS based on response after 2 cycles. ≥VGPR, n = 240; median OS, 78 months; 95% CI, 67-102. <VGPR, n = 600; median OS, 96 months; 95% CI, 80-104; P = .1. (E) OS based on response after 4 cycles. ≥VGPR, n = 350; median OS, 89 months; 95% CI, 72-105. <VGPR, n = 490; median PFS, 91 months; 95% CI, 77-102; P = .9. (F) OS based on best response with first-line treatment. ≥VGPR, n = 552; median OS, 102 months; 95% CI, 87-108. <VGPR, n = 288; median PFS, 77 months; 95% CI, 61-88; P = .003.
OS and PFS in patients who achieved ≥VGPR and <VGPR. (A) PFS based on response after 2 cycles. ≥VGPR, n = 240; median PFS, 28 months; 95% CI, 22-31. <VGPR, n = 600; median PFS, 30 months; 95% CI, 27-32; P = .6. (B) PFS based on response after 4 cycles. ≥VGPR, n = 350; median PFS, 31 months; 95% CI, 27-35. <VGPR, n = 490; median PFS, 29 months; 95% CI, 26-31; P = .1. (C) PFS based on best response with first-line treatment. >VGPR, n = 552; median PFS, 33 months; 95% CI, 31-36. <VGPR, n = 288; median PFS, 22 months, 95% CI, 18-25; P < .001. (D) OS based on response after 2 cycles. ≥VGPR, n = 240; median OS, 78 months; 95% CI, 67-102. <VGPR, n = 600; median OS, 96 months; 95% CI, 80-104; P = .1. (E) OS based on response after 4 cycles. ≥VGPR, n = 350; median OS, 89 months; 95% CI, 72-105. <VGPR, n = 490; median PFS, 91 months; 95% CI, 77-102; P = .9. (F) OS based on best response with first-line treatment. ≥VGPR, n = 552; median OS, 102 months; 95% CI, 87-108. <VGPR, n = 288; median PFS, 77 months; 95% CI, 61-88; P = .003.
Half-life of serum-free light chains is much shorter than that of intact monoclonal proteins. As mentioned above, patients with light chain–evaluable disease were more likely to have early response. Therefore, we conducted subgroup analyses for survival outcomes in patients with light chain–evaluable disease (n = 233, 27%) and monoclonal protein–evaluable disease (n = 616, 73%). One patient had bone marrow involvement only and was excluded from this analysis. Results are shown in Table 2. Distribution of high-risk cytogenetics in patients achieving early VGPR after cycle 2 vs not in the light chain–evaluable cohort was 17% vs 9% (P = .2), and it was 36% vs 21% in the monoclonal protein–evaluable cohort (P = .006). Patients achieving an early VGPR or better response after 2 and 4 cycles of therapy did not have better outcomes for both light chain– and monoclonal protein–evaluable MM. In fact, we observed that patients with monoclonal protein–evaluable disease achieving an early response at 2 months had inferior OS. Median OS in patients with light chain–evaluable disease achieving an early CR/VGPR response vs not at 2 months was 102 vs 77 months, but this was not statistically significant (P = .5). There was no difference in PFS in either of the subgroups based on early response at 2 months.
Because early responders were observed to have features suggestive of high-risk disease, as well as a higher likelihood of having received a triplet-based regimen and of undergoing ASCT as part of first-line therapy, we performed a multivariate analysis to evaluate the impact of early response on OS and PFS after adjusting for these factors and stratified patients by transplant status (Table 3). Covariates in the model included high-risk cytogenetics [deletion of 17p/monosomy 17, t(4;14), or t(14;16)], ISS stage III disease, receiving a triplet regimen, presence of renal impairment (serum creatinine ≥2 mg/dL), disease type (light chain evaluable vs not), and age. In the model for PFS, only the presence of high-risk cytogenetics (HR, 1.7; 95% CI, 1.1-2.6; P = .03) was predictive for inferior PFS in the transplant group, whereas high-risk cytogenetics (HR, 1.6; 95% CI, 1.2-2.3; P = .006) and the presence of renal impairment (HR, 2.3; 95% CI, 1.4-3.9; P = .002) were predictive of inferior PFS in the nontransplant group. The attainment of early response did not impact PFS in the transplant group (HR, 1.1; 95% CI, 0.7-1.6; P = .8) or in the nontransplant group (HR, 1.2; 95% CI, 0.8-1.7; P = .4) in this model. In the OS model, high-risk cytogenetics (HR, 1.2; 95% CI, 1.1-4.4; P = .04) and ISS stage III disease (HR, 2.1; 95% CI, 1.02-4.2; P = .007) were observed to be prognostic for inferior OS in the transplant cohort, whereas high-risk cytogenetics (HR, 2.1; 95% CI, 1.4-3.2; P < .001) and age (HR, 7.0; 95% CI, 2.1-23.8; P = .002) were adverse prognostic factors in the nontransplant cohort. In this model, attainment of early VGPR after 2 cycles did not impact OS in the transplant (HR, 1.6; 95% CI, 0.9-2.9; P = .1) or the nontransplant (HR, 1.5; 95% CI, 1.0-2.4; P = .07) cohort.
Multivariate analysis for PFS and OS
| PFS | OS | |||
|---|---|---|---|---|
| HR (95% CI) | P | HR (95% CI) | P | |
| Patients undergoing ASCT as part of first-line therapy | ||||
| ≥VGPR vs not | 1.1 (0.7-1.6) | .8 | 1.6 (0.9-2.9) | .1 |
| High-risk FISH | 1.7 (1.1-2.6) | .03 | 1.2 (1.1-4.4) | .04 |
| ISS stage III vs I/II | 1.5 (0.9-2.3) | .1 | 2.1 (1.02-4.2) | .04 |
| Triplet vs not | 0.9 (0.6-1.2) | .4 | 0.6 (0.4-1.2) | .1 |
| Creatinine ≥2 mg/dL | 1.1 (0.6-2.0) | .7 | 1.4 (0.6-3.1) | .4 |
| Disease type: light chain vs not | 1.0 (0.6-1.5) | .9 | 0.8 (0.4-1.5) | .5 |
| Age (continuous variable) | 1.1 (0.4-2.9) | .8 | 2.6 (0.6-12.5) | .2 |
| Patients not undergoing ASCT as part of first-line therapy | ||||
| ≥VGPR vs not | 1.2 (0.8-1.7) | .4 | 1.5 (1.0-2.4) | .07 |
| High-risk FISH | 1.6 (1.2-2.3) | .006 | 2.1 (1.4-3.2) | <.001 |
| ISS stage III vs I/II | 1.4 (1.0-1.9) | .08 | 1.4 (0.9-2.2) | .1 |
| Triplet vs not | 0.9 (0.7-1.2) | .5 | 0.7 (0.5-1.0) | .06 |
| Creatinine ≥2 mg/dL | 2.3 (1.4-3.9) | .002 | 1.9 (1.0-3.8) | .06 |
| Disease type: light chain vs not | 1.0 (0.7-1.5) | .9 | 1.0 (0.6-1.6) | .9 |
| Age (continuous variable), y | 1.0 (0.5-2.4) | .9 | 7.0 (2.1-23.8) | .002 |
Bold type indicates P < .05.
Survival outcomes over time
Given the changes in upfront therapy regimens over the last decade, we also examined survival outcomes based on the time period of diagnosis in our study cohort. Median PFS of patients diagnosed from 2004 to 2009 (n = 393) vs 2010 to 2015 (n = 447) was 29 vs 30 months, respectively (P = .8). We observed numerically higher OS for patients diagnosed in more recent years, but this difference did not reach statistical significance. Median OS for patients in the study cohort diagnosed from 2004 to 2009 vs 2010 to 2015 was 87 months vs not reached (P = .2).
Discussion
We analyzed a large cohort of patients with NDMM treated with novel agents from 2004 to 2015 and observed that achieving an early response is not associated with better survival outcomes (PFS and OS). Although achieving a VGPR as overall response was associated with superior outcomes, as consistently shown in prior studies, median PFS and OS were not significantly different among patients who achieved ≥VGPR and <VGPR after 2 and 4 cycles of treatment. This suggests that there is no impact of response kinetics on long-term outcomes in the era of novel therapies.
Interestingly, we observed that patients who demonstrated high-risk features, such as renal impairment and high-risk cytogenetics [specifically t(4;14)], as well as those with ISS stage III disease, were more likely to achieve a rapid response. It is possible that such patients have a higher plasma cell proliferative rate, resulting in increased initial sensitivity to treatment, but a higher rate of loss of response, resulting in inferior long-term outcomes that have been well described in these patients. Serum-free light chains have a shorter half-life than intact immunoglobulins, and a higher proportion of patients with early response had light chain–evaluable disease. However, even on analyzing these groups separately, achievement of early VGPR was not associated with improved survival. In fact, patients with monoclonal immunoglobulin–evaluable disease who achieved an early response had inferior OS. One possible explanation for this finding is the significantly higher proportion of patients with high-risk cytogenetics in the early VGPR group in this cohort (36% vs 21%, P = .006). This difference was not as pronounced in the light chain–evaluable cohort with early response (17% vs 9%, P = .2). As would be expected, patients receiving triplet regimens (which are most commonly proteasome inhibitor based) were more likely to achieve early VGPR after 2 cycles. Because high-risk features were more frequently observed in patients who demonstrated early VGPR, we accounted for them in a multivariable analysis for survival. Results from multivariable analysis continued to demonstrate no difference in PFS or OS for patients achieving an early VGPR after 2 cycles of treatment, even after accounting for differences in baseline variables and treatment received by patients achieving an early VGPR. Because we did not observe any improvement in survival with early response, this favors the approach of continuing the same treatment regimen, even if the patient has not achieved an early rapid deep response, as long as disease is showing some response to therapy. This would be applicable for patients undergoing transplant and nontransplant approaches. However, we must be cautious in drawing strong conclusions for clinical practice, because this is retrospective study, and patients were treated with various regimens across an extended time period.
There are inconsistent results across studies with respect to the impact of rapidity of response in patients with myeloma. Our results are consistent with the findings from some other studies. Harousseau et al evaluated NDMM patients from a phase 3 trial and showed that, among patients achieving CR with bortezomib-melphalan-prednisone, the duration of CR was similar in patients achieving early CR (cycles 1-4, within 24 weeks) and late CR (cycles 5-9, after 24 weeks).15 Similarly, results of the extended follow-up of the phase 3 Assessment of Proteasome Inhibition for Extending Remissions trial also showed that time to response did not impact response duration. However, unlike our study, that trial included patients with relapsed myeloma who had received 1 to 3 prior lines of therapy.16 The Spanish myeloma group analyzed 632 NDMM patients who underwent ASCT and observed that, for patients who achieve CR, there were no differences in event-free survival and OS between those achieving CR early (pretransplantation) or late (posttransplantation). However, for patients with near CR (nCR), event-free survival (30 months vs 49 months; P = .04) and OS (51 months vs not reached; P = .001) were significantly worse among those who achieved nCR pretransplantation and stayed in nCR posttransplantation compared with those who upgraded to nCR posttransplantation after a lesser response pretransplantation.9 These results are different from our findings. Our study design is somewhat different, because it includes patients undergoing transplant- and nontransplant-based approaches. It is also possible that worse outcomes in patients with early nCR in the Spanish study compared with those with late nCR may be related to the sensitivity of patients with late nCR to subsequent treatments.
Consistent with prior studies that have demonstrated an association between deep response and better survival outcomes, we found that PFS and OS were significantly superior among patients who achieved ≥VGPR as the overall best response to first-line treatment. There is extensive evidence that CR or maximal response posttransplant in NDMM patients treated with ASCT is associated with improvement in PFS and OS.17-21 Studies from patients in a nontransplant setting have also demonstrated that the achievement of CR or maximal response is associated with improved long-term outcomes.22-25
Our study has limitations owing to its retrospective nature and nonuniform first-line treatment of patients over a long study period. However, patients were treated with novel agents and we did not observe a significant difference in PFS with first-line treatment in patients who were treated at different periods in time. Treatment with a triplet-based regimen was accounted for in multivariable analysis. Our results can be helpful in framing patient and physician expectations regarding kinetics of response in NDMM. Future areas of study include evaluating outcomes with risk-adapted treatment approaches to deepen the response in patients who do not achieve the desired response by a defined time period.
In conclusion, our data support that achievement of a deep response after first-line treatment is prognostic for improved long-term outcomes. However, the rapidity of achievement of this response, whether early or late during the course of the treatment, does not impact survival.
Authorship
Contribution: N.T. and S.K.K. designed the study, collected the data, analyzed the data, wrote the first draft, and approved the final version of the manuscript; S.S. collected and analyzed the data and wrote the manuscript; and M.A.G., A.D., T.V.K., M.Q.L., F.K.B., D.D., R.W., A.L.F., M.A.H., S.R.H., W.I.G., Y.L.H., P.K., R.A.K., N.L., R.S.G., J.A.L., S.J.R., and S.V.R. critically reviewed the first draft, and approved the final version of the manuscript.
Conflict-of-interest disclosure: S.S. received honoraria/consultancy fees from Janssen. A.D. received research funding from Celgene, Takeda, Prothena, Jannsen, Pfizer, Alnylam Pharmaceuticals, and GlaxoSmithKline. M.A.G. received honoraria/consultancy fees from Ionis, Alnylam Pharmaceuticals, Prothena, Celgene, Janssen, Specytrum, Annexon Biosciences, Apellis Pharmaceuticals, Amgen, Medscape, AbbVie, Research to Practice, Physicians Education Resource, and Teva. P.K. received research funding from Celgene and Takeda. M.Q.L. received research funding from Celgene. S.K.K. received research funding and served on the Board of Directors or advisory committees for AbbVie, Celgene, Janssen, KITE, and Merck; served on the Board of Directors or advisory committees for Oncopeptides and Takeda; and received research funding from Novartis and Roche. The remaining authors declare no competing financial interests.
Correspondence: Shaji K. Kumar, Division of Hematology, Mayo Clinic, 200 First St SW, Rochester, MN 55905; e-mail: kumar.shaji@mayo.edu.

