

Key Points
The lncRNA HOXA10-AS is highly expressed in KMT2A-rearranged AMLs and exerts its oncogenic effects by inducing NF-κB target genes.
Knockdown of HOXA10-AS reduces the leukemic growth of KMT2A-rearranged AML blasts in vivo.

Abstract
HOX genes are highly conserved, and their precisely controlled expression is crucial for normal hematopoiesis. Accordingly, deregulation of HOX genes can cause leukemia. However, despite of intensive research on the coding HOX genes, the role of the numerous long noncoding RNAs (lncRNAs) within the HOX clusters during hematopoiesis and their contribution to leukemogenesis are incompletely understood. Here, we show that the lncRNA HOXA10-AS, located antisense to HOXA10 and mir-196b in the HOXA cluster, is highly expressed in hematopoietic stem cells (HSCs) as well as in KMT2A-rearranged and NPM1 mutated acute myeloid leukemias (AMLs). Using short hairpin RNA– and locked nucleic acid-conjugated chimeric antisense oligonucleotide (LNA-GapmeR)–mediated HOXA10-AS-knockdown and CRISPR/Cas9-mediated excision in vitro, we demonstrate that HOXA10-AS acts as an oncogene in KMT2A-rearranged AML. Moreover, HOXA10-AS knockdown severely impairs the leukemic growth of KMT2A-rearranged patient-derived xenografts in vivo, while high HOXA10-AS expression can serve as a marker of poor prognosis in AML patients. Lentiviral expression of HOXA10-AS blocks normal monocytic differentiation of human CD34+ hematopoietic stem and progenitor cells. Mechanistically, we show that HOXA10-AS localizes in the cytoplasm and acts in trans to induce NF-κB target genes. In total, our data imply that the normally HSC-specific HOXA10-AS is an oncogenic lncRNA in KMT2A-r AML. Thus, it may also represent a potential therapeutic target in KMT2A-rearranged AML.
Introduction
The discovery of noncoding RNAs as important regulators of cell biology, differentiation, and disease pathogenesis has led to a paradigm shift in molecular biology. In fact, it has been proposed that the complexity of mammalian development results from the diversity of noncoding RNA expression rather than from protein-coding genes.1 Long noncoding RNAs (lncRNAs), defined as noncoding transcripts >200 nt,2 have on average a more tissue-specific and developmental stage–specific expression pattern than protein-coding genes, suggesting a crucial role in pathophysiological processes.3,4 However, only a small fraction of lncRNAs have been functionally characterized, and even fewer have been studied in the context of hematopoiesis and leukemogenesis.
The most frequent structural cytogenetic aberration in pediatric acute myeloid leukemia (AML) is KMT2A (formerly known as mixed lineage leukemia [MLL]) rearrangement (KMT2A-r), which is present in ∼20% of all patients with childhood AML5 and is strongly associated with a monocytic/monoblastic phenotype.6 Among the various forms of KMT2A-r, a common theme is that KMT2A fusion proteins aberrantly upregulate the expression of HOX genes, which are normally modulated by wild-type KMT2A.7,8 HOX genes play an essential role in the regulation of hematopoiesis through lineage- and differentiation stage–specific expression. They are highly expressed in hematopoietic stem cells (HSCs) and early progenitors and are downregulated during differentiation.9 Ectopic expression of several HOX genes was shown to be sufficient for the initiation of leukemic transformation. Accordingly, in KMT2A-r AMLs, the fusion protein-mediated overexpression of HOX genes is at least partially responsible for leukemic transformation.10 Notably, numerous lncRNAs are located within the HOX clusters. Many are highly conserved and differentially expressed during development, suggesting their biological importance.11 Although a handful of HOX lncRNAs, such as HOTAIR, HOTAIRM1, and HOTTIP, have been characterized,11-13 the contribution of other HOX cluster lncRNAs to the pathogenesis of AML remains unknown.
Our study focused on characterizing HOXA10-AS and its role during hematopoiesis and leukemogenesis. HOXA10-AS is a lncRNA situated in the 3′ region of the HOXA cluster and transcribed antisense to HOXA10 and the intronic mir-196b, both of which are highly expressed in KMT2A-r AMLs and play crucial roles during leukemogenesis.14-18
Using short hairpin RNA (shRNA)– and locked nucleic acid-conjugated chimeric antisense oligonucleotide (LNA-GapmeR)–mediated knockdown and CRSIPR/Cas9–mediated excision, we demonstrate that KMT2A-r AML cell lines and patient derived-xenografts are dependent on high HOXA10-AS expression, an effect that was independent of changes in nearby HOXA coding gene expression. We further demonstrate that HOXA10-AS is HSC specific and that its overexpression blocks normal monocytic differentiation and enhances leukemic growth by inducing NF-κB target genes. Thus, our data implicate HOXA10-AS as an oncogenic lncRNA and a potential therapeutic target.
Materials and methods
For detailed descriptions, see supplemental Methods.
Patient samples
Hematopoietic stem and progenitor cells (HSPCs) were isolated by labeling CD34+ cells with magnetic cell-sorting beads (Miltenyi Biotech), according to the manufacturer’s instructions. AML patient samples were provided by the AML Berlin-Frankfurt-Münster Study Group (AML-BFM-SG, Essen, Germany). Informed consent was obtained from all human participants or custodians. All investigations were approved by the local ethics committees of the Hannover Medical School and the Martin Luther University Halle-Wittenberg and performed in accordance with the declaration of Helsinki and local laws and regulations.
Lentiviral vector construction and transduction
shRNAs against HOXA10-AS were designed, cloned into a pLKO5d.SFFV.eGFP.miR30N backbone, and tested with a reporter assay as previously described.19 For shRNA reporter assays, gBlocks (Integrated DNA Technologies) with shRNA-binding sites were inserted into pTtNPT and used to generate stable reporter cell lines, which were then transduced with shRNA constructs to perform the reporter assay.20 Pairs of single guide RNAs (sgRNAs) targeting the promotor and transcription start site of HOXA10-AS or firefly luciferase (nontargeting control) were cloned into the lentiviral dual-sgRNA SGL40C.EFS.GFP vector, as previously described.21,22 The design of the LBid-lnc vector for the ectopic expression of lncRNAs has been previously described.23 Transduction, culture, and sorting of AML blasts and CD34+ HSPCs were performed as previously described.24,25
LNA-GapmeRs
LNA-GapmeRs against HOXA10-AS were designed and provided by Exiqon. Negative control B was used as a nontargeting control (Exiqon). Cell lines were analyzed after the addition of 2.5 µM LNA-GapmeRs to the culture medium (unassisted uptake).26
Flow cytometry and cell sorting
Flow cytometry analyses of the transduced HSPCs, cell lines, and patient blasts were performed on a fluorescence-activated cell sorter (FACS) Canto flow cytometer (BD Biosciences) or a CytoFLEX B5-R3-V5 (Beckman Coulter). Sorting was performed on a FACSAria II (SORP) or FACSAria Fusion (BD Biosciences). Kaluza 1.3/1.5 (Beckman Coulter) was used for data analysis. Staining and measurement were performed according to standard protocols as previously described for human cells27 using the antibodies CD163-PE (BD Biosciences), CD11b-PeCy7 (Beckman Coulter), CD14-APC (Beckman Coulter), CD45-V500 (BD Biosciences), CD163-APC-Cy7 (BioLegend), CD45-APC (BD Biosciences), CD15-BV605 (BD Biosciences), and CD66b-PE (BD Biosciences). Cell cycle analysis and apoptosis analysis were performed using the BrdU Flow Kit (BD Biosciences) and the Annexin V Apoptosis Detection Kit (BD Biosciences), respectively, according to the manufacturer’s instructions. Single-cell clones were derived by directly sorting transduced cells into 96-well plates.
Mice and transplantation experiments
Primary human AML cells were CD3 depleted using OKT3 (BioXCell) and used after serial transplantation into xenograft mouse models as previously described.25 For shRNA-mediated knockdown of HOXA10-AS, AML cells were isolated, lentivirally transduced, and transplanted into 2.5-Gy–irradiated NOD.Cg-Prkdcscid Il2rgtm1Wjl/SzJ recipients. All animal experiments protocols were approved by the state authorities.
Gene expression data collection and analysis
Gene expression analyses were performed by the core facility of the Helmholtz Center for Infection Research in Braunschweig, Germany, using the Gene-Expression Affymetrix Microarray Clariom S Pico Assay as the array platform. The data were preprocessed and analyzed using R and Bioconductor as previously described.19
Statistical analyses and definitions
Complete remission was defined as fulfillment of the Cancer and Leukemia Group B criteria,28 and early death was defined as death before or within the first 6 weeks of treatment. Event-free survival (EFS) was defined as time from diagnosis to the first event or last follow-up. Events were death from any cause, failure to achieve remission, relapse, and secondary malignancy. Failure to achieve remission was considered as an event on day 0. Overall survival was defined as the time between diagnosis and death from any cause or last follow-up. The Kaplan-Meier method was used to estimate survival rates.29 Differences were compared using the 2-sided log-rank test,30 and standard errors were obtained using the Greenwood formula. The DESeq2 package was used to normalize and variance-stabilize RNA-sequencing read count data.31 The pediatric AML data set further required batch correction, for which we used the sva package.32 Normalized (and batch-corrected) expression of HOXA10-AS was taken as a continuous variable in the survival model. For patient stratification, the optimal cutoff point was determined using maximally selected log-rank statistics as implemented in the maxstat R package (http://cran.r-project.org/web/packages/maxstat/index.html). The calculated cutoff for EFS was used for both overall survival and EFS analyses. We relied on R Version 3.3 (http://www.r-project.org/) for all of the above computations.
Statistical evaluations of experimental data were carried out using 2-way analysis of variance or Student t test for multiple comparisons. The level of significance was set at P < .05. All data are presented as mean ± standard deviation (SD) or standard error of the mean (SEM) as indicated. Calculations were performed using GraphPad Prism 6/7 (STATCON).
Results
HOXA10-AS is highly expressed in HSCs and KMT2A-r AML blasts
The lncRNA gene HOXA10-AS is located on human chromosome 7 antisense to the HOXA protein-coding genes (Figure 1A). The 3′ end of HOXA10-AS overlaps the 3′ end of HOXA10. The entire mir-196b gene is antisense and overlapping to HOXA10-AS. Our microarray-based lncRNA expression atlas of the hematopoietic system19 revealed that the lncRNA HOXA10-AS is highly and specifically expressed in HSCs and downregulated during differentiation (data not shown), which was verified via quantitative real-time polymerase chain reaction (qRT-PCR; Figure 1B). As previously described,9,17 HOXA10 and miR-196b were also highly expressed in HSCs, but in contrast to HOXA10-AS, their expression remained high in hematopoietic progenitor populations (Figure 1C). To expand our insights into HOXA10-AS expression patterns in leukemia, we performed qRT-PCR on AML cell lines, revealing significantly higher HOXA10-AS levels in KMT2A-r (t[4;11]: MV4-11; t[9;11]: NOMO-1, THP-1; t[6;11]: SHI-1, ML-2; ins[11;9]: MOLM-13; partial tandem duplication: EOL-1) compared with non-KMT2A-r leukemia cell lines (37-fold; P =.0085; Figure 1D). Notably, no difference of HOXA10 and miR-196b expression was observed between KMT2A-r and non-KMT2A-r cell lines (HOXA10: P =.776; miR-196b: P = .0645; Figure 1E). Deeper analysis of our microarray expression atlas data19 affirmed high HOXA10-AS expression also in primary AMLs with KMT2A-r compared with cases with other cytogenetic aberrations. HOXA10-AS expression was significantly higher in KMT2A-r AMLs with t(9;11) than in AMLs with t(8;21) (P =.0101) and t(15;17) (P =.0109) (Figure 1F).
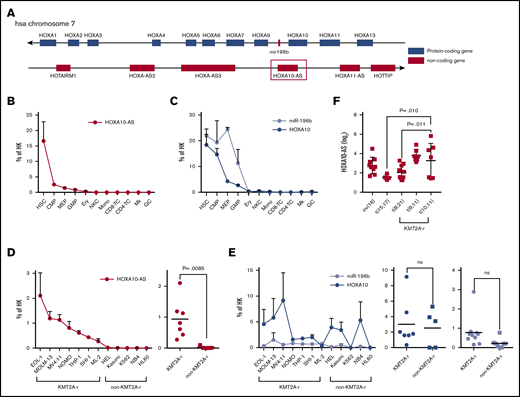
HOXA10-AS is highly expressed in HSPCs and KMT2A-rearranged leukemic cells. (A) Schematic of the genomic locus around HOXA10-AS, which is antisense to HOXA10 and miR-196b. (B-C) Mean expression of HOXA10-AS (B) and HOXA10 and miR-196b (C) in defined blood cell populations from healthy individuals as a percentage of the housekeeping (HK) gene β-2 microglobulin or RNU48 and U6 as measured by qRT-PCR (n ≥ 2; presented as mean ± SEM). HSCs, common myeloid progenitor cells (CMP), granulocyte-monocyte progenitor cells (GMP), megakaryocyte-erythroid progenitor cells (MEP), megakaryocytes (Mk), erythroid precursors (Ery), granulocytes (GC), monocytes (Mono), CD4 and CD8 T cells, and natural killer cells (NKC). (D-E) Mean expression of HOXA10-AS (D) and HOXA10 and miR-196b (E) in AML cell lines as a percentage of the housekeeping genes β-2 microglobulin or RNU48 and U6 as measured by qRT-PCR (n ≥ 2; presented as mean ± SEM). On the right, HOXA10-AS, HOXA10, and miR-196b expression in KMT2A-rearranged and non–KMT2A-rearranged cell lines (unpaired Student t test). (F) Normalized expression of HOXA10-AS in cytogenetically defined pediatric patient cohorts (1-way variance analysis). ns, not significant.
HOXA10-AS is highly expressed in HSPCs and KMT2A-rearranged leukemic cells. (A) Schematic of the genomic locus around HOXA10-AS, which is antisense to HOXA10 and miR-196b. (B-C) Mean expression of HOXA10-AS (B) and HOXA10 and miR-196b (C) in defined blood cell populations from healthy individuals as a percentage of the housekeeping (HK) gene β-2 microglobulin or RNU48 and U6 as measured by qRT-PCR (n ≥ 2; presented as mean ± SEM). HSCs, common myeloid progenitor cells (CMP), granulocyte-monocyte progenitor cells (GMP), megakaryocyte-erythroid progenitor cells (MEP), megakaryocytes (Mk), erythroid precursors (Ery), granulocytes (GC), monocytes (Mono), CD4 and CD8 T cells, and natural killer cells (NKC). (D-E) Mean expression of HOXA10-AS (D) and HOXA10 and miR-196b (E) in AML cell lines as a percentage of the housekeeping genes β-2 microglobulin or RNU48 and U6 as measured by qRT-PCR (n ≥ 2; presented as mean ± SEM). On the right, HOXA10-AS, HOXA10, and miR-196b expression in KMT2A-rearranged and non–KMT2A-rearranged cell lines (unpaired Student t test). (F) Normalized expression of HOXA10-AS in cytogenetically defined pediatric patient cohorts (1-way variance analysis). ns, not significant.
Thus, HOXA10-AS is an HSC-specific lncRNA that is highly expressed in KMT2A-r AMLs.
HOXA10-AS is required for maintenance of KMT2A-rearranged AMLs
The specific upregulation of HOXA10-AS in KMT2A-r AMLs prompted us to hypothesize that this lncRNA may exert context-dependent oncogenic effects. Aiming to functionally verify our hypothesis, we performed loss-of-function experiments using shRNAs, LNA-GapmeRs, and CRISPR/Cas9-mediated excision. HOXA10-AS downregulation using 3 different shRNAs reduced the growth of 3 KMT2A-r cell lines with high endogenous HOXA10-AS-expression (EOL-1, MOLM-13, and MV4-11) compared with the nonsilencing shRNA control (against Renilla luciferase; Figure 2A). The growth defect induced by HOXA10-AS knockdown in KMT2A-r cells was verified using LNA-GapmeRs that enable strand-specific silencing of RNA transcripts (Figure 2B; supplemental Figure 1). In the EOL-1 cell line, which shows high endogenous HOXA10-AS expression, shRNA-mediated downregulation caused a reduction of S-phase cells accompanied by an accumulation of G1-phase cells and an increase in Annexin V+ apoptotic cells (Figure 2C-D). In contrast, a non-KMT2A-r cell line with low HOXA10-AS expression (NB-4) was insensitive to HOXA10-AS knockdown (Figure 2A-D).

HOXA10-AS is required for the maintenance of KMT2A-rearranged AML cells. (A) Percentage of cells transduced with shRNAs against HOXA10-AS after 21 days in culture compared with day 5 and a nontargeting shRNA (ctrl; n = 3; unpaired Student t test; presented as mean ± SEM). (B) Cell counts on day 21 following treatment with LNA-GapmeRs against HOXA10-AS compared with day 2 and the nontargeting control (ctrl; n = 2; unpaired Student t test; presented as mean ± SEM). (A-B) EOL-1, MOLM-13, and MV4-11 were used as KMT2A-r cell lines, while NB-4 was used as the non-KMT2A-r cell line. (C-D) 5-Bromo-2′-deoxyuridine cell cycle (C) and Annexin V apoptosis (D) assays in EOL-1 and NB-4 cells after shRNA-mediated HOXA10-AS knockdown using 3 different shRNAs. The percentage of cells is shown as mean ± SD (n = 2; *P < .05; **P < .01). (E) Schematic of the genomic locus and of the regions that are excised by the sgRNA pairs. (F) Percentage of cells transduced with HOXA10-AS excision sgRNAs (GFP+) after 21 days in culture compared with day 2 and nontargeting sgRNAs (n ≥ 3; unpaired Student t test; presented as grand mean). EOL-1, MOLM-13 and MV4-11 were used as KMT2A-r cell lines, while NB-4 was used as the non-KMT2A-r cell line. (G-H) 5-Bromo-2′-deoxyuridine cell cycle (G) and Annexin V apoptosis (H) assays in EOL-1 and NB-4 cells after sgRNA-mediated excision using 4 different sgRNA pairs. The percentage of cells is shown as mean ± SD (n = 2; *P < .05; **P < .01).
HOXA10-AS is required for the maintenance of KMT2A-rearranged AML cells. (A) Percentage of cells transduced with shRNAs against HOXA10-AS after 21 days in culture compared with day 5 and a nontargeting shRNA (ctrl; n = 3; unpaired Student t test; presented as mean ± SEM). (B) Cell counts on day 21 following treatment with LNA-GapmeRs against HOXA10-AS compared with day 2 and the nontargeting control (ctrl; n = 2; unpaired Student t test; presented as mean ± SEM). (A-B) EOL-1, MOLM-13, and MV4-11 were used as KMT2A-r cell lines, while NB-4 was used as the non-KMT2A-r cell line. (C-D) 5-Bromo-2′-deoxyuridine cell cycle (C) and Annexin V apoptosis (D) assays in EOL-1 and NB-4 cells after shRNA-mediated HOXA10-AS knockdown using 3 different shRNAs. The percentage of cells is shown as mean ± SD (n = 2; *P < .05; **P < .01). (E) Schematic of the genomic locus and of the regions that are excised by the sgRNA pairs. (F) Percentage of cells transduced with HOXA10-AS excision sgRNAs (GFP+) after 21 days in culture compared with day 2 and nontargeting sgRNAs (n ≥ 3; unpaired Student t test; presented as grand mean). EOL-1, MOLM-13 and MV4-11 were used as KMT2A-r cell lines, while NB-4 was used as the non-KMT2A-r cell line. (G-H) 5-Bromo-2′-deoxyuridine cell cycle (G) and Annexin V apoptosis (H) assays in EOL-1 and NB-4 cells after sgRNA-mediated excision using 4 different sgRNA pairs. The percentage of cells is shown as mean ± SD (n = 2; *P < .05; **P < .01).
To further validate these findings, we excised the promoter and transcription start site of HOXA10-AS using 4 pairs of sgRNA, in a dual-sgRNA lentiviral vector22 per pair (Figure 2E). Transduction of these sgRNA vectors into Cas9-expressing EOL-1, MOLM-13, MV4-11, and NB-4 cell lines and subsequent growth assays confirmed that the loss of HOXA10-AS impairs the proliferative potential of KMT2A-r cells (Figure 2F). Even though the reduction of cells in S-phase was not significant, we observed, similar to the knockdown experiments, an induction of apoptosis in EOL-1 cells, but not in NB-4 cells (Figure 2G-H).
Our data indicate that HOXA10-AS is essential for the maintenance of KMT2A-r AMLs, which are dependent on high levels of this transcript.
Overexpression of HOXA10-AS promotes leukemic growth and perturbs monocytic differentiation
To evaluate the oncogenic consequences of high HOXA10-AS levels, we lentivirally expressed HOXA10-AS in ML-2 cells and KMT2A-r patient blasts (supplemental Table 1 and supplemental Figure 2A), both of which are KMT2A-r and show a moderate endogenous HOXA10-AS expression. We leveraged a bidirectional vector system that was particularly developed for the expression of lncRNAs without adjacent viral sequences and features a poly(A) signal downstream of the lncRNA cassette.23 Subsequent proliferation assays revealed that overexpression of HOXA10-AS significantly increased the growth of ML-2 cells and KMT2A-r patient blasts compared with the cells transduced with the empty vector control (Figure 3A-B).
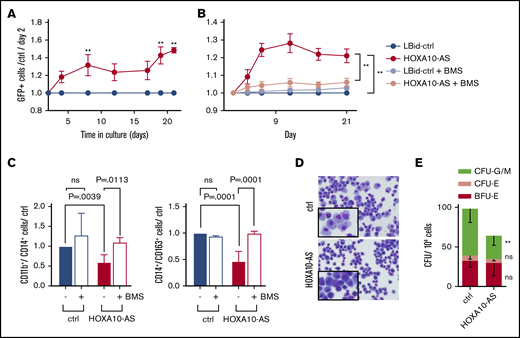
Overexpression of HOXA10-AS promotes leukemic growth and perturbs differentiation. (A) Percentage of LBid-HOXA10-AS–transduced GFP+ patient-derived blasts normalized to day 2 and to LBid-ctrl-transduced cells (n = 3; 2-way variance analysis; presented as mean ± SD; **P < .01). (B) Percentage of LBid-HOXA10-AS-transduced GFP+ ML-2 cells normalized to day 2 and to LBid-control–transduced cells in the presence of 1 µM BMS-345541 or dimethyl sulfoxide (n = 3; 2-way variance analysis; presented as mean ± SD; **P < .01). (C) FACS analysis of CD11b+/CD14+ and CD14+/CD163+ cells on day 11 of in vitro monocytic differentiation in the presence or absence of 1 µM BMS-345541 (n = 3-9; 2-way variance analysis; presented as mean ± SD). (D) May-Grünwald-Giemsa staining on day 10 of monocytic differentiation (original magnification ×400). (E) Number of CFUs in methylcellulose-based colony-forming assays (n = 4; 2-way variance analysis; presented as mean ± SD; **P < .01).
Overexpression of HOXA10-AS promotes leukemic growth and perturbs differentiation. (A) Percentage of LBid-HOXA10-AS–transduced GFP+ patient-derived blasts normalized to day 2 and to LBid-ctrl-transduced cells (n = 3; 2-way variance analysis; presented as mean ± SD; **P < .01). (B) Percentage of LBid-HOXA10-AS-transduced GFP+ ML-2 cells normalized to day 2 and to LBid-control–transduced cells in the presence of 1 µM BMS-345541 or dimethyl sulfoxide (n = 3; 2-way variance analysis; presented as mean ± SD; **P < .01). (C) FACS analysis of CD11b+/CD14+ and CD14+/CD163+ cells on day 11 of in vitro monocytic differentiation in the presence or absence of 1 µM BMS-345541 (n = 3-9; 2-way variance analysis; presented as mean ± SD). (D) May-Grünwald-Giemsa staining on day 10 of monocytic differentiation (original magnification ×400). (E) Number of CFUs in methylcellulose-based colony-forming assays (n = 4; 2-way variance analysis; presented as mean ± SD; **P < .01).
The high expression of HOXA10-AS in HSCs further suggests an important regulatory role for this lncRNA during hematopoietic differentiation. To investigate this role, we lentivirally expressed HOXA10-AS in CD34+ HSPCs (supplemental Figure 2A-B). HOXA10-AS overexpression significantly impaired differentiation under monocytic culture conditions (Figure 3C-D). Flow cytometry on day 11 of differentiation showed a reduction of CD11b+/CD14+ (1.7-fold reduction; P = .0039) and CD14+/CD163+ monocytic cells (2.1-fold reduction; P = .0001), compared with the empty vector control (Figure 3C). This differentiation block was verified morphologically; HOXA10-AS-expressing cells were smaller, with condensed nuclei and less cytoplasm, making them resemble immature monocytic progenitors compared with the typical monocytes observed in the control (Figure 3D). Corroborating these findings, colony-forming unit (CFU) assays showed a reduction of granulocytic and monocytic (CFU-G/M) CFUs in HOXA10-AS–expressing cells compared with the control (2-fold reduction; P < .0001; Figure 3E). Similar effects on differentiation were observed in conditions supporting granulocytic differentiation (supplementary Figure 2C-D).
HOXA10-AS does not act as a local regulator of nearby genes
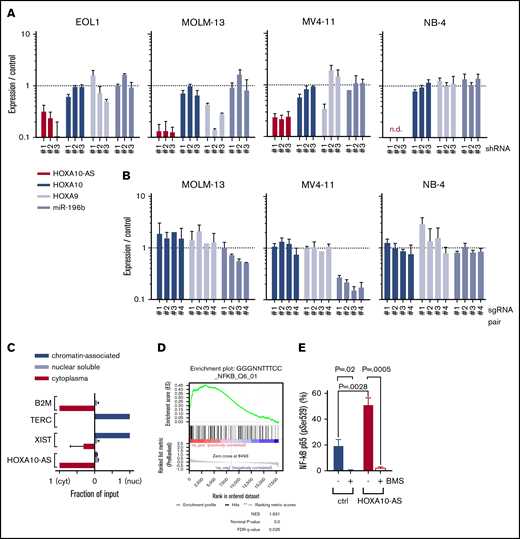
HOXA10-AS does not act as a local regulator of nearby genes and exerts its effects by inducing NF-κB target genes. (A) Expression of HOXA10-AS, HOXA10, HOXA9, and mir-196b as measured by qRT-PCR in EOL-1 cells, MOLM-13, MV4-11, and NB-4 cells after shRNA-mediated HOXA10-AS knockdown using 3 different shRNAs (n ≥ 2; n.d., not detectable). (B) Expression of HOXA10, HOXA9, and mir-196b as measured by qRT-PCR in single-cell clones of MOLM-13, MV4-11, and NB-4 cells after sgRNA-mediated HOXA10-AS excision using 4 different pairs of sgRNAs (n = 2). (C) Enrichment of HOXA10-AS in the cytoplasmic, nuclear soluble, and chromatin-bound compartments as measured by qRT-PCR on fractionated RNA from MOLM-13 and EOL-1 cells. The enrichment is shown as a ratio normalized to the compartment in which the transcript is most highly expressed (n = 2). (D) Gene set enrichment analysis results for NF-κB target genes in LBid-HOXA10-AS–transduced, sorted CD11b+/CD14−/CD117− cells compared with LBid-control–transduced cells on day 5 of monocytic differentiation. (E) Percentage of phosphorylated p65-positive (pSer529) LBid-HOXA10-AS– or LBid-control–transduced ML-2 cells in the presence or absence of 1 µM BMS-345541 (n = 2; presented as mean ± SD). FDR, false discovery rate; NES, normalized enrichment score.
HOXA10-AS does not act as a local regulator of nearby genes and exerts its effects by inducing NF-κB target genes. (A) Expression of HOXA10-AS, HOXA10, HOXA9, and mir-196b as measured by qRT-PCR in EOL-1 cells, MOLM-13, MV4-11, and NB-4 cells after shRNA-mediated HOXA10-AS knockdown using 3 different shRNAs (n ≥ 2; n.d., not detectable). (B) Expression of HOXA10, HOXA9, and mir-196b as measured by qRT-PCR in single-cell clones of MOLM-13, MV4-11, and NB-4 cells after sgRNA-mediated HOXA10-AS excision using 4 different pairs of sgRNAs (n = 2). (C) Enrichment of HOXA10-AS in the cytoplasmic, nuclear soluble, and chromatin-bound compartments as measured by qRT-PCR on fractionated RNA from MOLM-13 and EOL-1 cells. The enrichment is shown as a ratio normalized to the compartment in which the transcript is most highly expressed (n = 2). (D) Gene set enrichment analysis results for NF-κB target genes in LBid-HOXA10-AS–transduced, sorted CD11b+/CD14−/CD117− cells compared with LBid-control–transduced cells on day 5 of monocytic differentiation. (E) Percentage of phosphorylated p65-positive (pSer529) LBid-HOXA10-AS– or LBid-control–transduced ML-2 cells in the presence or absence of 1 µM BMS-345541 (n = 2; presented as mean ± SD). FDR, false discovery rate; NES, normalized enrichment score.
To further study the effect of HOXA10-AS on nearby genes, we excised the promoter and transcription start site of HOXA10-AS using the CRISPR/Cas9 system (Figure 2D) and derived single-cell clones of the MOLM-13, MV4-11, and NB-4 cell lines. No single-cell clones could be derived from EOL-1 (data not shown). Excision of the intended region was verified by Sanger sequencing (supplemental Figure 3). Again, the expression of HOXA10 and HOXA9 was not significantly altered in the single-cell–derived clones (Figure 4B). In contrast to the results we obtained with shRNAs, variable depletion of miR-196b was observed in MOLM-13 and MV4-11 HOXA10-AS excision cells (Figure 4B), which may be due to regulatory elements of miR-196b being excised along with the HOXA10-AS promoter. These data argue against the possibility that the effects of HOXA10-AS repression or loss are mediated by the control of the antisense HOX genes or miR-196b. This conclusion is further supported by the notion that HOXA10-AS is primarily located in the cytoplasm, as shown by RNA isolation from the individual compartments and subsequent qRT-PCR (Figure 4C).
HOXA10-AS exerts its effects by inducing NF-κB target genes
The cytoplasmatic enrichment of the transcript and the inability to proof a local regulatory function led us to suppose that HOXA10-AS acts in trans. To further understand the molecular consequences of high HOXA10-AS expression, we assessed early transcriptional changes that lead to the monocytic differentiation arrest caused by ectopic HOXA10-AS expression. We performed a microarray-based gene expression analysis on FACS-sorted myeloid precursors (CD11b+/CD14−/CD117−; supplemental Figure 4) after 5 days of monocytic culture. We identified 42 genes that were differentially expressed in HOXA10-AS–overexpressing cells (40 upregulated and 2 downregulated; false discovery rate <0.05; supplemental Table S2). Notably, HOXA9 and HOXA10 were not among the differentially expressed genes (supplemental Figure 5B). Gene Ontology analysis revealed the significantly upregulated genes to be enriched for factors involved in immune response, cytokine signaling, and hematopoietic cell lineage specifications (supplemental Figure 5A). Accordingly, gene set enrichment analysis identified NF-κB targets as the most highly enriched gene set (Figure 4D).
To further validate NF-κB as a downstream component of the HOXA10-AS mechanism, we analyzed phosphorylation of the NF-κB subunit p65 at serine 529, which is a marker for NF-κB activation.34 In ML-2 cells, HOXA10-AS overexpression led to elevated p65 phosphorylation, indicating increased NF-κB activation (Figure 4E). Moreover, inhibition of the NF-κB pathway in ML-2 cells using the IκB kinase inhibitor BMS-345541 abolished the HOXA10-AS–induced growth advantage (Figure 3B) and rescued the monocytic differentiation block in HOXA10-AS–transduced HSPCs (Figure 3C).
Taken together, our experiments suggest a model wherein HOXA10-AS induces NF-κB target genes in myeloid precursors, thereby perturbing monocytic differentiation in HSPCs and promoting leukemic growth in KMT2A-r blasts.
HOXA10-AS is a prognostic factor in AML
Our data indicate that HOXA10-AS is an oncogenic lncRNA and that HOXA10-AS expression is essential for the maintenance of KMT2A-r AMLs. Therefore, we aimed to investigate the impact of HOXA10-AS expression on AML prognosis. To accomplish this, we stratified a cohort of 258 pediatric patients35 and a cohort of 171 adult AML patients36 based on HOXA10-AS expression (Figure 5A-D). In both cohorts, HOXA10-AS was mostly absent from cases with t(15;17), t(18;21) and inv(16) and also from cases with CEBPA mutations (Figure 5A-D), while it was highly expressed in cases with KMT2A-r, in accordance with our previous results (Figure 1D). In addition, we observed high expression levels in adult cases with normal karyotype and NPM1 mutations (Figure 5C-D), suggesting a correlation between HOXA10-AS expression and the underlying genetic background of these AMLs. Kaplan-Meier analysis using an optimal HOXA10-AS expression cutoff determined via maximally selected rank statistics adjusted for multiple testing37,38 (supplemental Figure 6A-B) demonstrated that high HOXA10-AS expression was significantly associated with lower EFS in pediatric (26.6% vs 49.3% after 5 years; Padj.log-rank = .0015; Figure 5E) and adult (14.0% vs 48.7% after 5 years; Padj.log-rank < .0001; Figure 5F) patients. Overall survival was similarly reduced in both the pediatric (50.6% vs 65.8% after 5 years; Padj.log-rank = .04; supplemental Figure 6C) and adult (15.4% vs 51.4% after 5 years; Padj.log-rank < .0001; supplemental Figure 6D) cohorts, thus identifying HOXA10-AS as a prognostic factor. However, the association of HOXA10-AS expression with certain genetic AML subtypes that are known to have high HOXA9 or HOXA10 expression disqualifies HOXA10-AS from being an independent prognostic factor. Nonetheless, in cases where cytogenetic analyses are not possible or where HOXA9 and HOXA10 expression analysis is inconclusive, quantifying HOXA10-AS expression may add prognostic value. These results moreover suggest that targeting HOXA10-AS may be a promising therapeutic approach for AML patients who present with high levels of HOXA10-AS expression.
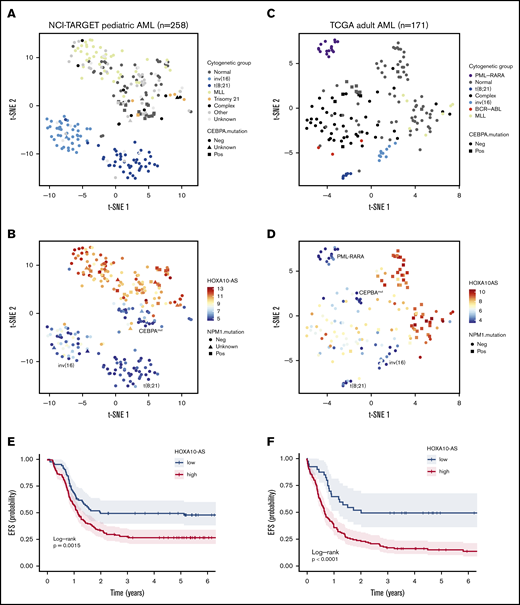
HOXA10-AS is a prognostic factor in AML. Analysis of RNA-sequencing data from 258 NCI-TARGET pediatric35 (A-B) and 171 TCGA adult36 (C-D) AML samples. (A) t-SNE representation using the 4362 most variable genes (interquartile range >1.5), with samples colored according to AML subtype. (B) t-SNE as in panel A with samples colored according to HOXA10-AS expression as indicated by the color key. (C) t-SNE representation using the 1840 most variable genes (interquartile range >1.5), with samples colored according to AML subtype. (D) t-SNE as in panel C with samples colored according to HOXA10-AS expression as indicated by the color key. (E) Probability of EFS in 258 NCI-TARGET pediatric AML patients with high (red; >5.5 normalized reads; cutoff determined via maximally selected rank statistics) or low HOXA10-AS expression (blue; ≤5.5 normalized reads). (F) Probability of EFS in 171 TCGA adult AML patients with high (red; >4.6 normalized reads; cutoff determined via maximally selected rank statistics) or low HOXA10-AS expression (blue; ≤4.6 normalized reads).
HOXA10-AS is a prognostic factor in AML. Analysis of RNA-sequencing data from 258 NCI-TARGET pediatric35 (A-B) and 171 TCGA adult36 (C-D) AML samples. (A) t-SNE representation using the 4362 most variable genes (interquartile range >1.5), with samples colored according to AML subtype. (B) t-SNE as in panel A with samples colored according to HOXA10-AS expression as indicated by the color key. (C) t-SNE representation using the 1840 most variable genes (interquartile range >1.5), with samples colored according to AML subtype. (D) t-SNE as in panel C with samples colored according to HOXA10-AS expression as indicated by the color key. (E) Probability of EFS in 258 NCI-TARGET pediatric AML patients with high (red; >5.5 normalized reads; cutoff determined via maximally selected rank statistics) or low HOXA10-AS expression (blue; ≤5.5 normalized reads). (F) Probability of EFS in 171 TCGA adult AML patients with high (red; >4.6 normalized reads; cutoff determined via maximally selected rank statistics) or low HOXA10-AS expression (blue; ≤4.6 normalized reads).
HOXA10-AS downregulation impairs leukemic growth in vivo
To test the potential therapeutic value of targeting HOXA10-AS in AML with high levels of HOXA10-AS expression, we performed knockdown experiments in vivo. shRNAs against HOXA10-AS (GFP+) and a luciferase control (dTomato+) were transduced into a tertiary KMT2A-r patient-derived AML xenograft (supplemental Table S1). The transduced cells were mixed in a 1:1 ratio and transplanted into sublethally irradiated quaternary recipient mice for an in vivo competition assay (Figure 6A; supplemental Figure 7). At the end point of the experiment, AML blasts containing the shRNA against HOXA10-AS were significantly diminished in the bone marrow (end point to input ratio of 0.1 [GFP+] vs 3.0 [dTomato+]; P = .0001), spleen (0.17 vs 2.45; P = .0001), and liver (0.21 vs 2.70; P = .0001) compared with the control (Figure 6B; supplemental Figure 7). These results further underline the dependency of KMT2A-r AMLs on HOXA10-AS and highlight its potential use as therapeutic target.

HOXA10-AS downregulation impairs leukemic growth in vivo. (A) Experimental design for HOXA10-AS knockdown in vivo in a patient-derived xenograft (PDX) model of AML. (B) PDX engraftment levels (dTomato+ or GFP+) in the bone marrow (BM), spleen (Sp), and liver (Li) in recipient mice after leukemia onset, displayed as percentage of transduced human CD45+ cells (right; unpaired Student t test). Representative FACS plots (left) of the bone marrow show the gating strategy to assess the percentage of fluorescent cells. NSG, NOD.Cg-PrkdcscidIl2rgtm1Wjl /SzJ; SSC, side scatter.
HOXA10-AS downregulation impairs leukemic growth in vivo. (A) Experimental design for HOXA10-AS knockdown in vivo in a patient-derived xenograft (PDX) model of AML. (B) PDX engraftment levels (dTomato+ or GFP+) in the bone marrow (BM), spleen (Sp), and liver (Li) in recipient mice after leukemia onset, displayed as percentage of transduced human CD45+ cells (right; unpaired Student t test). Representative FACS plots (left) of the bone marrow show the gating strategy to assess the percentage of fluorescent cells. NSG, NOD.Cg-PrkdcscidIl2rgtm1Wjl /SzJ; SSC, side scatter.
Discussion
Since the discovery of numerous highly conserved intergenic and antisense lncRNAs within the HOX clusters, it has been postulated that HOX lncRNAs exert significant control over the proper spatial and temporal expression of HOX genes.39,40 The precise expression of HOX genes is essential for normal development, and their deregulation is causal for various diseases, including leukemia. Here, we introduce HOXA10-AS as a HOX lncRNA that is highly expressed in HSCs and KMT2A-r leukemias. We show that it regulates normal myeloid differentiation and contributes to the pathogenesis of KMT2A-r leukemias by inducing NF-κB target genes. Moreover, we established HOXA10-AS expression as a prognostic marker (although not independent) in both pediatric and adult AML, where it can be used to group patients according to their underlying genetic background and risk level. Lastly, we provide a proof of concept for potential therapeutic targeting of HOXA10-AS.
Since KMT2A rearrangement is the most frequent structural cytogenetic aberration in children with AML, KMT2A-r leukemias are a highly relevant subtype for scientific and clinical research. lncRNAs present a new opportunity to understand, classify, and treat these AMLs, and in keeping with this theme, we found HOXA10-AS to be significantly involved in the maintenance of KMT2A-r leukemia. We provide several lines of evidence using complementary gain- and loss-of-function approaches in different in vitro and in vivo systems to support HOXA10-AS as an essential lncRNA in KMT2A-r AMLs. In primary KMT2A-r blasts and ML-2 cells, overexpression of HOXA10-AS enhanced leukemic growth. Inversely, we observed significantly reduced leukemic growth upon shRNA-mediated knockdown of HOXA10-AS in KMT2A-r compared with non-KMT2A-r cell lines, suggesting the dependency of KMT2A-r AMLs on high HOXA10-AS expression. For further confirmation, we additionally used CRISPR/Cas9 to excise the HOXA10-AS promoter and transcription start site in vitro, which yielded similar results as the above approaches. LNA-GapmeR–mediated HOXA10-AS downregulation also led to decreased proliferation in KMT2A-r leukemic cells compared with non-KMT2A-r cells. LNA-GapmeRs can be taken up by cells via gymnosis,26 eliminating the need for delivery vehicles and thus making them an elegant therapeutic option for patients with KMT2A-r AML. To advance this idea, we provided a proof of concept for therapeutic targeting of HOXA10-AS: patient-derived AML blasts transduced with shRNAs against HOXA10-AS were outcompeted by their control-transduced counterparts in vivo. These experiments pave the way for future preclinical studies with anti-HOXA10-AS therapeutics.
Pediatric AML patients with KMT2A-r tend to be younger and predominantly present with a monocytic/monoblastic subtype.41 In line with this, lentiviral HOXA10-AS expression in CD34+ HSPCs caused a significant block of monocytic differentiation. Aberrant HOX expression is a hallmark of KMT2A-r leukemias, and the contribution of several HOXA genes and miR-196b to KMT2A-r leukemogenesis has been previously described.15-17 Many lncRNAs have been shown to act as local regulators influencing the expression of nearby genes.33 Moreover, other HOX lncRNAs such as HOTTIP and HOTAIR reportedly act in cis or trans to directly regulate the expression of HOX genes.11,13 For example, forced expression of HOTAIR causes genome-wide expression changes in epithelial cancer cells, thereby increasing breast cancer invasiveness and metastasis via a mechanism that is still under debate.42,43 In contrast, HOTTIP coordinates the activation of several 5′ HOXA genes in cis by directing the WDR5/MLL complexes.13 Therefore, we first evaluated the effect of HOXA10-AS perturbation on antisense HOX genes and miR-196b. However, using shRNA-mediated knockdown and genetically clean CRISPR/Cas9 excision of the transcription start site, we could not prove a local regulatory function of HOXA10-AS. These data together with data showing cytoplasmic localization of HOXA10-AS and the transcriptional changes induced upon its lentiviral expression favor a model wherein HOXA10-AS regulates gene expression in trans. Via global gene expression analysis, we saw that HOXA10-AS activated several NF-κB target genes. NF-κB is constitutively active in many AML cases, particularly in monocytic/monoblastic leukemias, and has been suggested as a therapeutic target.44-46 Corroborating NF-κB as a possible target of HOXA10-AS, we demonstrated increased p65 phosphorylation, an indicator of NF-κB activation, in HOXA10-AS–overexpressing ML-2 cells. In addition, inhibiting the NF-κB pathway using the IκB kinase inhibitor BMS-345541 rescued the growth advantage in HOXA10-AS–overexpressing ML-2 cells as well as the monocytic differentiation block induced by ectopic HOXA10-AS in HSPCs. These results indicate that aberrant activation of the NF-κB pathway might be a mechanism through which HOXA10-AS overexpression blocks monocytic differentiation in HSPCs and contributes to the oncogenic phenotype of KMT2A-r cells, which mainly manifest as monocytic/monoblastic leukemias. Although exact mechanisms have yet to be fully elucidated, our work adds HOXA10-AS to the list of lncRNAs within the HOX clusters that coordinate gene expression and crucial signaling pathways.
In conclusion, our work uncovers HOXA10-AS as an important regulator of HSC homeostasis and hematopoietic differentiation and as a potential therapeutic target for KMT2A-r AMLs, given its essentiality in this cytogenetic subtype. These findings place HOXA10-AS among the growing list of functionally validated lncRNAs with crucial roles in normal and malignant hematopoiesis and in the broader scope provides further evidence of the significance of lncRNAs to pathophysiological processes.
Acknowledgments
The authors thank D. Trono of EPFL, Lausanne, Switzerland, for kindly providing both pMD2.G (Addgene plasmid 12259) and psPAX2 (Addgene plasmid 12260).
This work was supported by funding to J.-H.K. from the European Research Council under the European Union’s Horizon 2020 research and innovation program (grant agreement 714226). J.-H.K. is a recipient of the St. Baldrick’s Robert J. Arceci Innovation Award. D.H and S.A.-K. are supported by German Cancer Aid (grants 111743 and 70112219).
Authorship
Contribution: S.A.-K. performed experiments, analyzed the data, and wrote the manuscript; R.B., M.N., L.V., and S.E. performed experiments, analyzed the data, and revised the manuscript; L.G. performed experiments; A.S. analyzed and interpreted the data and revised the manuscript; T.S. provided material and/or data and revised the manuscript; and D.H. and J.-H.K. designed the study, analyzed and interpreted the data, wrote the manuscript, and academically drove the project.
Conflict-of-interest disclosure: The authors declare no competing financial interests.
Correspondence: Jan-Henning Klusmann, Pediatric Hematology and Oncology, Martin Luther University Halle-Wittenberg, Ernst-Grube-Str 40, 06120 Halle, Germany; e-mail: jan-henning.klusmann@uk-halle.de; and Dirk Heckl, Pediatric Hematology and Oncology, Martin Luther University Halle-Wittenberg, Ernst-Grube-Str 40, 06120 Halle; e-mail: dirk.heckl@uk-halle.de.

