

Key Points
Atovaquone induces AML blast apoptosis and prolongs survival in AML xenografts.
Atovaquone induces proapoptotic signaling and inhibits the mTOR pathway through upregulation of ATF4 and also suppresses OXPHOS.

Abstract
Atovaquone, a US Food and Drug Administration–approved antiparasitic drug previously shown to reduce interleukin-6/STAT3 signaling in myeloma cells, is well tolerated, and plasma concentrations of 40 to 80 µM have been achieved with pediatric and adult dosing. We conducted preclinical testing of atovaquone with acute myeloid leukemia (AML) cell lines and pediatric patient samples. Atovaquone induced apoptosis with an EC50 <30 µM for most AML lines and primary pediatric AML specimens. In NSG mice xenografted with luciferase-expressing THP-1 cells and in those receiving a patient-derived xenograft, atovaquone-treated mice demonstrated decreased disease burden and prolonged survival. To gain a better understanding of the mechanism of atovaquone, we performed an integrated analysis of gene expression changes occurring in cancer cell lines after atovaquone exposure. Atovaquone promoted phosphorylation of eIF2α, a key component of the integrated stress response and master regulator of protein translation. Increased levels of phosphorylated eIF2α led to greater abundance of the transcription factor ATF4 and its target genes, including proapoptotic CHOP and CHAC1. Furthermore, atovaquone upregulated REDD1, an ATF4 target gene and negative regulator of the mechanistic target of rapamycin (mTOR), and caused REDD1-mediated inhibition of mTOR activity with similar efficacy as rapamycin. Additionally, atovaquone suppressed the oxygen consumption rate of AML cells, which has specific implications for chemotherapy-resistant AML blasts that rely on oxidative phosphorylation for survival. Our results provide insight into the complex biological effects of atovaquone, highlighting its potential as an anticancer therapy with novel and diverse mechanisms of action, and support further clinical evaluation of atovaquone for pediatric and adult AML.
Introduction
Acute myeloid leukemia (AML) is diagnosed in >20 000 patients annually in the United States, and although there have been significant improvements in cure rates in the last 50 years, >50% of patients still die as a result of their disease. For decades, efforts to improve survival have focused on increasing the dose intensity of chemotherapy, resulting in moderately improved survival but also substantial toxicity.1 Standard therapy for adult and pediatric AML still consists of cytarabine and anthracyclines.
In 2016, we reported that atovaquone, a US Food and Drug Administration–approved antimicrobial and antiparasitic drug, has antitumor activity in multiple myeloma and AML.2 Adults with AML who received atovaquone for Pneumocystis jiroveci pneumonia (PJP) prophylaxis after bone marrow transplantation were shown to have lower relapse rates than those who received alternative prophylaxis.2 In addition to inhibiting interleukin-6 (IL-6)–induced activation of signal transducer and activation of transcription 3 (STAT3), atovaquone has also been reported to reduce tumor hypoxia, thereby sensitizing cancer cells to subsequent radiation treatment.3 Atovaquone inhibits oxidative phosphorylation in neoplastic (but not normal) cells, an effect that is postulated to target cancer stem-like cells,4 and may synergize with conventional chemotherapeutic and immunotherapeutic agents.5 Taken together, these results suggest that atovaquone affects the biology of the cancer cell in multiple ways, which, if better understood, may be exploited for therapeutic benefit. Given the potential to rapidly integrate atovaquone into clinical trials for patients with AML, we sought to further define its mechanism and activity in this disease.
Materials and methods
Patient samples
Diagnostic bone marrow or pheresis samples from 12 pediatric patients with AML were obtained from the Children’s Oncology Group and from Texas Children’s Hospital. Available samples were selected to ensure that common cytogenetic groups were included. Viably frozen mononuclear cells from healthy pediatric sibling bone marrow donors at Texas Children’s Hospital between 2017 and 2019 were used as controls. Mononuclear cells from the bone marrow aspirate or pheresis material were enriched by density centrifugation and frozen in dimethyl sulfoxide–containing medium in liquid nitrogen. All patients initially received treatment on or according to Children’s Oncology Group protocol AAML0531 or AAML1031.6,7 Samples used for annexin V–based assays were confirmed to have at least 60% viability after thawing. All patients or guardians provided written informed consent for the use of tissue for research purposes in accordance with the Declaration of Helsinki. These studies were approved by the Institutional Review Board of Baylor College of Medicine. Relevant patient characteristics are listed in Table 1.
Patient data by UPN
| UPN | Age, y/sex* | Sample type | FAB | Blasts in sample, % | Cytogenetics | Mutations† | MRD at end induction, %‡ | Relapse | Clinical outcome§ |
|---|---|---|---|---|---|---|---|---|---|
| AML1 | 10.4/F | Pheresis | M0/M1 | 90 | t(16;21) | Unknown | 1.3 | Yes | DD |
| AML2 | 12.9/M | Pheresis | M5 | 90 | t(6;11) | Negative | 0 | Yes | DD |
| AML3 | 1.3/M | Pheresis | M5 | 88 | Ins(10;11) | Negative | 0 | Yes | DD |
| AML4 | 1.5/M | Pheresis | M4 | 40 | Normal | FLT3; AR, 0.04 | 22 | Yes | DD |
| AML5 | 12.3/F | Pheresis | M4 | 65 | Normal | Negative | 0 | No | Death from toxicity |
| AML6 | 6.9/F | BM | M2 | 40 | t(8;21) | Negative | 0 | Yes | Alive in second CR‖ |
| AML7 | 9.7/F | BM | M5 | 95 | t(10;11)(p11.2;q23) | Negative | 0.1 | Yes | DD |
| AML8 | 16.7/F | BM | M1 | 70 | +10 | Negative | 0 | Yes, CNS EOI1 | DD |
| AML9 | 16.8/M | BM | M2 | 70 | Normal | NPM1+ | 0 | No | Alive |
| AML10 | 18.1/M | BM | NR | 90 | +8 | FLT3; AR, 0.79 | 4.20 | Refractory EOI2 | Alive |
| AML11 | 15.7/M | BM | M1 | 82 | t(10;16) | Negative | 0 | Yes | Alive |
| AML12 | 18.9/M | BM | NR | 69 | Complex | Negative | Unknown, CR‖ | Yes | DD |
| NBM1 | 13.9/F | BM | |||||||
| NBM2 | 15.9/M | BM | |||||||
| NBM3 | 12.8/F | BM | |||||||
| NBM4 | 10.1/F | BM | |||||||
| NBM5 | 3.9/M | BM | |||||||
| NBM6 | 3.64/F | BM | |||||||
| NBM7 | 2.32/M | BM | |||||||
| NBM8 | 11.1/F | BM |
AR, allelic ratio; BM, bone marrow; CR, complete remission; DD, death from disease; EOI, end of induction; FAB, French-American-British; F, female; M, male; MRD, minimal residual disease; NR, not reported; UPN, unique patient number.
Age at time of initial diagnosis.
Mutations tested: FLT3-ITD, NPM1, and CEBPA.
MRD by flow cytometry.
Outcome column indicates status at last contact.
CR by morphology.
Cell lines
Cell lines and mouse embryonic fibroblasts (MEFs) were obtained from the American Type Culture Collection (Manassas, VA) or colleagues (supplemental Table 1). The human bone marrow stromal cell line HS5 was used to mimic the supportive conditions provided by soluble factors within the bone marrow microenvironment.8 All cell lines used were validated by short tandem repeat authentication at least annually.
Reagents
Atovaquone was purchased from Sigma (A7986) for in vitro work and purchased from Amneal Pharmaceuticals for in vivo studies. Antibodies to phosphorylated (phospho) S6 (2215), total S6 (2217), phospho–4E-BP1 (9451), total 4E-BP1 (9644), phospho-eIF2α (9721), total eIF2α (5324), and ATF4 (11815) were from Cell Signaling Technology. REDD1 antibody was from Proteintech (10638-1-AP). Antibodies to tubulin (T5168) and β actin (A5316) were from Sigma. Fluorochrome-conjugated antibody to pS6-AF647 (Ser240/244) was from Cell Signaling Technologies, CD130–AlexaFluor 488 was from Abcam, and pY-STAT3-PE and isotype control were from BD Biosciences. Rapamycin (553210) was obtained from Millipore, and tunicamycin (T7765) and thapsigargin (T9033) were from Sigma-Aldrich. Control small interfering RNA (siRNA; D-001210-02) and REDD1 siRNA (M-010855-01) were from Thermo Scientific Dharmacon.
Annexin V and phosphoflow assays
AML cell lines were incubated with phosphate-buffered saline (vehicle) or increasing doses of atovaquone (1-30 µM) for 24 to 96 hours. Primary samples with baseline viability >60% were treated with 30 µM of atovaquone dissolved in medium or vehicle control (VC) for 24 to 96 hours. Primary samples were supported in vitro with HS5 conditioned medium (CM) or cocultured with HS5 cells separated by a polyester transwell membrane (TW) with a 0.4-µm pore size (Corning, Fisher Scientific) or cultured alone in standard Iscove modified Dulbecco medium with 20% fetal bovine serum. Apoptosis was quantified by annexin V–fluorescein isothiocyanate and propidium iodide positivity, and phosphoflow was conducted as previously described.9
Xenografts
Eleven 5- to 7-week-old female NOD scid IL2Rγ−/− (NSG) mice and 14 7- to 9-week-old male NSG mice were injected by tail vein with 5 × 10⁵ THP-1 cells expressing firefly luciferase (THP-1.ffluc). Treatment with atovaquone (200 mg/kg per day; female, n = 5; male, n = 7) or VC (female, n = 6; male, n = 7) by daily oral gavage began on the day of cell injection. Bioluminescent imaging (in vivo imaging system) was used to quantitate disease burden. Male mice were followed for survival and euthanized when they demonstrated signs of illness. For the patient-derived xenograft (PDX), 18 7- to 9-week-old NSG mice (male, n = 8; female, n = 10) were injected by tail vein with 1.2 × 10⁶ primary AML cells (sample AML3). Mice were randomized into treatment and control groups, each with 4 male and 5 female mice, and treated by daily oral gavage as described. For PDX mice, disease burden was assessed by peripheral blood human CD45-PE and CD33-PerCP-Cy7 positivity by flow cytometry every 1 to 2 weeks once signs of engraftment were noted. Mice were followed for survival as described.
Drug combination assays
THP-1.ffluc cells were plated at 103 to 104 per well in 96-well plates with medium only, single drugs at increasing concentrations, and atovaquone plus chemotherapy combinations (atovaquone, 1-15 µM; cytarabine, 0.1-3 µM; daunorubicin, 0.03-0.6 µM; CPX-351, 0.04-0.6 µM; etoposide, 0.3-3 µM). After 48 hours, viability was determined by luminescence (Luminoskan Ascent; Thermo Electron). Background luminescence in medium-only wells was subtracted from all values, and means of 4 replicates were used for analysis. All values were normalized to cells plus vehicle wells, which were set to 0 to quantify percentage affected. Calcusyn was used to calculate the combination index (CI).10 An atovaquone plus chemotherapy combination was considered synergistic if CI < 0.7, additive if CI > 0.7 and < 1.3, or antagonistic if CI > 1.3. Three independent experiments were performed for each combination.
Gene expression microarray and RNAseq
For gene expression microarrays, RNA was isolated by Trizol, purified on RNeasy columns (Qiagen), and profiled using Affymetrix Human Gene 1.0 ST arrays. For RNA sequencing (RNAseq), RNA was isolated with Total RNA Miniprep (Promega). RNA was sequenced using Illumina NovoSeq 6000 by Novogene using 50 million 150-bp pair-end reads per sample, and sequences were trimmed using Trimmomatic11 at the default setting (version 0.33). All samples passed quality control by fastQC (version 0.11.3) and were aligned to the hg38 reference genome using STAR (version 2.4) at the default setting.12 Sequences (paired fastq files) were deposited in the European Nucleotide Archive under project PRJEB30326.
Western blot
Western blots were performed as previously described.13 Details on the dose and duration of atovaquone exposure for each cell line are provided in figure legends.
RT-PCR
For determination of the effect of atovaquone on proteins within the unfolded protein response (UPR) pathway, Kasumi-1, MV4-11, and K562 cells were treated with vehicle, atovaquone (20 μM), thapsigargin (1 μM), or tunicamycin (5 μg/mL) for 6 hours, followed by quantitative reverse transcription polymerase chain reaction (RT-PCR) as previously described.8 Gene expression (normalized to 18S ribosomal RNA) was analyzed in duplicate or triplicate, using indicated primers (supplemental Table 2).
OCR measurements
Oxygen consumption rate (OCR) was measured using the Seahorse XF96 analyzer (Seahorse Bioscience). Plates were coated with Cell-Tak (Fisher Scientific), and AML or normal bone marrow cells were then seeded after being suspended in Seahorse medium. OCR was measured sequentially before and after injection of oligomycin (1 µM), carbonyl cyanide-4-(trifluromethoxy) phenylhydrazone (0.5 or 1 µM for cell lines or primary samples, respectively), and antimycin A (1 µM) and rotenone (1 µM; Sigma-Aldrich).
Statistics
Statistical analysis was performed using GraphPad Prism software (version 6.05; GraphPad Software, La Jolla, CA). Data represent means ± standard errors of the mean unless otherwise stated. Significance of observed differences between atovaquone- and vehicle-treated samples in vitro and in vivo was determined by analysis of variance to compare all samples at all tested time points. For in vivo survival analyses, Kaplan-Meier survival curves were generated and compared for significant differences by the log-rank test.
Results
Atovaquone induces time- and dose-dependent apoptosis of AML cells lines and primary samples
The antileukemia effects of atovaquone at clinically achievable doses were tested in 6 AML cell lines, 2 precursor B acute lymphoid leukemia cell lines, and 1 chronic myeloid leukemia cell line. Atovaquone induced both dose- and time-dependent apoptosis of all tested cell lines (Figure 1A-I). Importantly, although the degree of apoptosis varied, all acute leukemia cell lines demonstrated atovaquone-induced cell death at clinically achievable concentrations.
![Exposure to atovaquone induces time- and dose-dependent apoptosis of leukemia cell lines at clinically achievable concentrations. AML cell lines (THP-1 [A], MOLM13 [B], MV4-11 [C], NB4 [D], HL60 [E], and Kasumi-1 [F]), precursor B-cell lines (NALM6 [G] and RS4;11 [H]), and a chronic myeloid leukemia cell line (K562 [I]) were incubated with vehicle or the indicated dose of atovaquone for the times shown. Apoptosis was quantified by annexin V staining and flow cytometry. Means and standard errors of the mean are depicted (n = 3 for each cell line). FITC, fluorescein isothiocyanate; PBS, phosphate-buffered saline.](https://ash.silverchair-cdn.com/ash/content_public/journal/bloodadvances/3/24/10.1182_bloodadvances.2019000499/2/m_advancesadv2019000499f1.png?Expires=1767819710&Signature=ub6y3NZK~ibqbAGpNZj-454LiI~3MNoydxLrqJe5R8oYhx3dAQjLTa5oZ4mel74g-c5S0AD6LlF1gmKt68qcI9MBVQYgt~OlAFa2TXm4hcWvAepq2ziPJK777f9qmDH9I8v2y34hXZLUiy44x2ChQEQyENhSZE6LQbOF-1aJ8UGy-srpoKknM1-QBN9qCRRP8iaJxfTPbWLCBUyF-hmrbqzgyzCHjL0scnwTT2KtZtNKL8QzXa1DxekUWurjXAULDptzEZ3Sr6n9mZgjlnxJnOJE2lxXpkNc0ngiejpZIs5AG5xaha2~pTSe9lBLemkSOb8UOMwOzbveYNnfi8jqxA__&Key-Pair-Id=APKAIE5G5CRDK6RD3PGA)
Exposure to atovaquone induces time- and dose-dependent apoptosis of leukemia cell lines at clinically achievable concentrations. AML cell lines (THP-1 [A], MOLM13 [B], MV4-11 [C], NB4 [D], HL60 [E], and Kasumi-1 [F]), precursor B-cell lines (NALM6 [G] and RS4;11 [H]), and a chronic myeloid leukemia cell line (K562 [I]) were incubated with vehicle or the indicated dose of atovaquone for the times shown. Apoptosis was quantified by annexin V staining and flow cytometry. Means and standard errors of the mean are depicted (n = 3 for each cell line). FITC, fluorescein isothiocyanate; PBS, phosphate-buffered saline.
Exposure to atovaquone induces time- and dose-dependent apoptosis of leukemia cell lines at clinically achievable concentrations. AML cell lines (THP-1 [A], MOLM13 [B], MV4-11 [C], NB4 [D], HL60 [E], and Kasumi-1 [F]), precursor B-cell lines (NALM6 [G] and RS4;11 [H]), and a chronic myeloid leukemia cell line (K562 [I]) were incubated with vehicle or the indicated dose of atovaquone for the times shown. Apoptosis was quantified by annexin V staining and flow cytometry. Means and standard errors of the mean are depicted (n = 3 for each cell line). FITC, fluorescein isothiocyanate; PBS, phosphate-buffered saline.
We next sought to validate the finding seen in AML cell lines with primary pediatric AML samples. To help minimize spontaneous apoptosis of primary AML blasts during prolonged incubations and approximate the bone marrow microenvironment, we used the human stromal cell line HS5, which secretes >15 cytokines and growth factors to support AML cells.8 We cultured AML cells in HS5 CM or cocultured them with HS5 stromal cells separated by a TW. Primary cells were also tested in standard Iscove modified Dulbecco medium. In total, 12 primary pediatric AML samples were included in this analysis. Patient characteristics are listed in Table 1. For primary blasts cultured in standard medium with fetal bovine serum, little atovaquone-induced apoptosis was seen (supplemental Figure 1). One contributing factor was that many samples had high baseline rates of apoptosis without stromal support. However, in the presence of HS5 CM or TW, atovaquone induced apoptosis in all tested samples (Figure 2; supplemental Figures 2 and 3), and the degree of this apoptosis was significantly higher than that in vehicle-treated cells (analysis of variance P < .0001). Typically, stromal support reduces drug-induced apoptosis,8,14 making this finding particularly intriguing and potentially clinically relevant.
![Atovaquone induces apoptosis of pediatric patient AML blasts but not normal bone marrow samples and produces an additive effect in combination with cytarabine, daunorubicin, and CPX-351. (A) Twelve primary pediatric AML samples supported with HS5 TW coculture demonstrated increased apoptosis over time when treated with 30 μM of atovaquone. For 3 representative samples, the percentage of annexin V+/propidium iodidepositive (PI+) is shown for VC and atovaquone-treated wells at each time point to demonstrate the difference between spontaneous apoptosis and atovaquone-induced apoptosis. The panel to the right depicts means and standard errors of the mean (SEMs) for all 12 samples. Apoptosis rates were significantly different in primary samples exposed to atovaquone when compared with vehicle (P < .0001 by analysis of variance [ANOVA]). (B) In comparison, 3 normal bone marrow (NBM) samples supported with HS5 TW coculture demonstrated no significant increase in apoptosis over time when treated with 30 μM of atovaquone compared with vehicle. The panel to the right depicts means and SEMs for all 3 samples. (C) Representative normalized isobolograms demonstrating an additive effect of atovaquone in combination with either cytarabine, daunorubicin, or CPX-351 and a slightly antagonistic effect in combination with etoposide. For the depicted plots, median CI for atovaquone with cytarabine was 0.925; for atovaquone with daunorubicin, 1.1335; for atovaquone with CPX-351, 0.822; and for atovaquone with etoposide, 1.515. These combinations were tested using THP-1.ffluc cells, and plots are the product of 4 technical replicates. The table depicts median CI of 3 biologic replicates for each drug combination as well as the average median CI for each combination.](https://ash.silverchair-cdn.com/ash/content_public/journal/bloodadvances/3/24/10.1182_bloodadvances.2019000499/2/m_advancesadv2019000499f2.png?Expires=1767819710&Signature=tFlNQVvmjRJzt9pU8kL8NInRKbaaAXs30ktJWlACTzqiykvsdWCqwpjFrAruKt426afIhgO626KZbyZsAr0lNM~NlABN-GNLCCLUpq5oCTALbth8SwA287echOTdWK1ZtTRXc4yM3vRXTMjfE7h2I5HqeBQDQpD5xxv-qQg2sam~VeYgha6i0~wmKfyG-EhF92U3kfAjwbb1oCoDdjSK0NZQ0JeafdlVSAPQLsXmZSWmUuPePAZvBHet41swEHEMlgICjpiU-uEsdm9zvE~xrb~KJ9bFzT36WCtYvoRudBTa89neZpFRz7x2e25zDeoE5iPoS0THuqY9Gu3jgZ4WPg__&Key-Pair-Id=APKAIE5G5CRDK6RD3PGA)
Atovaquone induces apoptosis of pediatric patient AML blasts but not normal bone marrow samples and produces an additive effect in combination with cytarabine, daunorubicin, and CPX-351. (A) Twelve primary pediatric AML samples supported with HS5 TW coculture demonstrated increased apoptosis over time when treated with 30 μM of atovaquone. For 3 representative samples, the percentage of annexin V+/propidium iodidepositive (PI+) is shown for VC and atovaquone-treated wells at each time point to demonstrate the difference between spontaneous apoptosis and atovaquone-induced apoptosis. The panel to the right depicts means and standard errors of the mean (SEMs) for all 12 samples. Apoptosis rates were significantly different in primary samples exposed to atovaquone when compared with vehicle (P < .0001 by analysis of variance [ANOVA]). (B) In comparison, 3 normal bone marrow (NBM) samples supported with HS5 TW coculture demonstrated no significant increase in apoptosis over time when treated with 30 μM of atovaquone compared with vehicle. The panel to the right depicts means and SEMs for all 3 samples. (C) Representative normalized isobolograms demonstrating an additive effect of atovaquone in combination with either cytarabine, daunorubicin, or CPX-351 and a slightly antagonistic effect in combination with etoposide. For the depicted plots, median CI for atovaquone with cytarabine was 0.925; for atovaquone with daunorubicin, 1.1335; for atovaquone with CPX-351, 0.822; and for atovaquone with etoposide, 1.515. These combinations were tested using THP-1.ffluc cells, and plots are the product of 4 technical replicates. The table depicts median CI of 3 biologic replicates for each drug combination as well as the average median CI for each combination.
Atovaquone induces apoptosis of pediatric patient AML blasts but not normal bone marrow samples and produces an additive effect in combination with cytarabine, daunorubicin, and CPX-351. (A) Twelve primary pediatric AML samples supported with HS5 TW coculture demonstrated increased apoptosis over time when treated with 30 μM of atovaquone. For 3 representative samples, the percentage of annexin V+/propidium iodidepositive (PI+) is shown for VC and atovaquone-treated wells at each time point to demonstrate the difference between spontaneous apoptosis and atovaquone-induced apoptosis. The panel to the right depicts means and standard errors of the mean (SEMs) for all 12 samples. Apoptosis rates were significantly different in primary samples exposed to atovaquone when compared with vehicle (P < .0001 by analysis of variance [ANOVA]). (B) In comparison, 3 normal bone marrow (NBM) samples supported with HS5 TW coculture demonstrated no significant increase in apoptosis over time when treated with 30 μM of atovaquone compared with vehicle. The panel to the right depicts means and SEMs for all 3 samples. (C) Representative normalized isobolograms demonstrating an additive effect of atovaquone in combination with either cytarabine, daunorubicin, or CPX-351 and a slightly antagonistic effect in combination with etoposide. For the depicted plots, median CI for atovaquone with cytarabine was 0.925; for atovaquone with daunorubicin, 1.1335; for atovaquone with CPX-351, 0.822; and for atovaquone with etoposide, 1.515. These combinations were tested using THP-1.ffluc cells, and plots are the product of 4 technical replicates. The table depicts median CI of 3 biologic replicates for each drug combination as well as the average median CI for each combination.
For comparison, we evaluated the effect of atovaquone on 5 normal pediatric bone marrow samples. Atovaquone did not induce apoptosis in normal bone marrow cells in TW (n = 3; Figure 2) or CM conditions (n = 5; supplemental Figure 4), suggesting that atovaquone may have antileukemia effects while sparing normal hematopoietic cells.
Drug combination assays of atovaquone with traditional cytotoxic agents demonstrate additive effects
Next, we evaluated the pharmacological interactions of atovaquone with conventional AML chemotherapy agents using a standard isobologram approach.10 We used normalized luminescence values as a readout of viable cell number for THP-1.ffluc cells, following the concept of an MTT assay.15 For THP-1.ffluc cells, atovaquone in combination with cytarabine, daunorubicin, and CPX-351 produced an additive effect, with combination indices of 1.017, 1.13, and 0.859, respectively (Figure 2C). In comparison, the combination of atovaquone and etoposide produced a near-antagonistic effect, with an average median CI of 1.27 (Figure 2C).
Atovaquone reduces disease burden and prolongs survival in an AML cell line xenograft
To determine if the effects of atovaquone seen in vitro extended to an in vivo model, we compared disease burden and survival of mice engrafted with THP-1.ffluc cells and randomized to receive either atovaquone or VC. Because atovaquone reaches steady-state plasma concentrations after ∼12 days of enteric dosing, we began treatment with oral gavage at the time of cell injection. Mice were injected by tail vein with 5 × 10⁵ THP-1.ffluc cells. Compared with control, atovaquone-treated mice demonstrated a trend toward reduced disease burden by noninvasive imaging (n = 11 female mice; Figure 3A-B). A second cohort had reduced burden starting on day 23 (n = 14 male mice; Figure 3C-D). Atovaquone-treated mice had a median survival of 79 days, compared with 63 days for VC mice (P = .003; Figure 3E). Mice demonstrated no weight loss or other clinically observable adverse effects from daily dosing of atovaquone.

Exposure to atovaquone reduces disease burden and prolongs survival in a xenograft model of AML. (A-B) Female NSG mice were injected by tail vein with 5 × 10⁵ THP-1.ffluc cells. Treatment with atovaquone (AQ; 200 mg/kg; n = 6) or VC (n = 5) by daily oral gavage began on the day of cell injection. Bioluminescent imaging demonstrated decreased disease burden in AQ-treated mice. These mice were not followed for survival. (C-D) Male NSG mice were injected by tail vein with 5 × 10⁵ THP-1.ffluc cells. Treatment with AQ (200 mg/kg per day; n = 7) or VC (n = 7) by daily oral gavage began on the day of cell injection. Bioluminescent imaging demonstrated decreased disease burden at the time points noted (curves were significantly different by analysis of variance P = .0069). (E) Male AQ-treated mice had significantly prolonged survival compared with controls. *P < .05 by Student t test.
Exposure to atovaquone reduces disease burden and prolongs survival in a xenograft model of AML. (A-B) Female NSG mice were injected by tail vein with 5 × 10⁵ THP-1.ffluc cells. Treatment with atovaquone (AQ; 200 mg/kg; n = 6) or VC (n = 5) by daily oral gavage began on the day of cell injection. Bioluminescent imaging demonstrated decreased disease burden in AQ-treated mice. These mice were not followed for survival. (C-D) Male NSG mice were injected by tail vein with 5 × 10⁵ THP-1.ffluc cells. Treatment with AQ (200 mg/kg per day; n = 7) or VC (n = 7) by daily oral gavage began on the day of cell injection. Bioluminescent imaging demonstrated decreased disease burden at the time points noted (curves were significantly different by analysis of variance P = .0069). (E) Male AQ-treated mice had significantly prolonged survival compared with controls. *P < .05 by Student t test.
Atovaquone slows disease progression and prolongs survival in a pediatric AML PDX model
To test atovaquone in a PDX model, 18 NSG mice (female, n = 10; male, n = 8; supplemental Table 2) were injected with 1.2 × 10⁶ patient-derived pheresis products (90% blasts; AML3) by tail vein and treated with atovaquone or vehicle as in the THP-1.ffluc in vivo model. Four mice were censored because of deaths unrelated to disease or treatment. Evidence of peripheral human CD45+/CD33+ AML cell engraftment was first noted on day 55 after cell injection. Atovaquone-treated mice again demonstrated decreased disease burden compared with control as shown in representative flow cytometry plots (Figure 4A). The peripheral blast percentages for atovaquone-treated and control mice were significantly different at each time point beginning on day 72 (Figure 4B; supplemental Figure 5A). Mice continued on treatment until they showed signs of clinical illness. Female mice became ill sooner than male mice, with an average time to morbidity of 119 days for female vs 133 days for male vehicle-treated mice. For atovaquone-treated mice, the average time to clinical illness was 159 days for female vs 163 days for male mice. Survival was significantly improved in mice exposed to atovaquone compared with control (log-rank P = .0004; Figure 4C; supplemental Figure 5B).
![Treatment with atovaquone as a single agent delays engraftment and reduces disease burden in a PDX model. NSG mice were injected by tail vein with 1.2 × 10⁶ cells from primary patient sample AML3. Treatment with atovaquone (200 mg/kg per day; n = 7 [female, n = 4; male, n = 3]) or VC (n = 9 [female, n = 5; male, n = 4]) by daily oral gavage began on the day of cell injection. (A) Representative dot plots of human CD45 and CD33 at 2 time points (days 72 and 106) are shown for 1 vehicle-treated and 1 atovaquone-treated mouse. Depicted mice were females from the same litter and were cohoused. (B) Composite flow cytometric data for human CD45 and CD33 for all treated mice demonstrated decreased peripheral blood disease burden in atovaquone-treated mice. Bars represent means and standard errors of the mean (P < .0001 by analysis of variance). (C) Survival analysis of the same cohort of mice demonstrated improved survival in atovaquone-treated mice compared with vehicle. *P < .05 by Student t test.](https://ash.silverchair-cdn.com/ash/content_public/journal/bloodadvances/3/24/10.1182_bloodadvances.2019000499/2/m_advancesadv2019000499f4.png?Expires=1767819710&Signature=d4r2JLjVFVKpiJ-2Uor8pJVLoWa~Az2UGvsxfXdXpru6ONGG3cif3~65OrVZ29TGVOgfux3BqXp8C8-1AAbog0vgQsR0iJn8fdJUiEKrCp4D8kn0Nnz9xWYyd~ED0fFCv8BU8hvkgxzOzqP4Yh6QG98V5aj-mutMMS42RJAus2OIqD9RCEkNEoJbp-d38XdmPv9QgWupBdX8BHvgeASOf5rkqZ6ZqUvJhOB5eDzcetrW~IySHRkrREKMvmm4nUganBicQsSb7vpFQRKfxEDvOrpu3AydSRPSFTLCYelXoUMvUnkS1t3IiKPJrip4OykIyVGG9UX29JL3D4zVFiufJw__&Key-Pair-Id=APKAIE5G5CRDK6RD3PGA)
Treatment with atovaquone as a single agent delays engraftment and reduces disease burden in a PDX model. NSG mice were injected by tail vein with 1.2 × 10⁶ cells from primary patient sample AML3. Treatment with atovaquone (200 mg/kg per day; n = 7 [female, n = 4; male, n = 3]) or VC (n = 9 [female, n = 5; male, n = 4]) by daily oral gavage began on the day of cell injection. (A) Representative dot plots of human CD45 and CD33 at 2 time points (days 72 and 106) are shown for 1 vehicle-treated and 1 atovaquone-treated mouse. Depicted mice were females from the same litter and were cohoused. (B) Composite flow cytometric data for human CD45 and CD33 for all treated mice demonstrated decreased peripheral blood disease burden in atovaquone-treated mice. Bars represent means and standard errors of the mean (P < .0001 by analysis of variance). (C) Survival analysis of the same cohort of mice demonstrated improved survival in atovaquone-treated mice compared with vehicle. *P < .05 by Student t test.
Treatment with atovaquone as a single agent delays engraftment and reduces disease burden in a PDX model. NSG mice were injected by tail vein with 1.2 × 10⁶ cells from primary patient sample AML3. Treatment with atovaquone (200 mg/kg per day; n = 7 [female, n = 4; male, n = 3]) or VC (n = 9 [female, n = 5; male, n = 4]) by daily oral gavage began on the day of cell injection. (A) Representative dot plots of human CD45 and CD33 at 2 time points (days 72 and 106) are shown for 1 vehicle-treated and 1 atovaquone-treated mouse. Depicted mice were females from the same litter and were cohoused. (B) Composite flow cytometric data for human CD45 and CD33 for all treated mice demonstrated decreased peripheral blood disease burden in atovaquone-treated mice. Bars represent means and standard errors of the mean (P < .0001 by analysis of variance). (C) Survival analysis of the same cohort of mice demonstrated improved survival in atovaquone-treated mice compared with vehicle. *P < .05 by Student t test.
Atovaquone inhibits the mTOR pathway by upregulating expression of REDD1
Interestingly, our assessment of the effects of atovaquone on AML cell lines showed that atovaquone significantly reduced the viability of several cell lines lacking IL-6–induced pY-STAT3 (ie, HL-60 and K562). Because gp130 surface expression and pY-STAT3 were preserved in several AML cell lines after atovaquone exposure (supplemental Figure 6), we hypothesized that atovaquone modulates an additional pathway related to cancer cell growth and survival distinct from gp130 downregulation.
To better understand the cellular effects of atovaquone and its broader mechanisms of action, we performed a gene expression microarray analysis in K562 (chronic myeloid leukemia) and U266 (multiple myeloma) cells. Although both of these cell lines display sensitivity to atovaquone, U266 exhibits constitutive STAT3 activation through autocrine secretion of IL-6,16 whereas K562 STAT3 activity is low. Using a 1.5-fold cutoff, atovaquone upregulated several hundred genes in each cell line; however, only 19 genes were upregulated in both cell lines. The 19 genes were further evaluated by quantitative RT-PCR in 5 additional cell lines sensitive to atovaquone, yielding a core set of 4 genes consistently upregulated by atovaquone: REDD1, ATF3, CHOP, and CHAC1 (Figure 5A). Of these genes, REDD1 is known to be a negative regulator of the mechanistic target of rapamycin (mTOR) pathway.17 Furthermore, we conducted RNAseq on 2 pediatric AML cell lines, THP-1 and Kasumi-1, and confirmed through Enrichr pathway analysis that the mTOR pathway was suppressed after 5 hours of exposure to atovaquone (supplemental Figure 7). We therefore hypothesized that atovaquone inhibits the mTOR pathway in a REDD1-dependent manner.
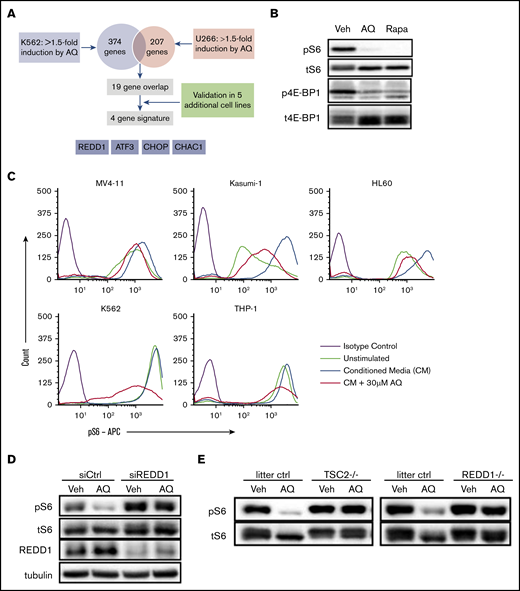
Atovaquone inhibits the mTOR pathway by inducing expression of REDD1, a TSC1/2-dependent negative regulator of mTOR kinase activity. (A) Schematic overview of the strategy to identify a gene expression signature associated with atovaquone (AQ) treatment. Validation was done in SK-BR-3, MDA-MB-468, INA-6, RPMI 8226, and MV4-11 cells. (B) K562 cells exposed to AQ (20 μM) or rapamycin (10 nM) for 5 hours were analyzed by western blot with the indicated antibodies. (C) AQ inhibits induction of pS6 across leukemia cell lines. Pretreatment with increasing concentrations of AQ for 5 hours demonstrates dose-dependent reductions in pS6 induced by 15 minutes of exposure to HS5 CM. (D) SKBR3 cells were transfected with control or REDD1-targeting siRNA for 48 hours, then treated with AQ (25 μM) for 4 hours, followed by western blotting with the indicated antibodies. (E) TSC2-null or REDD1-null MEFs, or MEFs from their respective littermate controls, were treated with AQ (25 μM) for 2.5 hours, followed by western blotting. All data are representative of at least 2 independent experiments.
Atovaquone inhibits the mTOR pathway by inducing expression of REDD1, a TSC1/2-dependent negative regulator of mTOR kinase activity. (A) Schematic overview of the strategy to identify a gene expression signature associated with atovaquone (AQ) treatment. Validation was done in SK-BR-3, MDA-MB-468, INA-6, RPMI 8226, and MV4-11 cells. (B) K562 cells exposed to AQ (20 μM) or rapamycin (10 nM) for 5 hours were analyzed by western blot with the indicated antibodies. (C) AQ inhibits induction of pS6 across leukemia cell lines. Pretreatment with increasing concentrations of AQ for 5 hours demonstrates dose-dependent reductions in pS6 induced by 15 minutes of exposure to HS5 CM. (D) SKBR3 cells were transfected with control or REDD1-targeting siRNA for 48 hours, then treated with AQ (25 μM) for 4 hours, followed by western blotting with the indicated antibodies. (E) TSC2-null or REDD1-null MEFs, or MEFs from their respective littermate controls, were treated with AQ (25 μM) for 2.5 hours, followed by western blotting. All data are representative of at least 2 independent experiments.
To assess the effect of atovaquone on the mTOR pathway, we performed immunoblotting for the phosphorylated forms of ribosomal protein S6, a downstream target of mTOR, and 4E-BP1, a direct mTOR substrate. We found that atovaquone significantly inhibited phosphorylation of both S6 and 4E-BP1 to an extent comparable to that with treatment with 10 nM of rapamycin, a direct inhibitor of mTOR (Figure 5B). To assess the extent to which atovaquone inhibits S6 phosphorylation under conditions similar to the bone marrow microenvironment, we stimulated cells with HS5 CM.8 We found that atovaquone reduced both the basal and induced phosphorylation of S6 in a dose-dependent manner across AML cell lines (Figure 5C), but not in a normal bone marrow sample (supplemental Figure 8). Pretreatment of cells with cycloheximide, a protein synthesis inhibitor, prevented these changes in S6 (supplemental Figure 9A) but had no effect on STAT3 inhibition (supplemental Figure 9B). Thus, unlike rapamycin, atovaquone is an indirect mTOR inhibitor.
On the basis of our previous gene expression screen, we hypothesized that the inducible factor responsible for inhibiting mTOR is REDD1. To determine if REDD1 is necessary for atovaquone-mediated inhibition of the mTOR pathway, we used siRNA to knock down REDD1 expression. We were unable to achieve sufficient knockdown of REDD1 in leukemia cells, so we employed adherent SKBR3 cells for these experiments, given the relative ease of introducing siRNA into these cells. Silencing of REDD1 largely prevented atovaquone-mediated inhibition of S6 phosphorylation (Figure 5D). Furthermore, the activity of REDD1 is known to be dependent on the TSC1/2 complex.17 We found that the inhibitory effect of atovaquone on S6 phosphorylation was completely abrogated in MEFs with knockout of TSC2 or REDD1 (Figure 5E). This suggests that atovaquone inhibits the mTOR pathway by inducing the expression of REDD1.
Atovaquone activates the phospho-eIF2α/ATF4 pathway upstream of REDD1
To understand how atovaquone induces REDD1 expression, we considered a possible role for the transcription factor ATF4, because all 4 genes consistently upregulated by atovaquone are downstream targets of ATF4.18,19 The activity of ATF4 is regulated primarily through the translation of its messenger RNA transcript, a process that is induced by phospho-eIF2α.20 Therefore, we hypothesized that atovaquone promotes phosphorylation of eIF2α and increases ATF4 protein upstream of REDD1.
By immunoblotting, we confirmed that atovaquone induced eIF2α phosphorylation at serine 51, concomitant with an increase in ATF4 protein levels, across multiple cancer cell lines (Figure 6A; supplemental Figure 10). Although ATF4 protein and its target genes (eg, ATF3 and CHOP) were induced, the expression of ATF4 messenger RNA was increased to a much lesser degree (Figure 6B). Our results suggest that the majority of the ATF4 increase occurs at the posttranscriptional level.21
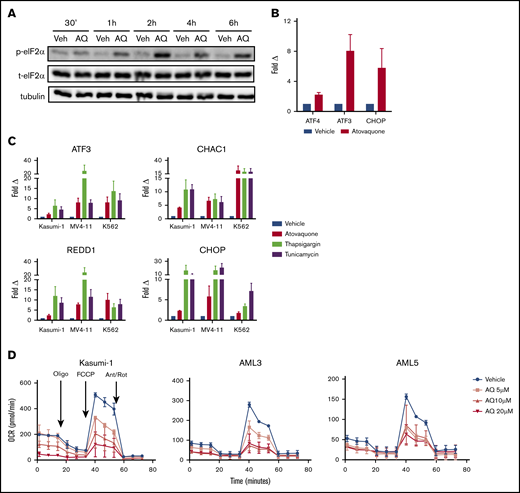
Atovaquone induces phosphorylation of eIF2α, upregulates ATF4-specific target genes, and suppresses OXPHOS in a dose-dependent fashion. (A) MOLM13 cells were treated with atovaquone (AQ; 25 μM) for the indicated times, then analyzed by western blotting. Data are representative of 2 independent experiments. (B) MV4-11 cells were treated with AQ (20 μM) for 6 hours, followed by quantitative RT-PCR (qRT-PCR) analysis. Data are means ± standard errors of the mean (SEMs) from 3 independent experiments. (C) AQ consistently upregulates the ATF4-specific target genes ATF3, CHAC1, CHOP, and REDD1. Kasumi-1, MV4-11, and K562 cells were treated with AQ (20 μM), thapsigargin (1 μM), or tunicamycin (5 μg/mL) for 6 hours, followed by qRT-PCR using the indicated primers. Data are means ± SEMs from 3 independent experiments. (D) AQ induced dose-dependent reductions in OCR of Kasumi-1 cells and the primary patient samples AML3 and AML5. Patient samples were rested in HS5 CM for 24 hours before a 3-hour incubation with the indicated doses of AQ. Data are means ± SEMs of 2 independent experiments. Ant/Rot, antimycin A/rotenone (complex 3 and 1 inhibitors, respectively); FCCP, carbonyl cyanide-4-(trifluromethoxy) phenylhydrazone (mitochondrial uncoupler); oligo, oligomycin (ATP synthase inhibitor).
Atovaquone induces phosphorylation of eIF2α, upregulates ATF4-specific target genes, and suppresses OXPHOS in a dose-dependent fashion. (A) MOLM13 cells were treated with atovaquone (AQ; 25 μM) for the indicated times, then analyzed by western blotting. Data are representative of 2 independent experiments. (B) MV4-11 cells were treated with AQ (20 μM) for 6 hours, followed by quantitative RT-PCR (qRT-PCR) analysis. Data are means ± standard errors of the mean (SEMs) from 3 independent experiments. (C) AQ consistently upregulates the ATF4-specific target genes ATF3, CHAC1, CHOP, and REDD1. Kasumi-1, MV4-11, and K562 cells were treated with AQ (20 μM), thapsigargin (1 μM), or tunicamycin (5 μg/mL) for 6 hours, followed by qRT-PCR using the indicated primers. Data are means ± SEMs from 3 independent experiments. (D) AQ induced dose-dependent reductions in OCR of Kasumi-1 cells and the primary patient samples AML3 and AML5. Patient samples were rested in HS5 CM for 24 hours before a 3-hour incubation with the indicated doses of AQ. Data are means ± SEMs of 2 independent experiments. Ant/Rot, antimycin A/rotenone (complex 3 and 1 inhibitors, respectively); FCCP, carbonyl cyanide-4-(trifluromethoxy) phenylhydrazone (mitochondrial uncoupler); oligo, oligomycin (ATP synthase inhibitor).
The phospho-eIF2α/ATF4 pathway may be activated in isolation or as a component of a coordinated process known as the UPR in the setting of endoplasmic reticulum stress. In addition to the phospho-eIF2α/ATF4 pathway, the other branches of the UPR consist of ATF6 cleavage and IRE1-mediated XBP1 splicing. Atovaquone did not induce ATF6 cleavage or spliced XBP1 (supplemental Figure 11). Furthermore, although atovaquone consistently induces targets downstream of ATF4 (ie, ATF3, CHAC1, CHOP, and REDD1; Figure 6C), it did not induce any other UPR target genes, in contrast to the canonical UPR activators tunicamycin and thapsigargin (supplemental Figure 12). Together, these data demonstrate that atovaquone selectively activates the phospho-eIF2α/ATF4 pathway and does not trigger the broad extent of the complete UPR (supplemental Figures 12 and 13).
We next conducted experiments to identify the eIF2α kinase responsible for eIF2α phosphorylation in the context of atovaquone exposure. Using MEFs in which all 4 known eIF2α kinases were deleted, we found that adding back HRI and PERK could mediate atovaquone-induced phospho-eIF2α (supplemental Figure 14). These results suggest redundancy and overlapping functions among the eIF2α kinases,20 where decreased activity of 1 eIF2α kinase can result in increased, compensatory activation of another.22-24
Atovaquone reduces OXPHOS in AML cells
Atovaquone was recently shown to inhibit mitochondrial respiration at complex 3,3 which in turn has been reported to induce the phospho-eIF2α/ATF4 pathway in a GCN2-dependent manner.25-27 Therefore, we tested the effect of atovaquone on the OCR of AML cells. We found that atovaquone induced dose-dependent reductions in OCR for multiple AML cell lines and primary samples (Figure 6D; supplemental Figures 15 and 16) and dose- and time-dependent effects on MV4-11 cells (supplemental Figure 15). In comparison, normal bone marrow demonstrated lower basal and maximal OCRs and little atovaquone-induced effect. Thus, atovaquone acts as a potent inhibitor of mitochondrial respiration in AML cells at clinically achievable doses.
Discussion
Our data show that atovaquone induces apoptosis of AML samples but has negligible activity in normal healthy bone marrow. In 2 separate in vivo models, atovaquone delayed development of measurable disease and prolonged survival. Our drug combination assays also demonstrated additivity between atovaquone and the conventional chemotherapeutic agents cytarabine, daunorubicin, and CPX-351. In total, our results provide evidence for further clinical investigation into the use of atovaquone for the treatment of pediatric and adult AML.
Regarding the antileukemia mechanism of atovaquone, we previously showed that atovaquone resulted in downregulation of gp130, the transmembrane component of the IL-6 receptor. Reductions in gp130 ultimately resulted in decreased STAT3 activity. Here, we show that atovaquone also modulates other pathways known to be involved in cancer cell growth, survival, and apoptosis, including the phosphorylation of eIF2α, induction of ATF4 and REDD1, inhibition of mTOR, and inhibition of mitochondrial oxidative phosphorylation. These findings are consistent with a model in which atovaquone treatment induces a state of cellular stress. Although the stress is tolerated in normal cells, cancer cells seem unable to tolerate this stress, responding with growth arrest and apoptosis.
As a consequence of activating the phospho-eIF2α/ATF4 pathway, atovaquone consistently upregulates ATF3, CHOP, and CHAC1. Growth inhibitory and proapoptotic functions for all of these factors have been previously reported,20,28-32 suggesting that induction of these proteins may contribute to the anticancer activity of atovaquone. As part of the full UPR, phospho-eIF2α/ATF4 is stimulated, along with the PERK and ATF6 pathways.33,34 We found that atovaquone selectively activates ATF4 and not the full UPR pathway, thus supporting the role of the phospho-eIF2α/ATF4 pathway in atovaquone-mediated apoptosis. Moreover, activation of the phospho-eIF2α pathway results in REDD1-mediated inhibition of mTOR, which is centrally involved in tumor cell survival and proliferation.35
Atovaquone affects multiple pathways involved in the signal transduction of the cancer cell, including STAT3, eIF2α/ATF4, and mTOR. Recently, atovaquone was also reported to alleviate cancer cell hypoxia and sensitize cells to radiation,3 in addition to decreasing the viability of cancer stem-like cells.4 Importantly, our work demonstrates that atovaquone inhibits OXPHOS in AML cells. This is of particular interest, given recent work suggesting that chemotherapy-resistant cells are dependent on OXPHOS for survival.36 This suggests that atovaquone may be useful in eradication of chemotherapy-resistant leukemia blasts. Increasingly, cancer therapies with multiple targets or mechanisms of action are favored because of their superior efficacy and durability of response; redundancies between signaling pathways may limit the clinical activity of single-target agents and promote the evolution of resistance.37 From a scientific perspective, determining the contribution of these individual effects to the overall anticancer activity of atovaquone is challenging, given abundant crosstalk between pathways and the context-dependent nature of pathway activation. We believe the end points of apoptosis, decreased cancer cell viability, and improved survival of xenografts consistently observed with atovaquone treatment are highly significant.
Indeed, of all the approaches under investigation to improve cure rates in AML, atovaquone is distinct in the ease with which it can be incorporated into clinical trials. Atovaquone has been in clinical use for decades,38-40 with a long track record of safety. It does not cause myelosuppression, hepatic dysfunction, or renal toxicity and has few clinically important interactions with other medications. The US Food and Drug Administration–approved indication of atovaquone for PJP prophylaxis or treatment provides a unique opportunity for this agent. Because all immunosuppressed individuals (eg, patients undergoing chemotherapy) are at risk of PJP, atovaquone could potentially serve a dual purpose: PJP prophylaxis and antileukemia effect.
For pediatric AML patients, the drug of choice for PJP prevention is trimethoprim/sulfamethoxazole. However, second-line agents such as pentamidine, dapsone, and atovaquone are well studied and effective.41 Atovaquone has demonstrated 100% efficacy in the treatment of PJP when plasma levels of >40 µM were achieved, and pediatric dosing recommendations were developed to achieve these levels.40,42 In a retrospective review of 86 children with acute leukemia who received atovaquone for PJP prophylaxis because of a lack of tolerance of trimethoprim/sulfamethoxazole, no cases of PJP were reported.43
Our drug combination assays found atovaquone with etoposide nearly antagonistic, and it has been reported that simultaneous dosing increases serum concentrations of etoposide, potentially increasing both short- and long-term adverse effects.44 Therefore, we advise against concomitant dosing of atovaquone and etoposide. Because of the long half-life of atovaquone, we recommend discontinuing it several days in advance of etoposide-containing blocks and resuming atovaquone 24 hours after completion of etoposide dosing.42,45
In summary, our preclinical assessments of atovaquone support further testing of this agent for incorporation into existing AML therapeutic regimens. On the basis of this work, a limited-institution trial to explore the feasibility of adding atovaquone to standard pediatric AML treatment is currently under way (registered at www.clinicaltrials.gov as #NCT03568994).
Acknowledgments
The authors thank Todd Cooper, E. Anders Kolb, and Claudio Hetz for invaluable discussions, the Cytometry and Cell Sorting Core at Baylor College of Medicine and Amos Gaikwad and Tatiana Goltsova for expert assistance, and the Mouse Metabolomics Core at Baylor College of Medicine and Pradip Saha for expert assistance.
The Cytometry and Cell Sorting Core at Baylor College of Medicine receives funding from the National Institutes of Health (NIH; National Institute of Allergy and Infectious Diseases P30 AI036211, National Cancer Institute [NCI] P30 CA125123, and National Center for Research Resources S10 RR024574), and the Mouse Metabolomics Core at Baylor College of Medicine receives funding from the NIH (National Institute of Diabetes and Digestive and Kidney Diseases RO1DK114356 and National Human Genome Research Institute UM1HG006348). Supplementary analysis was provided by the Baylor College of Medicine Biostatistics Core. CPX-351 was provided by Jazz Pharmaceuticals. Collection and storage of human specimens by the Children’s Oncology Group is supported through funding from the NCI, NIH (U24CA114766). This work was supported by grants from the Texas Children’s Hospital Pediatric Pilot Research Fund (A.M.S.), CURE Childhood Cancer (A.M.S.), the Brent Leahey Fund (D.A.F.), the European Union’s Horizon 2020 Research and Innovation Program (826121) (P.S.), the Robert A. Welch Foundation Research Grant C-1680 (Z.T.B.), and the National Institute of General Medical Sciences, NIH (T32GM007753 and F30 CA165740-01) (M.X.); by gifts of funding from the Turn it Gold Fund (A.M.S.); and by Stephen P. Koster (D.A.F.), National Science Foundation Grant CHE-1055569 (Z.T.B.), and NCI, NIH grants R01CA17026 (M.S.R.) and R01CA160979 (D.A.F.).
Authorship
Contribution: A.M.S. and M.X. designed and performed experiments, analyzed and interpreted data, and wrote the manuscript; L.N.H., J.O.M., X.L., P.N., A.E.M.-M., S.R.W., M.C.T., M.J.K., I.T., K.J., R.R., Y.H., S.O., and E.L.S. conducted experiments; P.S., A.S.G., T.M.H., and Z.T.B. analyzed and interpreted data; M.S.R. and D.A.F. designed experiments, analyzed and interpreted data, and wrote the manuscript; and all authors edited and approved the final version of the manuscript.
Conflict-of-interest disclosure: The authors declare no competing financial interests.
The current affiliation for M.X. is Department of Radiation Oncology, Stanford University, Stanford, CA.
Correspondence: Alexandra M. Stevens, Texas Children’s Cancer and Hematology Centers, 1102 Bates St, Suite 750, Houston, TX 77030; e-mail: amsteven@txch.org.

