

Key Points
Analyses of recurrent mutations, copy number alterations, and structural variants reveal complementary immune evasion mechanisms in cHL.
The mutational burden in EBV– cHLs is among the highest reported, potentially contributing to the efficacy of PD-1 blockade.

Abstract
Classical Hodgkin lymphoma (cHL) is composed of rare malignant Hodgkin Reed-Sternberg (HRS) cells within an extensive, but ineffective, inflammatory/immune cell infiltrate. HRS cells exhibit near-universal somatic copy gains of chromosome 9p/9p24.1, which increase expression of the programmed cell death protein 1 (PD-1) ligands. To define genetic mechanisms of response and resistance to PD-1 blockade and identify complementary treatment targets, we performed whole-exome sequencing of flow cytometry–sorted HRS cells from 23 excisional biopsies of newly diagnosed cHLs, including 8 Epstein-Barr virus–positive (EBV+) tumors. We identified significantly mutated cancer candidate genes (CCGs) as well as somatic copy number alterations and structural variations and characterized their contribution to disease-defining immune evasion mechanisms and nuclear factor κB (NF-κB), JAK/STAT, and PI3K signaling pathways. EBV– cHLs had a higher prevalence of genetic alterations in the NF-κB and major histocompatibility complex class I antigen presentation pathways. In this young cHL cohort (median age, 26 years), we identified a predominant mutational signature of spontaneous deamination of cytosine- phosphate-guanines (“Aging”), in addition to apolipoprotein B mRNA editing catalytic polypeptide-like, activation-induced cytidine deaminase, and microsatellite instability (MSI)–associated hypermutation. In particular, the mutational burden in EBV– cHLs was among the highest reported, similar to that of carcinogen-induced tumors. Together, the overall high mutational burden, MSI-associated hypermutation, and newly identified genetic alterations represent additional potential bases for the efficacy of PD-1 blockade in cHL. Of note, recurrent cHL alterations, including B2M, TNFAIP3, STAT6, GNA13, and XPO1 mutations and 2p/2p15, 6p21.32, 6q23.3, and 9p/9p24.1 copy number alterations, were also identified in >20% of primary mediastinal B-cell lymphomas, highlighting shared pathogenetic mechanisms in these diseases.
Introduction
Classical Hodgkin lymphomas (cHLs) include rare malignant Hodgkin Reed-Sternberg (HRS) cells that are embedded within an extensive inflammatory/immune cell infiltrate. In cHL, tumor cells have a range of sizes and shapes and include mononuclear Hodgkin and bi- or multinuclear Reed-Sternberg cells that exhibit defective cytokinesis.1-3 HRS cells are derived from crippled, largely CD30+, pre-apoptotic germinal center (GC) B cells that lack functional B-cell receptors (BCRs) and have reduced expression of multiple B-cell transcription factors.1,4 These tumor cells rely on alternative signaling and survival pathways, including JAK/STAT and nuclear factor kB (NF-κB), and exhibit genetic alterations of select pathway components.1,5-10
In 30% to 40% of cHLs in North America and Europe, the malignant HRS cells have evidence of latent Epstein-Barr virus (EBV) infection and associated expression of latent membrane protein 1 (LMP1) and latent membrane protein 2A (LMP2A).1 In these tumors, LMP1 mimics an active CD40 receptor and provides an alternative mechanism for NF-κB signaling.1 LMP2A facilitates BCR-like signaling via a cytoplasmic motif that resembles the BCR immunoreceptor tyrosine-based activation motif.1
The paucity of malignant HRS cells in primary cHLs has limited comprehensive genomic characterization of these tumors. Previous genetic analyses were largely restricted to cHL cell lines, laser-capture microdissected primary tumors, and a small series of flow-sorted HRS cells; these studies primarily focused on somatic mutations.6-10 We and others previously identified recurrent gains and amplifications of chromosome 9p/9p24.1/PD-L1(CD274) and PD-L2(PDCD1LG2) and associated overexpression of these programmed cell death protein 1 (PD-1) ligands in cHL.11-13 The 9p24.1 amplicon also includes JAK2, which further augments JAK/STAT signaling and PD-1 ligand expression.11,14 These findings provided a genetic rationale for evaluating PD-1 blockade in patients with cHL and underscored the importance of somatic copy number alterations (SCNAs) in this disease. Patients with multiply relapsed/refractory cHL had overall response rates of ∼70% to PD-1 blockade, among the highest reported response rates for any tumor type.15-18 PD-1 blockade is now being evaluated in earlier treatment settings, including the frontline therapy of cHL.19
However, the mechanism of action of PD-1 blockade in cHL and the reasons for its efficacy in this disease are incompletely defined. In a small pilot study, HRS cells were shown to exhibit frequent inactivating mutations of B2M that were postulated to limit transport and cell surface expression of major histocompatibility complex (MHC) class I and associated antigen presentation to CD8+ T cells.6 In several larger series, HRS cells often lacked membranous expression of β2-microglobulin (β2M) and MHC class I.6,20,21 In these tumors, HRS cells less frequently lost expression of MHC class II, and membranous MHC class II was positively associated with a favorable response to PD-1 blockade.20,21
Herein, we assess complementary genetic mechanisms of immune escape and enhanced sensitivity to PD-1 blockade in purified, flow-sorted primary HRS cells and characterize the comprehensive genetic signature of these cHLs. In a companion article, we compare and contrast the recurrent genetic alterations in cHL with those in a related lymphoid malignancy, primary mediastinal large B-cell lymphoma (PMBL).22
Methods
Patient samples and cell lines
The 23 newly diagnosed primary cHLs were collected at the University of Washington (supplemental Figure 1; supplemental Table 1). This study was approved by the Institutional Review Boards of the University of Washington and Dana-Farber Cancer Institute. All cHL tumor samples were mechanically dissociated and cryopreserved as single-cell suspensions as described.23 The cHL cell lines were cultured in cell line–specific media11 and short tandem repeat-typed to confirm their identity (https://www.dsmz.de).
Flow cytometry cell sorting
CHL cell suspensions were incubated with a blocking antibody cocktail (CD2, CD58, CD54 and lymphocyte function-associated antigen 1 [LFA-1]) for 1 hour on ice before fluorescent antibody staining and flow cytometry sorting23,24 on the BD FACS ARIA II cell sorter (supplemental Table 2). All flow sorting experiments were performed using the 100-µm nozzle at 20 psi with an average of 2000 events per second. HRS cells and normal CD30– B cells were isolated as described23,25 (supplemental Methods). Isolated HRS cells were identified by their decreased expression of CD45, intermediate to bright expression of CD30, CD15, CD40, and CD95, and the absence of detectable CD64 and CD5 (supplemental Figure 2A-B). Paired normal B cells were identified by their increased CD19 expression and the absence of detectable CD30 and CD15 (supplemental Figure 2C). For 9 of the 23 cHLs, additional HRS cell sorting and flow cytometric analyses were performed using an expanded antibody panel (supplemental Table 2B).
Library preparation and whole-exome sequencing
Genomic DNA was extracted, and whole-exome sequencing (WES) was performed using the Agilent SureSelect Human All Exon v5.0 (catalog No. 5190-6208) plus a custom, spiked-in bait set (Agilent Technologies) for structural variant (SV) detection as described26,27 (supplemental Methods).
Processing and analysis of the WES data
WES data were processed and analyzed as described.26 Steps included read alignment and quality control, with estimation of contamination in samples using ContEst (median, 1.8%; range, 0.1%-11%; supplemental Table 1)28 and confirmation of matching of tumor and normal pairs by mass spectrometric fingerprint genotyping; removal of artifacts and filtering using a panel of normals; estimation and correction for tumor-in-normal content29 ; mutation calling using MuTect30 followed by significance analysis to identify mutated CCGs with MutSig2CV31 as well as clustering in 3-dimensional protein structures (CLUMPS)32 ; and estimation of purity and ploidy using ABSOLUTE33 and inferring the cancer cell fraction (CCF). SVs were identified with an established pipeline26 using BreaKmer,34 Lumpy v0.2.13,35 dRanger,36 and SvABA37 followed by Breakpointer validation.26 Additions or modifications to previous processing and analyses,26 including determination of EBV status and copy number evaluation, are described in supplemental Methods.
Mutational signature analysis.
Mutational signature analysis was performed as described26 with minor adjustments (supplemental Methods). In brief, a clustering feature threshold of 10 kb for the nearest mutation distance (NMD) for all single nucleotide variants with partitioning of clustered (NMD ≤10 kb) and nonclustered (NMD >10 kb) groups was used (supplemental Figure 4). The initial de novo signature extraction for the 23 cHLs was performed as described26 followed by an enforced semi-supervised signature analysis excluding the hypermutators to delineate the 2 apolipoprotein B mRNA editing catalytic polypeptide-like (APOBEC) signatures (COSMIC2 and COSMIC13). The same semi-supervised signature analysis was performed on the combined cohort of 23 primary cHLs and cHL cell lines.
Visualization of mutational densities across tumor types
The mutational density in cHL was compared with that in other tumor types as described31 and extended to include clonal mutations and mutations in CCGs as reported.38 Mutation densities (tumor mutational burden) were corrected for variations in the number of bases sufficiently covered (≥14× in the tumor and ≥8× in the normal) by the exome target bait sets used for each cohort, such that the mutation density is displayed consistently in units of mutations per Mb across all cohorts.
Gene-by-sample matrix
Morpheus (https://software.broadinstitute.org/morpheus) was used for visualization of the matrix of samples by recurrent genetic alterations.
Results
CCGs in cHLs
In this cohort of patients with newly diagnosed cHL, the median age was 26 years (range, 10-75 years) and the sexes were balanced; 83% (19 of 23) of the patients had nodular sclerosis Hodgkin lymphoma (NSHL) and 17% (4 of 23) had mixed cellularity (MC) HL (supplemental Figure 1). Thirty-five percent (8 of 23) of the primary cHLs were EBV+ and 65% (15 of 23) were EBV– (supplemental Figure 1; supplemental Table 1).
To isolate the rare HRS cells from these primary cHL tumor cell suspensions, we used an established multicolor flow cytometric sorting strategy23,24 (supplemental Figure 2) and obtained a median of 1262 HRS cells (range, 465-3832 HRS cells) per cHL specimen. We performed WES of the 23 purified HRS cell samples and obtained a mean target read coverage of 50× (range, 20.76-178.94X); a mean number of coding mutations of 227 (range, 61-3524 coding mutations); and a mean allele fraction of 0.35 (range, 0.12-0.44 allele fractions) (supplemental Table 1). Thereafter, we applied MutSig2CV31 using a false discovery rate threshold of 10%, and we identified 15 CCGs (Figure 1; supplemental Table 3). Five CCGs were found by the CLUMPS algorithm,32 which identifies genes with significant mutational clustering within 3-dimensional protein space (q < 0.25) (Figure 1B-C; supplemental Figure 3A). Of note, 3 of the CCGs defined by CLUMPS were not captured by MutSig2CV (supplemental Figure 3; supplemental Table 3). A comparison of the identified CCGs in this series and previously reported mutations in cHL6,7,10 is included in supplemental Table 4.
![Recurrently mutated genes in cHL. (A) A coMut plot100 of the CCGs in 23 primary cHLs indicating the number and frequency of recurrent mutations (left), color-coded mutated genes (center), with ranking by significance (MutSig2CVq value) (right). Coding nonsynonymous mutational density (log10[#mutations]) for each primary case is indicated at the top; allelic frequency and mutation type are noted below. *Indicates 2 hypermutated cases. (B-C) Genes identified by CLUMPS included STAT6 (protein data bank [PDB]: 4y5w; http://www.rcsb.org/) (B) and GNA13 (PDB: 3ab3) (C), which exhibited significant spatial clustering in protein structures. STAT6 dimer is shown with molecules in gray and cyan, respectively, and mutated residues in red. Color intensity and thickness of line scales with the number of mutations. Co-crystalized small molecules are shown in blue (GDP). (D) Mutation diagrams (lollipop figures) of the 15 significantly mutated genes identified in panel A. Positions within the genes perturbed in multiple cHLs (≥2) are labeled.](https://ash.silverchair-cdn.com/ash/content_public/journal/bloodadvances/3/23/10.1182_bloodadvances.2019001012/3/m_advancesadv2019001012f1.png?Expires=1769095099&Signature=WtM8H-Co9wYr0ZMEUP7ttwaPzgYPlOKBaAJrFAYIC6TVbLtFh0YpSyYBc3LHtWma9SpABRFkPyk4CbJFt2oV3xBa98scnRk72UhGCR2fKV40HPqVQ1DohqUd9pPxj7EtJG~tdoOgLzGMgRpv7R7Cy2bzdwzeH6bVP6jFLVIC5CkRUDawkSjGvrUVffqagEVDn~b2OR778q-C9PB66WqVJxNGT8~HVVZPcHjQs~Crow09wmhepbH4t9cE5lFaqpp2mx34x~GGHe4-VVqeXyBMAzmKt5lHXD~mEshOdyu2vaGvDPE327QJ9AAySKlnz77DBAAUspURO5NLF8JX3WQKbg__&Key-Pair-Id=APKAIE5G5CRDK6RD3PGA)
Recurrently mutated genes in cHL. (A) A coMut plot100 of the CCGs in 23 primary cHLs indicating the number and frequency of recurrent mutations (left), color-coded mutated genes (center), with ranking by significance (MutSig2CVq value) (right). Coding nonsynonymous mutational density (log10[#mutations]) for each primary case is indicated at the top; allelic frequency and mutation type are noted below. *Indicates 2 hypermutated cases. (B-C) Genes identified by CLUMPS included STAT6 (protein data bank [PDB]: 4y5w; http://www.rcsb.org/) (B) and GNA13 (PDB: 3ab3) (C), which exhibited significant spatial clustering in protein structures. STAT6 dimer is shown with molecules in gray and cyan, respectively, and mutated residues in red. Color intensity and thickness of line scales with the number of mutations. Co-crystalized small molecules are shown in blue (GDP). (D) Mutation diagrams (lollipop figures) of the 15 significantly mutated genes identified in panel A. Positions within the genes perturbed in multiple cHLs (≥2) are labeled.
Recurrently mutated genes in cHL. (A) A coMut plot100 of the CCGs in 23 primary cHLs indicating the number and frequency of recurrent mutations (left), color-coded mutated genes (center), with ranking by significance (MutSig2CVq value) (right). Coding nonsynonymous mutational density (log10[#mutations]) for each primary case is indicated at the top; allelic frequency and mutation type are noted below. *Indicates 2 hypermutated cases. (B-C) Genes identified by CLUMPS included STAT6 (protein data bank [PDB]: 4y5w; http://www.rcsb.org/) (B) and GNA13 (PDB: 3ab3) (C), which exhibited significant spatial clustering in protein structures. STAT6 dimer is shown with molecules in gray and cyan, respectively, and mutated residues in red. Color intensity and thickness of line scales with the number of mutations. Co-crystalized small molecules are shown in blue (GDP). (D) Mutation diagrams (lollipop figures) of the 15 significantly mutated genes identified in panel A. Positions within the genes perturbed in multiple cHLs (≥2) are labeled.
The most significantly mutated CCG, B2M, was perturbed by missense and truncating mutations in 39% of tumors (Figure 1A,D). Such alterations likely impair the transport of MHC class I molecules/β2M to the cell surface, as described6,7,9,10,20,21,39 (supplemental Table 4). An additional potential basis of perturbed MHC class I function was the newly identified truncating and missense mutations of HLA-B in 17% of cHLs (Figure 1A,D).
We defined additional CCGs with known roles in the biology of cHL, including negative regulators of NF-κB signaling, NFKBIE, NFKBIA, and TNFAIP35,6,8,10 (Figure 1A,D; supplemental Table 4). In NFKBIE (26% cases), NFKBIA (17% cases), and TNFAIP3 (26% cases), mutations were largely truncating (Figure 1D). This cohort of cHLs also exhibited missense mutations in IKBKB (13% cases), including V203I, a gain-of-function mutation in the encoded inhibitor of κ kinase B (IKK), which phosphorylates IKBα and liberates associated NF-κB molecules (Figure 1A,D; supplemental Table 4).10,40
Additional described cHL CCGs encode the JAK/STAT pathway components STAT6 and SOCS16,10,41-44 (Figure 1A,D; supplemental Table 4). STAT6 alterations (35% cases) primarily involved known mutational hotspots in the DNA binding domain (D419G/H/N and N421S)7,10,45,46 (Figure 1A-B,D). The largely truncating or missense mutations of SOCS1 (70% cases) spanned the entire coding sequence, consistent with the known role of the encoded tumor suppressor protein in this disease7,41,42 (Figure 1A,D). In our series, 22% of the cHLs also exhibited largely truncating (4 of 5) or missense mutations of PTPN1 (false discovery rate q = 0.36, exceeding our discovery threshold of q = 0.1; supplemental Figure 3B; supplemental Table 3), a known negative regulator of JAK/STAT signaling.47,48 In 17% of cHLs, we also identified previously described mutations in CSF2RB (Figure 1A,D; supplemental Table 4),6 which encodes the common β chain of the granulocyte-macrophage colony-stimulating factor and interleukin-3 and interleukin-5 receptors. All of these receptors signal via the JAK/STAT pathway.49
We defined additional CCGs that were described in cHL, other lymphomas, and/or solid tumors, including XPO1, RBM38, GNA13, ACTB, and ARID1A.6,7,10 XPO1 encodes an importin-β superfamily member and nuclear export protein that translocates multiple cargo proteins, including STAT6, from the nucleus to the cytoplasm.50,51 The recurrent XPO1 E571K mutation in 26% of cHLs (Figure 1A,D) is located close to the hydrophobic groove responsible for cargo recognition. This alteration has been described in multiple hematologic malignancies, including cHL and PMBL.7,10,22,50-52
RBM38 encodes an RNA-binding protein and a reported tumor suppressor that modulates gene expression by binding to adenylate-uridylate/uridylate-rich elements in the 3′ untranslated region of target transcripts.53-55 Of interest, murine Rbm38 deficiency promotes accelerated aging and lymphomagenesis, in part by destabilizing PTEN transcripts and decreasing PTEN protein expression.55,56 In 17% of analyzed cHLs, there are previously unreported truncating or missense mutations of RBM38 (Figure 1A,D). Functional studies will be required to determine whether RBM38 alterations represent a potential basis for enhanced PI3K signaling in these tumors.
An additional 26% of the analyzed cHLs had truncating or missense mutations of GNA13, which abolished polar interactions around the catalytic pocket (Figure 1A,C-D; supplemental Table 4). Such alterations have been described in cHL6,7,9,10 and additional GC B-cell derived diffuse large B-cell lymphoma (DLBCL) and Burkitt lymphomas.57-59 The encoded protein, Gα13, transmits G-protein coupled receptor signals, activates RHO family members, and inhibits associated cellular migration and AKT-dependent pathways.57-59 In murine models, Gα13 deficiency was associated with GC B-cell expansion and dissemination, enhanced AKT signaling, and an increased incidence of B-cell lymphomas.58,59
In these multinuclear HRS cells, which are postulated to have defective RHOA– and β actin–dependent cytokinesis,1-3,60 we detected missense mutations of ACTB (Figure 1A,D; supplemental Table 4).6 CLUMPS revealed additional alterations in EEF1A1 (supplemental Figure 3A; supplemental Tables 3 and 4),6 which encodes a translation factor implicated in chromosome condensation and tetraploid cell formation.61 EEF1A1 is also recurrently mutated in follicular lymphoma62 and inactivated by translocation in DLBCL.26
We identified truncating and splice site mutations of ARID1A in 26% of the primary cHLs (Figure 1A,D; supplemental Table 4). ARID1A encodes a subunit of the chromatin remodeling SWItch/sucrose non-fermentable (SWI/SNF) complex, which is a known tumor suppressor in multiple solid tumors63-68 and certain hematologic malignancies, including follicular lymphoma.10,45,69,70 Of interest, ARID1A deficiency was recently associated with increased mutation load and enhanced responsiveness to PD-1 blockade.69 The majority of identified CCGs in primary cHLs (Figure 1A) were also mutated in 6 cHL cell lines that are often used as model systems of the disease (supplemental Figure 3C).
Mutational signature analysis
To gain insights into putative mutational processes in cHL, we applied our SignatureAnalyzertool,71,72 which detects mutational signatures while taking into account clustering of the mutations along the genome and the 3-base context of the mutations. We initially identified 2 different microsatellite instability (MSI) signatures (COSMIC6 and COSMIC15; https://cancer.sanger.ac.uk/cosmic/signatures_v2), an activation-induced cytidine deaminase (AID) signature, and a mixed signature composed of spontaneous deamination at cytosine-phosphate-guanines (CpGs) (hereafter termed “Aging”) and APOBEC (supplemental Figure 4A; supplemental Table 5).73,74
The two MSI cases were noted to be hypermutators (Figure 1A, top). One of these tumors (c_cHL_4) harbored both a splice site and a nonsense mutation in MSH3 (chr5:79974914T>C and chr5:80160722G>T, respectively). The other MSI case (c_cHL_24) had a homozygous deletion in MSH2 in addition to a nonsense mutation in ARID1A.
To deconvolute the Aging and APOBEC signatures, we removed the 2 MSI cases and reidentified the mutational signatures in a semi-supervised manner (supplemental Methods; Figure 2A). In tumors from this predominantly young patient cohort, spontaneous deamination at CpG (Aging) was the most frequent mutational signature, followed by APOBEC (COSMIC2 and COSMIC13) and AID (Figure 2A-C). There was no association between the patient’s age at diagnosis and the number of mutations attributed to the Aging signature (supplemental Figure 4B), prompting speculation regarding an early increase in the division rate of HRS cells or other mechanisms that could increase CpG deamination in cHL.
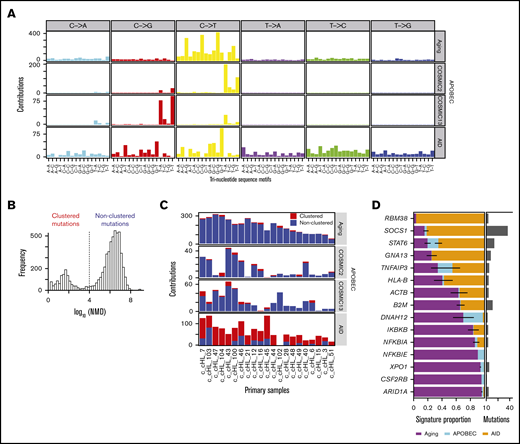
Mutational signatures in cHL. (A) Mutational signature analysis with clustering based on the NMD after removal of MSI samples. Identified signatures included C>T at CpG (Aging), AID, and an additional contribution of APOBEC signatures (COSMIC2 and COSMIC13). (B) Mutational clustering. Based on the bimodal distribution of NMD, all mutations were designated as either clustered (NMD ≤10 kb) or nonclustered (NMD ≥10 kb). (C) Signature activity (number of mutations assigned to each signature, y-axis) in each group (red, NMD ≤10 kb; blue, NMD ≥10 kb) across the 21 cHLs (2 MSI hypermutator cases were excluded, x-axis). (D) Relative contribution of each mutational process (Aging, APOBEC, and AID) for the 15 significantly mutated genes. Genes are ordered top to bottom by the fraction of the Aging signature. Error bars show the standard error of the mean. Histogram to the right shows the number of mutations within each mutated gene.
Mutational signatures in cHL. (A) Mutational signature analysis with clustering based on the NMD after removal of MSI samples. Identified signatures included C>T at CpG (Aging), AID, and an additional contribution of APOBEC signatures (COSMIC2 and COSMIC13). (B) Mutational clustering. Based on the bimodal distribution of NMD, all mutations were designated as either clustered (NMD ≤10 kb) or nonclustered (NMD ≥10 kb). (C) Signature activity (number of mutations assigned to each signature, y-axis) in each group (red, NMD ≤10 kb; blue, NMD ≥10 kb) across the 21 cHLs (2 MSI hypermutator cases were excluded, x-axis). (D) Relative contribution of each mutational process (Aging, APOBEC, and AID) for the 15 significantly mutated genes. Genes are ordered top to bottom by the fraction of the Aging signature. Error bars show the standard error of the mean. Histogram to the right shows the number of mutations within each mutated gene.
We next determined the relative contribution of the predominant mutational processes (Aging, APOBEC, and AID) to each of the 15 CCGs in our cHL cohort (Figure 2D) as described.26 Known targets of aberrant somatic hypermutation, such as SOCS141,42 had preponderant AID mutational signatures as did RBM38 (Figure 2D). Although STAT6 is not a known target of aberrant somatic hypermutation, a subset of the identified STAT6 mutations had features of an aberrant AID mutational signature (supplemental Figure 4C). In contrast, genes including NFKBIA, NFKBIE, XPO1, CSFR2B, and ARID1A had predominant Aging mutational signatures (Figure 2D).
We did not observe the reported cHL cell line mutational signature COSMIC25 (https://cancer.sanger.ac.uk/cosmic/signatures_v2) in our series of primary cHLs (Figure 2A,C; supplemental Figure 4A). For this reason, we leveraged our own cHL cell line data and performed a new mutational signature analysis on the combined series of primary cHLs and cHL cell lines (supplemental Figure 4D-E). In addition to the signatures detected in primary cHLs, we found 2 additional mutational patterns, COSMIC25 and COSMIC11, that were largely restricted to cHL cell lines (supplemental Figure 4D-E). Because COSMIC11 reflects the DNA damage of alkylating agents, the COSMIC11 and COSMIC25 cell line signatures may be more closely associated with previous treatment and/or in vitro growth conditions than primary transforming events specific to cHL.75
Somatic copy number alterations and chromosomal rearrangements
We next assessed recurrent SCNAs in the primary cHLs with the GISTIC2.0 program76 and detected 13 recurrent SCNAs, including 6 copy gains (2 focal and 4 arm level) and 7 copy losses (6 focal and 1 arm level) (Figure 3A). The frequency of focal SCNAs in our primary cHL cohort ranged from 9% to 52%; these SCNAs harbored a median of 78 genes in focal peaks (range, 21 to 778 genes in focal peaks). Using the COSMIC Cancer Gene Census database (http://cancer.sanger.ac.uk/cosmic [v88 cancer_gene_census]), we identified candidate driver genes that reside within these focal SCNAs (supplemental Table 6).
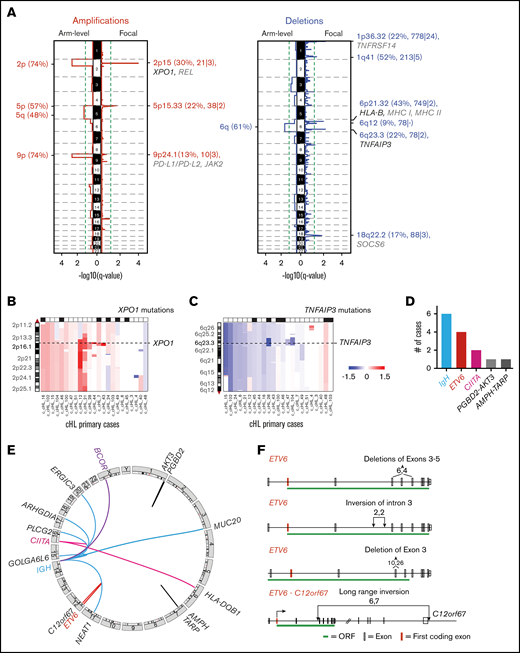
Recurrent SCNAs and chromosomal rearrangements in cHL. (A) SCNAs labeled with their associated cytoband/arm followed in parentheses by frequency of the alteration, total number of genes, and COSMIC-defined genes. SCNAs that include significantly mutated genes (black) and genes of interest (gray) are highlighted. (B) Arm-level and focal alterations of 2p/2p15. Image visibility graph (IVG) plot of copy number from chromosome 2p indicates a frequent arm-level gain with focal amplification of 2p15 region (XPO1). (C) Arm-level and focal loss of 6q/6q23.3. IGV plot of copy number from chromosome 6q indicates frequent arm-level copy loss and focal copy loss of 6q23.3 (TNFAIP3). (D) Summary of SVs in all cHLs. (E) Circos plots of identified SVs in cHL. (F) ETV6 deletions and insertions. Boxes indicate exons: red, first coding exon; white, protein-coding exon; green, open reading frame (ORF) with intervening introns.
Recurrent SCNAs and chromosomal rearrangements in cHL. (A) SCNAs labeled with their associated cytoband/arm followed in parentheses by frequency of the alteration, total number of genes, and COSMIC-defined genes. SCNAs that include significantly mutated genes (black) and genes of interest (gray) are highlighted. (B) Arm-level and focal alterations of 2p/2p15. Image visibility graph (IVG) plot of copy number from chromosome 2p indicates a frequent arm-level gain with focal amplification of 2p15 region (XPO1). (C) Arm-level and focal loss of 6q/6q23.3. IGV plot of copy number from chromosome 6q indicates frequent arm-level copy loss and focal copy loss of 6q23.3 (TNFAIP3). (D) Summary of SVs in all cHLs. (E) Circos plots of identified SVs in cHL. (F) ETV6 deletions and insertions. Boxes indicate exons: red, first coding exon; white, protein-coding exon; green, open reading frame (ORF) with intervening introns.
When assessing the recurrent SCNAs, we observed that specific CCGs could be perturbed by arm-level copy gain or loss as well as focal SCNAs (Figure 3A-C). For example, XPO1 was mutated in 26% of the cHLs (Figure 1) and additionally altered by SCNAs, including arm-level gain of 2p and focal amplification of 2p15 (Figure 3A-B). Consistent with previous reports,6,11,12,21 we observed frequent arm-level 9p gain and focal amplification of the 9p24.1/PD-L1/PD-L2/JAK2 region in the primary cHLs (Figure 3A; supplemental Figure 5A; supplemental Table 4). In addition, TNFAIP3 was perturbed by mutations in 26% of tumors (6 of 23)6 (Figure 1) and 6q arm-level or 6q23.3 focal copy loss in 74% of cHLs (17 of 23) (Figure 3A,C; supplemental Table 4).
We identified 6 SCNAs (arm-level gain of 5p and 5q, focal loss of 1p36.32, 6p21.32, 6q23.3, and arm-level loss of 6q) that were recently described in DLBCL26 as well as focal gain of 5p15.3377,78 and focal loss of 6q1279 that were reported in lung and prostate cancer, respectively. The focal region of 1p36.32 copy loss includes TNFRSF14 (Figure 3A),80,81 which is one of the most frequently mutated genes in GC-derived B-cell lymphomas.26,82 Of interest, loss of TNFRSF14 and its encoded cell surface receptor HVEM leads to cell-autonomous B-cell activation and the development of GC B-cell lymphoma in vivo.82
By using our recently described computational pipeline,26 we identified specific SVs in the primary cHLs, including those involving ETV6 (17% [4 of 23]) and CIITA (8% [2 of 23]) (Figure 3D-E; supplemental Tables 4 and 7). ETV6 is a reported fusion partner in up to 30 different translocations in hematopoietic malignancies.83 In the primary cHL cohort, ETV6 deletions and inversions predominantly involved exon 3, which encodes the helix-loop-helix and homodimerization domain of this transcriptional repressor (Figure 3F).83 Structural analyses of ETV684 suggest that the identified exon 3 alterations abrogate ETV6-mediated transcriptional repression.
Consistent with previous reports, SVs in CIITA included a tandem duplication (supplemental Figure 7) and a balanced translocation with HLA-DQB1 (Figure 3D), the latter likely leading to inactivation of CIITA and decreased MHC class II expression.85,86 We also identified translocations that juxtaposed genes with known roles in GC B-cell biology, such as BCOR, to IgH (IgH-Any, 26%) in this primary cHL series (Figure 3D-E; supplemental Figure 5B).
Co-occurrence of genetic alterations
Co-occurring genetic alterations in EBV+ and EBV– cHLs and cHL cell lines.
The cHLs in our series had a median of 11 recurrent genetic drivers (range, 3-16 drivers) prompting further analysis of co-occurring alterations in the primary cHLs (Figure 4A) and cHL cell lines (Figure 4B). Although the majority of HRS cell samples exhibited 2p/2p15 and 9p/9p24.1 copy gain, 6q/6q23.3 copy loss, and SOCS1 somatic mutations, 2-way hierarchical clustering revealed additional genetic substructure (Figure 4A, left and right branches). Of interest, this objectively defined genetic substructure delineated EBV+ tumors (left branch) from EBV– cHLs (right branch, Figure 4A, top; supplemental Table 8). In this series, as in others,87 the primary MC cHLs were largely EBV+ (Figure 4A, top). Notably, there were fewer recurrent genetic alterations in the EBV+ than the EBV– cHLs (P = .011, Mann-Whitney U test) and fewer driver events in the 4 MC cHLs than the NSHLs (P = .008) (Figure 4A,C), as previously described.7 There were no significant differences in the sequencing mean target coverage between the EBV+ and EBV– tumors (P = .55) or between the MC cHLs and NSHLs (P = .37), suggesting that the quantitative differences in driver events in these cHL subsets were disease related.

Co-occurring genetic alterations in cHL. (A) Genetic alterations are visualized in a color-coded matrix. Mutations and SCNAs with a false discovery rate–corrected q < 0.1 and SVs detected in 2 cases. Left: primary EBV+ cases; right: EBV– cases. Morphologic subtype as labeled. Each column represents an individual cHL sample. Clustering of alterations used the 1-Pearson-correlation method. Right: frequency of the genetic alterations are presented as a bar graph. (B) Genetic alterations identified in primary cHLs in panel A are shown in cHL cell lines. (C) Graphical comparison of the number of driver events in EBV+ vs EBV–, MC vs NSHL, and ARID1A wild-type (WT) vs mutant cHLs. MC cHLs are shown in red. (D) Genetic bases of perturbed MHC class I and MHC class II expression in the cHLs. IGV plot of copy number from chromosome 6p21.32 to 6p21.33 reveals copy loss of MHCII and/or MHCI, including HLA-B, in individual cHLs. The EBV status, B2M and HLA-B mutations, and CIITA SVs in individual cHLs are indicated in the header. *Indicates 9 cHLs for which additional flow cytometry analysis was performed. (E) Table comparing the HRS cell MHC class II expression levels in tumors with known MHCII status (copy loss or no copy loss). The P value (P = .048) was determined by using a Fisher’s exact test (see also supplemental Figure 7). non-syn, non-synonymous.
Co-occurring genetic alterations in cHL. (A) Genetic alterations are visualized in a color-coded matrix. Mutations and SCNAs with a false discovery rate–corrected q < 0.1 and SVs detected in 2 cases. Left: primary EBV+ cases; right: EBV– cases. Morphologic subtype as labeled. Each column represents an individual cHL sample. Clustering of alterations used the 1-Pearson-correlation method. Right: frequency of the genetic alterations are presented as a bar graph. (B) Genetic alterations identified in primary cHLs in panel A are shown in cHL cell lines. (C) Graphical comparison of the number of driver events in EBV+ vs EBV–, MC vs NSHL, and ARID1A wild-type (WT) vs mutant cHLs. MC cHLs are shown in red. (D) Genetic bases of perturbed MHC class I and MHC class II expression in the cHLs. IGV plot of copy number from chromosome 6p21.32 to 6p21.33 reveals copy loss of MHCII and/or MHCI, including HLA-B, in individual cHLs. The EBV status, B2M and HLA-B mutations, and CIITA SVs in individual cHLs are indicated in the header. *Indicates 9 cHLs for which additional flow cytometry analysis was performed. (E) Table comparing the HRS cell MHC class II expression levels in tumors with known MHCII status (copy loss or no copy loss). The P value (P = .048) was determined by using a Fisher’s exact test (see also supplemental Figure 7). non-syn, non-synonymous.
EBV+ HRS cells are known to express LMP1, which binds tumor necrosis factor receptor–associated factors and activates NF-κB.5,88 As a consequence, EBV+ cHLs are reported to be less reliant on genetic enhancement of NF-κB signaling.5,8 Consistent with earlier studies,6,8 we found that EBV positivity and TNFAIP3 inactivation via mutation or focal copy loss were mutually exclusive in our primary cHLs (TNFAIP3 mutation and/or focal-copy loss, EBV– (9 of 15 [60%]) vs EBV+ (0 of 8 [0%]) (P = .0061; Figure 4A). In comparison with EBV+ cHLs, EBV– cHLs were significantly more likely to have inactivating B2M mutations, HLA-B mutations, or high-level focal copy loss of 6p21.32/HLA-B (P = .0084) (Figure 4A,D). The latter findings provide potential structural bases for the reported differences in cell surface expression of MHC class I in EBV+ and EBV– cHLs.20
ARID1A-mutant cHLs (both EBV+ and EBV–) had a significantly higher number of candidate driver events than ARID1A wild-type cHLs (P = .012; P = .038 without hypermutators) (Figure 4C; supplemental Figure 6), which is also of interest, given the reported association between ARID1A deficiency, increased mutation load, and sensitivity to PD-1 blockade.69
Structural basis for decreased MHC class II expression in cHL.
After identifying potential genetic bases for previously reported perturbed MHC class I expression in cHL (Figure 4D),20,21 we analyzed MHC class II expression in our genetically characterized cHLs. In the 9 cHLs with additional available samples, we used a flow cytometric approach with an expanded antibody panel (supplemental Table 2) to assess HRS cell surface expression of MHC class II (supplemental Figure 7). HRS cell expression of MHC class II was compared with that on MHC class II–negative normal infiltrating T cells and MHC class II–positive normal infiltrating B cells from the same primary tumor cell suspensions (supplemental Figure 7). cHLs with decreased HRS cell expression of MHC class II were significantly more likely to have MHCII copy loss than cHLs with intact HRS cell expression of MHC class II (P = .048, Fisher’s exact test; Figure 4E; supplemental Figure 7). These data are of particular interest because we previously reported that HRS cell surface expression of MHC class II, but not MHC class I, was predictive for response to PD-1 blockade.21
Key pathways perturbed by multiple genetic mechanisms.
By analyzing all genetic driver alterations, we observed that multiple components of key cHL signaling pathways were perturbed by different genetic mechanisms, including mutations, SCNAs, and SVs (Figures 4A and 5). For example, genetic bases of immune evasion included recurrent inactivating mutations of B2M and HLA-B, focal deletion of 6p21.32/HLA-B and the extended MHC class I and class II chromosome regions (6p21.32-6p21.33), and inactivating SVs of CIITA (Figures 4A,D and 5). In addition to genetic alterations of MHC class I and class II antigen presentation pathway components, cHLs exhibited 1p36.32/TNFRSF14 copy loss as described81 (Figures 4A and 5). Of note, TNFRSF14 deficiency has been reported to disrupt B- and T-lymphocyte attenuator inhibitory T-cell signals and induce a tumor-supportive microenvironment in GC B-cell lymphomas (Figure 5).81,82
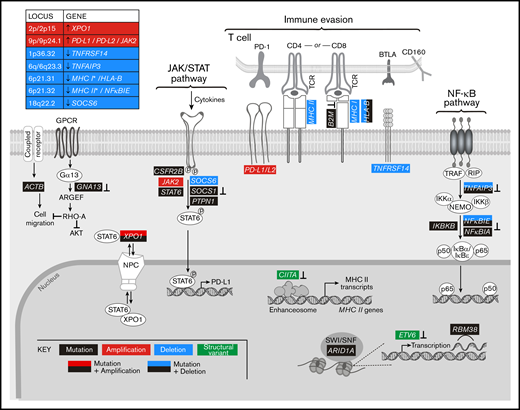
Graphical representation of the pathways perturbed in cHL. Comprehensive analysis of the genetic alterations, including mutations, SCNAs, and SVs, in cHL indicate that pathways can be perturbed by multiple mechanisms. Mutations or SVs that are known to inactivate the involved proteins are noted (⊥).
Graphical representation of the pathways perturbed in cHL. Comprehensive analysis of the genetic alterations, including mutations, SCNAs, and SVs, in cHL indicate that pathways can be perturbed by multiple mechanisms. Mutations or SVs that are known to inactivate the involved proteins are noted (⊥).
In addition, the primary cHLs exhibited recurrent 9p/9p24.1 copy gain (Figures 4A and 5), which is known to increase PD-1 ligand expression and associated PD-1 signaling.11,12,21 Chromosome 9p/9p24.1 copy gain also augments JAK2 abundance and JAK/STAT-dependent programmed death-ligand 1 (PD-L1) expression (Figure 5).14 In the primary cHLs, other known genetic bases of enhanced JAK/STAT signaling included activating STAT6 mutations and inactivating SOCS1 and PTPN1 mutations41,42 ; additional potential mechanisms included CSFR2B mutations, 18q22.2/SOCS6 copy loss, and altered XPO1-dependent STAT6 transport (Figures 4 and 5).50,51
The primary cHLs also exhibited multiple NF-κB pathway alterations: TNFAIP3 mutations and focal 6q23.3/TNFAIP3 or arm-level 6q copy loss; NFKBIE mutations and 6p21.32/NFKBIE copy loss; NFKBIA mutations and IKBKB mutations; and likely bases of enhanced PI3K signaling such as GNA13 and RBM38 mutations (Figures 4A and 5). The majority of the identified candidate drivers in primary cHLs were also detected in cHL cell lines (Figure 4B).
Temporal ordering of genetic events and mutational burden in cHL
We next determined the purity and ploidy for each primary cHL using ABSOLUTE, and we calculated the cancer cell fraction (CCF) for each genetic driver event (supplemental Table 9). The enriched HRS cell samples had a median purity of 78% and a median ploidy of 3.13 (range, 1.65-5.84 ploidy), which aligns with multinucleated structure of these tumor cells.89,90 Although there was no association between ploidy and the overall mutational burden (P = .3421) in the primary cHLs, ploidy and the number of driver events were significantly correlated (P = .0096) (supplemental Figure 8).
We classified each recurrent genetic alteration (CCGs, SCNAs with q < 0.1, and SVs occurring ≥2 times) as clonal or subclonal by using a CCF threshold of 0.9 (Figure 6). The majority of these alterations, including each of the CCGs and the 18q22.2, 6q23.3, 1p36.32, 6p21.32, 9p/9p24.1 and 2p/2p15 SCNAs, were clonal, suggesting that they were early pathogenetic events (Figure 6).
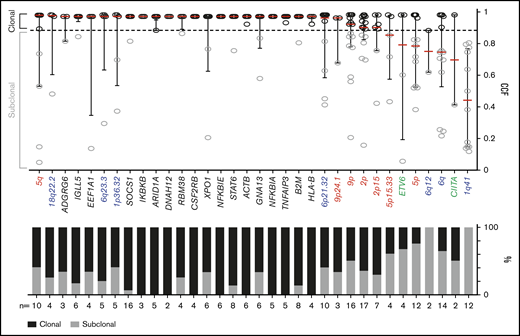
Clonality of genetic drivers in the primary cHLs. CCFs of genetic alterations (≥2 within the cohort). The alterations are ranked by the median CCF indicated as red bar (left to right, high to low), error bars, and interquartile range. Mutations, black; copy number (CN) gain, red; CN loss, blue; SVs, green. The staggered bar graph in the lower panel categorizes the alterations in percentage of clonal and subclonal alterations; the threshold for clonal alterations is a CCF of ≥0.9.
Clonality of genetic drivers in the primary cHLs. CCFs of genetic alterations (≥2 within the cohort). The alterations are ranked by the median CCF indicated as red bar (left to right, high to low), error bars, and interquartile range. Mutations, black; copy number (CN) gain, red; CN loss, blue; SVs, green. The staggered bar graph in the lower panel categorizes the alterations in percentage of clonal and subclonal alterations; the threshold for clonal alterations is a CCF of ≥0.9.
Comparison with other cancer subtypes
We next compared the genetic landscape of primary cHL (Figure 4) to that of a related cancer type, PMBL, described in a companion paper.22 In previous studies, we and others defined common transcriptional signatures and key signaling and immune evasion pathways in these cancers.11,14,91-94 We used mirror bar plots (Figure 7A) to compare the frequencies of the recurrent genetic alterations in cHL (Figure 4) to those in PMBL.22 Like cHL, PMBL exhibited recurrent alterations of B2M, TNFAIP3, CSF2RB, XPO1, STAT6, GNA13, and chromosomes 2p/2p15 (2p16.1), 6p21.32, 6q23.3, and 9p/9p24.1 (Figure 7A), highlighting the shared genetic features of these diseases.22
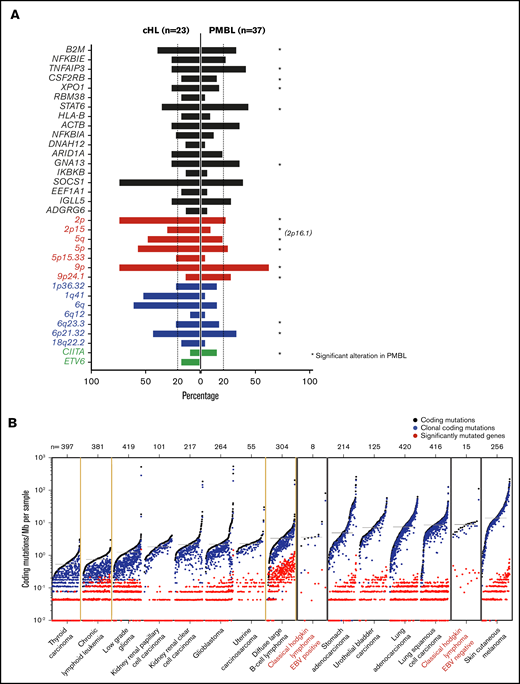
Comparative analysis between cHL and other lymphoid malignancies and cancer subtypes. (A) Mirror plots, centric to genetic alterations identified in cHL, generated by directly comparing cHL (n = 23) to PMBL (n = 37).22 Focal gain of 2p16.1, observed in PMBL,22 is labeled to indicate the similarity in the focal gain to that observed at 2p15 in cHL. Non-synonymous mutations, black; CN gain, red; CN loss, blue; SVs, green. *Indicates the genetic alteration was also significant in PMBL. (B) Cancer subtypes sorted by median of coding mutations per Mb per sample, with the tumor type labeled below and number of cases within each cohort shown at the top. EBV+ and EBV– cHL are labeled in red. EBV– tumors have a high mutational burden, similar to that of carcinogen-induced tumors (melanoma and squamous cell lung cancer).
Comparative analysis between cHL and other lymphoid malignancies and cancer subtypes. (A) Mirror plots, centric to genetic alterations identified in cHL, generated by directly comparing cHL (n = 23) to PMBL (n = 37).22 Focal gain of 2p16.1, observed in PMBL,22 is labeled to indicate the similarity in the focal gain to that observed at 2p15 in cHL. Non-synonymous mutations, black; CN gain, red; CN loss, blue; SVs, green. *Indicates the genetic alteration was also significant in PMBL. (B) Cancer subtypes sorted by median of coding mutations per Mb per sample, with the tumor type labeled below and number of cases within each cohort shown at the top. EBV+ and EBV– cHL are labeled in red. EBV– tumors have a high mutational burden, similar to that of carcinogen-induced tumors (melanoma and squamous cell lung cancer).
Thereafter, we sought to compare the tumor mutational burden (7.66 mutations per Mb) in primary cHLs to that in other cancers with available WES data31 (Figure 7B). The observed differences in numbers of driver events (Figure 4C) and mutational density (supplemental Figure 9) in EBV+ and EBV– cHLs prompted us to analyze these cHL subsets separately (Figure 7B). The median frequency of coding mutations in EBV– cHLs was among the highest described, comparable to that in carcinogen induced-tumors such as squamous cell lung carcinoma and melanoma (Figure 7B). These findings (Figure 7B) provide an additional potential basis for the sensitivity of cHLs to PD-1 blockade.
Discussion
Our comprehensive genomic analyses of flow cytometry–sorted HRS cells reveal complementary mechanisms—mutations, SCNAs, and SVs—of immune escape, NF-κB activation, and enhanced JAK/STAT and PI3K/AKT signaling in cHL (Figure 5). Our studies extend the findings in previously reported genetic analyses of cHL6,7,10 by using prioritization methods to identify bona fide CCGs and additional approaches to characterize mutational signatures, tumor mutational burden, recurrent focal and arm-level SCNAs, SVs, and co-occurring genetic legions to derive novel insights regarding the comprehensive genetic signature of cHL (supplemental Table 4).
Comparison of EBV– and EBV+ cHLs confirms that EBV– tumors are significantly more likely to exhibit genetic alterations of specific NF-κB signaling intermediaries and MHC class I antigen presentation pathway components (Figure 4). Of particular interest, the mutational burden in EBV– cHLs is among the highest reported, similar to that in carcinogen-induced tumors (Figure 7).
Additional previously unappreciated aspects of the cHL genetic signature include the likely role of ARID1A alterations in driver mutational events (Figure 4C),69 the predominant Aging mutational signature95 in this young patient population (Figure 2), and potential genetic mechanisms of defective cytokinesis2,3,60,61 in multinucleated HRS cells (Figure 5; supplemental Figure 3).
Importantly, the high mutational burden in EBV– cHLs and the genetically driven JAK/STAT signaling and MSI signatures in EBV– and EBV+ cHLs may be additional bases, beyond 9/9p24.1 SCNAs,11,20,21 for the sensitivity of these tumors to PD-1 blockade. In contrast, genetic alterations that decrease PTEN abundance and/or enhance PI3K signaling potentially limit the efficacy of PD-1 blockade96,97 in affected cHLs. In addition, the pervasive genetic alterations of MHC class I antigen presentation pathway components in EBV– cHLs (Figure 4) highlight the likely role of non-CD8+ T-cell effector mechanisms98,99 in PD-1 blockade in these tumors. The comprehensive cHL genetic landscape, including recurrent SCNAs and SVs, can now be translated into targeted assays of primary tumors and circulating tumor DNA10 to delineate bases of response and resistance to immunomodulatory therapy in pivotal clinical trials.
Acknowledgments
This work was supported by a grant from the National Institutes of Health, National Cancer Institute (R01 CA161026) (M.A.S.), the Miller Family Fund (M.A.S.), The Leukemia & Lymphoma Society (D.W., J.R.F., and M.A.S.), a Claudia Adams Barr Program Award in Basic Cancer Research (B.C.), and a Mobility Plus fellowship from the Polish Ministry of Science and Higher Education (1261/MOB/IV/2015/0) (K.B.). G.G. was partially supported by the Paul C. Zamecnick Chair in Oncology at the Massachusetts General Hospital Cancer Center.
Authorship
Contributions: K.W., B.C., C.S., and A.J.D. designed and performed the research, analyzed the data, and wrote the manuscript; J.K. analyzed the data and contributed to scientific discussions; A.K., F.Z.C., M.D.D., A.N., A.R.T., T.R.W., K.B., R.A.R., L.N.L., P.A., and S.J.R. contributed to the analysis and scientific discussions; A.T.H. and M.J.B. performed the flow cytometry research and analyzed the data; D.W., J.R.F., G.G., and M.A.S. designed and supervised the research and data analyses and wrote the manuscript; and all authors discussed the results and contributed to the final manuscript.
Conflict-of-interest disclosure: S.J.R. received research funding from Bristol-Myers Squibb, Meyer, KITE/Gilead, and Affimed. P.A. received research funding from Merck, Bristol-Myers Squibb, Adaptive, Roche, Tensha, Otsuka, Sigma-Tau Pharmaceuticals, and Genentech, served as a consultant for Merck, Bristol-Myers Squibb, Pfizer, Affimed, Adaptive, Infinity, and ADC Therapeutics, and has received honoraria from Merck and Bristol-Myers Squibb. G.G. received research funding from IBM and Pharmacylics and is an inventor on patent applications related to MuTect, ABSOLUTE, and MutSig. M.A.S. received research funding from Bristol-Myers Squibb, Bayer, and Merck, served on advisory boards for Bayer and Bristol-Myers Squibb, and received honoraria from Bristol-Myers Squibb and Bayer. The remaining authors declare no competing financial interests.
The current affiliation for A.K. is Bayer AG, Berlin, Germany.
The current affiliation for M.D.D. is Foundation Medicine, Cambridge, MA.
The current affiliation for A.T.H. is Allen Institute for Immunology, Seattle, WA.
The current affiliation for K.B. is Department of Experimental Hematology, Institute of Hematology and Transfusion Medicine, Warsaw, Poland.
Correspondence: Margaret A. Shipp, Dana-Farber Cancer Institute, 450 Brookline Ave, Mayer 513, Boston, MA 02215; e-mail: margaret_shipp@dfci.harvard.edu; and Gad Getz, Broad Institute of Harvard and MIT, 415 Main St, Cambridge, MA 02142; e-mail: gadgetz@broadinstitute.org; and Jonathan R. Fromm, Department of Laboratory Medicine, University of Washington, 1959 NE Pacific St, NW120, Seattle, WA 98195-7110; e-mail: jfromm@uw.edu.

