

Key Points
Administration of anti–TIM-1 blocking mAb ameliorates acute GVHD while preserving graft-versus-tumor effects.
Treatment with anti–TIM-1 blocking mAb does not affect proliferation of donor allogeneic T cells.

Abstract
Acute graft-versus-host disease (GVHD) is a leading cause of mortality after allogeneic hematopoietic cell transplantation (HCT) mediated by dysregulated T-cell immune reconstitution. Given the role of the T-cell immunoglobulin and mucin 1 (TIM-1) surface protein in many immune processes, including organ transplantation tolerance, we asked if TIM-1 might drive post-transplant inflammation and acute GVHD. TIM-1 binds to phosphatidylserine (PtdSer), and agonism of TIM1 on immune cells is proinflammatory. HCT conditioning results in a significant supply of PtdSer from apoptosis and cellular debris. Using murine models, treatment with an antagonistic anti–TIM-1 monoclonal antibody (mAb) protects against acute GVHD while maintaining graft-versus-tumor effects. In contrast, the addition of exogenous free PtdSer worsened GVHD in a TIM-1–dependent manner. Importantly, TIM-1 blockade did not alter the expansion of donor T cells in vitro or in vivo. Instead, TIM-1 blockade reduces proinflammatory cytokines and promotes anti-inflammatory factors like carbonic anhydrase 1 and serum amyloid A1 in the gut tissue. This is mediated by TIM-1 on donor cells, as HCT of wild-type (WT) bone marrow (BM) and conventional T (Tcon) cells into TIM-1−/− knockout (KO) recipient mice showed little survival advantage compared with WT recipients, whereas WT recipients of TIM-1−/− KO Tcon cells or TIM1−/− KO BM had improved survival, in part due to the expression of TIM-1 on donor invariant natural killer T cells, which drives inflammation. Finally, in a humanized mouse xenograft GVHD model, treatment with anti-human TIM-1 antagonist mAb reduced GVHD disease burden and mortality. This supports TIM-1 as important for GVHD pathogenesis and as a target for the prevention of GVHD.
Introduction
T-cell immunoglobulin and mucin 1 (TIM-1) (also known as HAVCR1 or KIM1) is a gene that regulates immune responses, including transplantation tolerance, allergy and asthma, autoimmunity, viral infections, and cancer.1-5 The role of TIM-1 in hematopoietic cell transplantation (HCT) or its major immune complication of graft-versus-host disease (GVHD) has not yet been evaluated.
TIM-1 binds to phosphatidylserine (PtdSer), a charged phospholipid that is normally compartmentalized to the inner leaflet of the cell membrane in living cells and is exposed on the cell surface during apoptosis.6,7 PtdSer can also be exposed on subcellular membrane debris or the surface of enveloped viruses,8 a phenomenon known as apoptotic mimicry.9 Studies have shown numerous viruses bind to TIM-1 through enveloped PtdSer. Concordant to this and in contrast to most pathways identified to involve PtdSer binding, agonism of TIM-1 in general creates rapid proinflammatory responses on a number of cell populations that express it, including T cells, CD1d-restricted invariant natural killer T cells (iNKT),10 mast cells, plasmacytoid dendritic cells, and epithelial cells.1,2 TIM-1 agonism also destabilizes B and T regulatory cells.11-13
HCT conditioning results in notable apoptotic and nonapoptotic cell death due to the irradiation or chemotherapy.14,15 The inflammatory milieu of this cell death is thought to contribute to dysregulated immune reconstitution after HCT and could help to drive acute GVHD, which is a severe alloreactive immune response mediated by donor T cells, some of which express TIM-1.16-18
We hypothesized that TIM1 might help drive inflammation and promote GVHD during posttransplant immune reconstitution.19 In support of this, TIM-1 has been shown to influence allograft tolerance in other settings, including in preclinical murine studies of solid organ and islet transplantation. Agonistic anti–TIM-1 monoclonal antibody (mAb) (3B3) in vivo resulted in allograft rejection in a pancreatic islet transplant model,11 whereas antagonistic anti–TIM-1 mAb (RMT1-10) in vivo resulted in acceptance of islet allografts.12
Using mouse models of HCT, we found that treatment with an antagonistic anti–TIM-1 mAb protects from lethal GVHD without compromising the GVT effect. Pointing to the potential important role for TIM-1 in integration of post-HCT immune danger signaling, the administration of exogenous subcellular PtdSer during HCT increases GVHD mortality, and this increased mortality is not observed in mice treated with anti–TIM1 mAb. Protection against GVHD appears to be mediated by the reduction of inflammatory response in the spleen and gut tissue, which is the target tissue with the highest mortality in human disease. Based on experiments with TIM-1−/− recipient vs donor graft constituents, the activity of TIM-1 on donor cells, including T and iNKT cells, contributes to GVHD. Anti-human TIM-1 mAb also ameliorated GVHD in a humanized mouse xenograft GVHD model. In sharp contrast to most therapeutic agents commonly used to prevent GVHD, anti–TIM-1 treatment does not affect the proliferation or expansion of allogeneic T cells in vitro or in vivo.
Materials and methods
Mice
Female mice between 7 and 10 weeks old were used for the experiments. BALB/c (H-2d), C57BL/6 (B6) (H-2b), FVB/N (H-2q), nonobese diabetic severe combined immunodeficiency interleukin-2 (IL-2) receptor γnull (NSG) mice mice were purchased from The Jackson Laboratory (Sacramento, CA). Luciferase-expressing (luc+) B6 (CD45.1, Thy1.1) mice were generated as described previously.20 TIM-1−/− mice on the BALB/c background were previously described21 and were bred at the Stanford animal facility. TIM-1−/− mice on the B6 background were generated by backcrossing the TIM-1−/− mice on the BALB/c to the B6 for 8 generations. Animal protocols were approved by the Institutional Animal Care and Use Committee of Stanford University.
Cell isolation
CD4/CD8 conventional T (Tcon) cells, CD4+ iNKT cells, and gut lymphocytes were prepared as described previously.22 Details regarding CD4+ iNKT cells isolation and in vitro preactivation with anti–TIM-1 (3B3) are in supplemental Materials and methods.
mAb treatment
Anti-mouse TIM-1 clone 3D10 (antagonist that blocks PtdSer binding),10 anti-mouse TIM-1 clone 3B3 (agonist),23 anti-mouse TIM-4 clone 21H12 (antagonist), and anti-human TIM-1 clone 1D12 (antagonist) mAbs24 have been previously described. Rat immunoglobulin G2a and mouse immunoglobulin G1 mAbs were used as isotype control mAb (BioXcell). Mice were injected intraperitoneally (IP) with 400 μg per mouse on days −1, 3, 7, 11, and 17 post-HCT.
Allogeneic BM transplantation and histopathology
Allogeneic bone marrow (BM) transplantation and histopathology were performed as described previously.22 Details regarding the different transplantation system are in supplemental Materials and methods.
Human xenograft GVHD model
NSG mice were irradiated with 250 cGy and subsequently injected IV with 5 × 10⁶ human peripheral blood mononuclear cells (PBMCs). On days −1, 3, 7, and 11 post-PBMC transfer, the anti-human TIM-1 mAb (clone 1D12, TIM-1 antagonist) was injected IP (250 μg per mouse). GVHD score was assessed as mentioned before.
Tumor model
To investigate graft-versus-tumor (GVT) activity, we used the A20 lymphoma model expressing luciferase, as previously described.22 1.0 × 10⁴ A20 lymphoma cells were injected IV with T-cell–depleted (TCD) BM on day 0 into BALB/c mice after traumatic brain injury (TBI). In a second model, 500 BCL1 leukemia cells were injected IV with TCD BM on day 0 into BALB/c mice after TBI.
BLI
Bioluminescence imaging (BLI) was performed as described previously25 with an IVIS Spectrum imaging system (Xenogen). Images were analyzed with Living Image Software 4.2 (Xenogen).
Mouse and human in vitro cell stimulation assays
For analysis of cell proliferation, murine B6 Tcon cells and PBMCs resuspended in PBS were stained with CellTrace violet for 5 minutes at 37°C using cell proliferation kit (Life Technologies) as per the manufacturer’s recommendations. Additional information on in vitro cell stimulation assays can be found in supplemental Materials and methods.
Flow cytometry
A complete list of mAbs and fluorochromes used can be found in supplemental Materials and methods. Murine CD1d tetramer loaded with PBS-57 (α-GalCer analog) was obtained from the National Institutes of Health Tetramer Facility. Data were collected using a BD LSR2 flow cytometer (BD Biosciences), and data were analyzed using FlowJo 10.0.7 software (Tree Star, Ashland, OR).
Cytokine analysis
For quantitative cytokine measurement, spleens were harvested on day 9 post-HCT, and splenocytes (0.5 × 10⁵ cells per well) were stimulated for 72 hours with anti-CD3/CD28 Dynabeads (ThermoFisher) in 96-well plates. Culture supernatants were analyzed for cytokine concentration by a multiplex assay (Luminex; Life Technologies, Logan, UT) as per the manufacturer’s recommendations.
qRT-PCR
Gut tissue was collected into a RNA stabilization buffer, cut into small pieces, and homogenized before loading onto a QIAshredder spin column (Qiagen). Details regarding the quantitative real-time polymerase chain reaction (qRT-PCR) assay can be found in supplemental Materials and methods.
Microarrays
Total RNA was extracted using an RNeasy Micro Kit (Qiagen), and its quality was assessed by an Agilent 2100 Bioanalyzer. Details regarding microarray assay and analysis can be found in supplemental Materials and methods.
Results
TIM-1 blockade protects transplant recipients from lethal GVHD
In order to test the efficacy of anti–TIM-1 treatment on GVHD, we used a HCT model in which lethally irradiated BALB/c (H-2d) mice received allogeneic BM and T cells from major histocompatibility complex–mismatched donor FVB/N (H-2q). BALB/c mice were treated with antagonistic anti–TIM-1 mAb (clone 3D10; 400 μg per mouse) or isotype control (2A3; 400 μg per mouse), on day −1 and days 3, 7, 11, and 17 of HCT. Mice treated with antagonistic anti–TIM-1 mAb showed less GVHD and improved survival compared with isotype controls (Figure 1A).
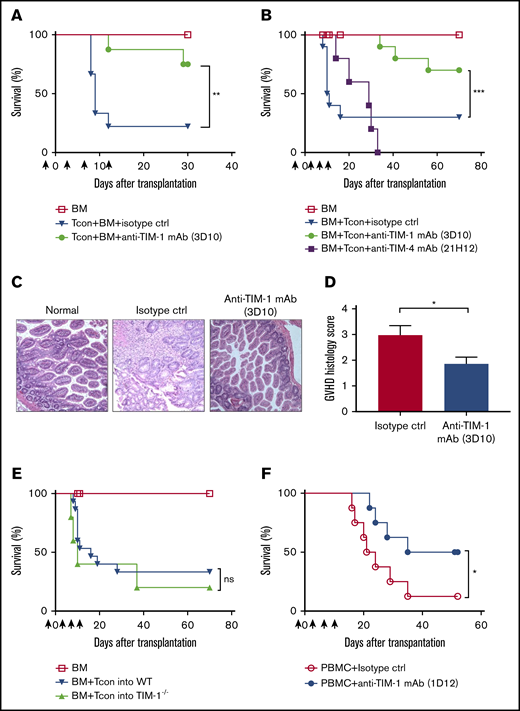
TIM-1 blockade protects transplant recipients from lethal GVHD. (A) Overall survival of allogeneic transplanted BALB/c recipient mice (n = 5 per group) after injection of only TCD BM and FVB/N Tcon cells (▼) or TCD BM, FVB/N Tcon cells, and anti–TIM-1 mAb (3D10; 400 μg given IP) (●). Pooled data are from 2 independent experiments (n = 10 per group). (B) Overall survival of allogeneic transplanted BALB/c recipient mice after transplantation with TCD BM and treatment with B6 Tcon cells alone (▼), Tcon cells and anti–TIM-1 mAb (3D10; 400 μg given IP) (●), or Tcon cells and anti-TIM-4 mAb (21H12; 400 μg given IP) (▪). Pooled data of 2 independent experiments are shown (n = 10 mice per group). Control mice received TCD BM only (☐). The log-rank test was used for statistical evaluation of mouse survival (Kaplan-Meier survival curves), with comparison of Tcon cells to Tcon cells and anti–TIM-1 mAb shown. (C) Representative photomicrographs of hematoxylin and eosin–stained sections of gut tissues (magnification ×200). BALB/c mice that received allogeneic Tcon cells and isotype mAb exhibit intestinal mucosa with increased crypt apoptosis and reactive epithelial changes. Focal crypt loss is seen (middle panel). BALB/c mice that that received Tcon cells + anti–TIM-1 mAb (3D10) exhibit intestinal mucosa with well-preserved villi and crypts. No histological evidence of GVHD is seen (right panel). (D) GVHD histology score as assessed by a histopathologist in a blinded fashion (n = 10 per group). (E) Overall survival of allogeneic transplanted WT BALB/c mice (▼) or TIM-1−/− knockout BALB/c recipient mice (▲) after transplantation with B6 TCD-BM and Tcon cells . Pooled data from 2 independent experiments are shown (n = 10 mice per group). Control mice that received TCD-BM only are indicated (☐). The log-rank test was used for statistical evaluation of mouse survival (Kaplan-Meier survival curves). (F) Overall survival of NSG mice transplanted with only Hu-PBMCs (◯) or PBMCs and anti-human TIM-1 mAb (1D12) (●). Statistically significant improved survival and a GVHD score are reported as pooled data from 2 independent experiments (n = 8 mice per group; 2-tailed Student t test). *P ≤ .05, **P ≤ .01, ***P ≤ .001. Error bars indicate standard error of the mean (SEM). Black arrows indicate anti–TIM-1 (3D10) mAb administration in relation to HCT (days −1, 3, 7, and 11). ns, not significant.
TIM-1 blockade protects transplant recipients from lethal GVHD. (A) Overall survival of allogeneic transplanted BALB/c recipient mice (n = 5 per group) after injection of only TCD BM and FVB/N Tcon cells (▼) or TCD BM, FVB/N Tcon cells, and anti–TIM-1 mAb (3D10; 400 μg given IP) (●). Pooled data are from 2 independent experiments (n = 10 per group). (B) Overall survival of allogeneic transplanted BALB/c recipient mice after transplantation with TCD BM and treatment with B6 Tcon cells alone (▼), Tcon cells and anti–TIM-1 mAb (3D10; 400 μg given IP) (●), or Tcon cells and anti-TIM-4 mAb (21H12; 400 μg given IP) (▪). Pooled data of 2 independent experiments are shown (n = 10 mice per group). Control mice received TCD BM only (☐). The log-rank test was used for statistical evaluation of mouse survival (Kaplan-Meier survival curves), with comparison of Tcon cells to Tcon cells and anti–TIM-1 mAb shown. (C) Representative photomicrographs of hematoxylin and eosin–stained sections of gut tissues (magnification ×200). BALB/c mice that received allogeneic Tcon cells and isotype mAb exhibit intestinal mucosa with increased crypt apoptosis and reactive epithelial changes. Focal crypt loss is seen (middle panel). BALB/c mice that that received Tcon cells + anti–TIM-1 mAb (3D10) exhibit intestinal mucosa with well-preserved villi and crypts. No histological evidence of GVHD is seen (right panel). (D) GVHD histology score as assessed by a histopathologist in a blinded fashion (n = 10 per group). (E) Overall survival of allogeneic transplanted WT BALB/c mice (▼) or TIM-1−/− knockout BALB/c recipient mice (▲) after transplantation with B6 TCD-BM and Tcon cells . Pooled data from 2 independent experiments are shown (n = 10 mice per group). Control mice that received TCD-BM only are indicated (☐). The log-rank test was used for statistical evaluation of mouse survival (Kaplan-Meier survival curves). (F) Overall survival of NSG mice transplanted with only Hu-PBMCs (◯) or PBMCs and anti-human TIM-1 mAb (1D12) (●). Statistically significant improved survival and a GVHD score are reported as pooled data from 2 independent experiments (n = 8 mice per group; 2-tailed Student t test). *P ≤ .05, **P ≤ .01, ***P ≤ .001. Error bars indicate standard error of the mean (SEM). Black arrows indicate anti–TIM-1 (3D10) mAb administration in relation to HCT (days −1, 3, 7, and 11). ns, not significant.
Using a different strain combination, lethally irradiated BALB/c (H-2d) mice received allogeneic B6 BM and Tcon cells (H-2b)26 together with immunomodulatory anti-TIM mAbs. Some recipients were treated with antagonistic anti–TIM-1 mAb (3D10; 400 μg per mouse), antagonistic anti–TIM-4 mAb (21H12; 400 μg per mouse), or isotype control (2A3; 400 μg per mouse) on day −1 and days 3, 7, 11, and 17 of HCT. Antagonistic anti–TIM-1 (3D10)–treated mice had less GVHD as measured by survival (Figure 1B). GVHD score was reduced as well (supplemental Figure 1A). Mice treated with the antagonistic anti–TIM-4 mAb (Figure 1B) during HCT had no difference in mortality. Histological analysis of intestinal tissue on day 9 post-HCT confirmed less severe disease in the mice that received the antagonistic anti–TIM-1 mAb (Figure 1C-D), while no differences were observed in liver or skin tissue (supplemental Figure 2).
In order to ascertain if TIM-1 blockade of the recipient or donor immune cells was responsible for protection against GVHD, we used TIM-1−/− knockout BALB/c mice as recipients of allogeneic HCT, and these mice showed no survival advantage (Figure 1E). This suggests that TIM-1 expression by donor graft constituent(s) influences GVHD.
To investigate whether the protection observed with anti–TIM-1 mAb treatment in the murine model of GVHD can be translated, we tested a xenograft model of GVHD. In this model, IV injection of human PBMCs into NSG mice results in xenogeneic GVHD mediated by human T cells.27 Anti-human TIM-1 mAb (1D12; 250 μg per mouse) was injected on day −1 and days 3, 7, and 11 after transfer of human PBMCs into NSG mice. As seen in Figure 1F and supplemental Figure 1B, mice that received the anti-human TIM-1 mAb showed significantly improved survival from xenogeneic GVHD as compared with those treated with isotype control. Furthermore, it is likely that mice treated with anti-human TIM-1 mAb died of anemia rather than GVHD, which suggests adequate hematopoietic immune clearance. It appears that TIM-1 on the donor graft mediates the protective effect, as the antibody reacts with human, but not mouse, TIM-1.
Mice treated with subcellular PtdSer exhibit more severe GVHD
Since HCT conditioning can cause massive cell apoptosis, we asked if PtdSer might influence GVHD. Exogenous soluble PtdSer (40 μg per mouse) was administered IV on the same day as allogeneic B6 Tcon cells into BALB/c HCT mice, and GVHD was monitored in isotype vs antagonistic anti–TIM-1 mAb (3D10)–treated recipient mice. Mice that received allogeneic Tcon cells and exogenous PtdSer exhibited more severe GVHD than mice that received allogeneic Tcon cells alone (Figure 2A-B). Mice treated with exogenous PtdSer and anti–TIM-1 mAb did not have increased GVHD, suggesting a dependency of TIM-1 in driving PtdSer-induced inflammation.
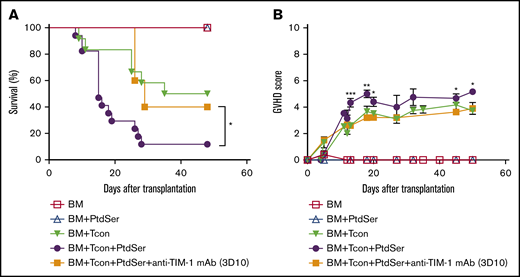
Mice treated with subcellular PtdSer exhibit worse lethal GVHD. (A-B) Overall survival (A) and GVHD score (B) of allogeneic transplanted BALB/c recipient mice after transplantation with TCD-BM and treatment with B6 Tcon cells (▼), Tcon cells plus PtdSer (40 μg per mouse given IV) (●), or Tcon cells and PtdSer plus anti–TIM-1 mAb (3D10; 400 μg per mouse given IP) (▪). Control mice that received TCD BM only are indicated (☐). For the survival curve and GVHD score, pooled data from 3 independent experiments are shown (n = 16 per group). The log-rank test was used for statistical evaluation of mouse survival (Kaplan-Meier survival curves), with comparison of Tcon cells plus PtdSer with Tcon cells shown (*P ≤ .05; 2-tailed Student t test). Error bars indicate SEM.
Mice treated with subcellular PtdSer exhibit worse lethal GVHD. (A-B) Overall survival (A) and GVHD score (B) of allogeneic transplanted BALB/c recipient mice after transplantation with TCD-BM and treatment with B6 Tcon cells (▼), Tcon cells plus PtdSer (40 μg per mouse given IV) (●), or Tcon cells and PtdSer plus anti–TIM-1 mAb (3D10; 400 μg per mouse given IP) (▪). Control mice that received TCD BM only are indicated (☐). For the survival curve and GVHD score, pooled data from 3 independent experiments are shown (n = 16 per group). The log-rank test was used for statistical evaluation of mouse survival (Kaplan-Meier survival curves), with comparison of Tcon cells plus PtdSer with Tcon cells shown (*P ≤ .05; 2-tailed Student t test). Error bars indicate SEM.
TIM-1 is upregulated on donor Tcon cells, iNKT cells, and Foxp3+ T cells after HCT
To investigate whether TIM-1 expression changes with HCT, we compared TIM-1 expression among naive BALB/c mice and BALB/c mice that received either TBI alone or TBI and TCD-BM together with B6 Tcon cells. We observed that TIM-1 expression increases on both recipient (H-2d+) and donor cells (H-2b+), with a higher expression on donor cells. Specifically, we observed an increased TIM-1 expression on Tcon cells, iNKT cells, and Foxp3+ T cells in mice that received irradiation alone compared with naive BALB/c mice. However, TIM-1 expression is more pronounced on donor Tcon cells, iNKT cells, and Foxp3+ T cells compared with the respective recipient cells populations in mice that received an allotransplant on day 4 post-HCT, as seen in Figure 3A-C.
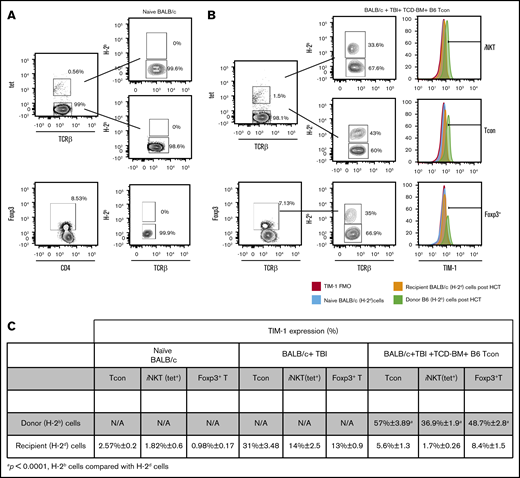
TIM-1 is upregulated on donor Tcon cells, iNKT and Foxp3+T cells after HCT. (A-B) Representative flow cytometry plots of TIM-1 staining on iNKT (top), Tcon cells (middle), and Foxp3+ T cells (bottom) isolated from the spleen on day 4 after HCT from naive BALB/c mice (A) or BALB/c mice that received TCD BM and B6 Tcon cells after TBI (B). (C) Table showing accumulative data from 3 independent experiments (n = 9/group) from naive BALB/c mice, BALB/c mice treated with TBI alone, and BALB/c mice that in addition to TBI received TCD BM and B6 Tcon cells. The distinction between donor and recipient cells on day 4 post-HCT was determined by flow cytometry based on H-2Kb and H-2Dd surface staining. For statistical analysis between the donor and recipient cells in the mice that received TBI, TCD BM, and B6 Tcon cells, a 2-tailed Student t test was used (mean ± SEM; P ≤ .0001). Gating was based on TIM-1 fluorescence-minus-one control on recipient BALB/c (H-2d) cells post-HCT. N/A, not applicable; TCR, T-cell receptor; tet, tetramer.
TIM-1 is upregulated on donor Tcon cells, iNKT and Foxp3+T cells after HCT. (A-B) Representative flow cytometry plots of TIM-1 staining on iNKT (top), Tcon cells (middle), and Foxp3+ T cells (bottom) isolated from the spleen on day 4 after HCT from naive BALB/c mice (A) or BALB/c mice that received TCD BM and B6 Tcon cells after TBI (B). (C) Table showing accumulative data from 3 independent experiments (n = 9/group) from naive BALB/c mice, BALB/c mice treated with TBI alone, and BALB/c mice that in addition to TBI received TCD BM and B6 Tcon cells. The distinction between donor and recipient cells on day 4 post-HCT was determined by flow cytometry based on H-2Kb and H-2Dd surface staining. For statistical analysis between the donor and recipient cells in the mice that received TBI, TCD BM, and B6 Tcon cells, a 2-tailed Student t test was used (mean ± SEM; P ≤ .0001). Gating was based on TIM-1 fluorescence-minus-one control on recipient BALB/c (H-2d) cells post-HCT. N/A, not applicable; TCR, T-cell receptor; tet, tetramer.
Blockade of TIM-1 on allogeneic donor T and iNKT cells ameliorates GVHD
Given the evidence that antagonistic TIM-1 mAb (3D10) acts on cells within the donor graft to ameliorate GVHD, we transplanted TIM-1−/− knockout or wild-type (WT) Tcon cells from B6 mice into BALB/c recipients. Injection of TIM-1−/− knockout Tcon resulted in less severe GVHD (Figure 4A-B). Transfer of WT allogeneic Tcon and TIM-1−/− knockout BM showed a trend toward delayed GVHD, but differences in overall survival were not statistically significant. Given these results, TIM-1 blockade on T cells of the donor graft appears to mediate protection against lethal GVHD.
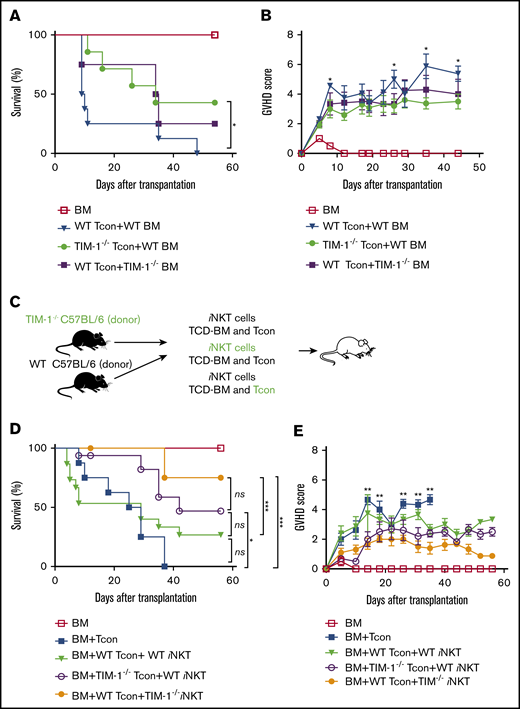
Blockade of TIM-1 on allogeneic donor T and iNKT cells ameliorates GVHD. (A-B) Overall survival (A) and GVHD score (B) of WT BALB/c recipient mice after transplantation with B6 (WT) Tcon cells and WT BM (▼), TIM-1−/− Tcon cells and WT BM (●), or WT Tcon cells and TIM-1−/− BM (▪). For the survival curve and GVHD, pooled data from 2 independent experiments are shown (TCD BM, n = 8 mice per group; WT Tcon cells + WT BM, n = 8 mice/group; TIM-1−/− Tcon cells and WT BM, n = 7 mice per group; and WT Tcon cells and TIM-1−/− BM, n = 8 mice per group). (C) Schematic of the experimental design of BALB/c recipient mice that received B6 or TIM-1−/− iNKT cells in addition to B6 Tcon cells or TIM-1−/− Tcon cells. (D-E) Overall survival (D) and GVHD score (E) of BALB/c recipient mice after injection of B6 Tcon cells alone (▪), B6 WT Tcon and B6 WT iNKT cells (25 000 enriched iNKT cells per mouse) (▼), B6 TIM-1−/− Tcon and B6 WT iNKT cells (◯), or B6 WT Tcon and B6 TIM-1−/− iNKT cells (●). GVHD scores for control mice that received only TCD BM are shown (☐). Statistical analysis for GVHD score is shown between the B6 WT Tcon cell plus B6 WT iNKT cell and B6 WT Tcon cell plus B6 TIM-1−/− iNKT cell groups. Data are pooled from 2 independent experiments (n = 16 mice per group). Statistical evaluations of mouse survival (the log-rank test was used for Kaplan-Meier survival) and GVHD score (2-tailed Student t test) were performed. *P ≤ .05, ***P ≤ .01. Error bars indicate SEM.
Blockade of TIM-1 on allogeneic donor T and iNKT cells ameliorates GVHD. (A-B) Overall survival (A) and GVHD score (B) of WT BALB/c recipient mice after transplantation with B6 (WT) Tcon cells and WT BM (▼), TIM-1−/− Tcon cells and WT BM (●), or WT Tcon cells and TIM-1−/− BM (▪). For the survival curve and GVHD, pooled data from 2 independent experiments are shown (TCD BM, n = 8 mice per group; WT Tcon cells + WT BM, n = 8 mice/group; TIM-1−/− Tcon cells and WT BM, n = 7 mice per group; and WT Tcon cells and TIM-1−/− BM, n = 8 mice per group). (C) Schematic of the experimental design of BALB/c recipient mice that received B6 or TIM-1−/− iNKT cells in addition to B6 Tcon cells or TIM-1−/− Tcon cells. (D-E) Overall survival (D) and GVHD score (E) of BALB/c recipient mice after injection of B6 Tcon cells alone (▪), B6 WT Tcon and B6 WT iNKT cells (25 000 enriched iNKT cells per mouse) (▼), B6 TIM-1−/− Tcon and B6 WT iNKT cells (◯), or B6 WT Tcon and B6 TIM-1−/− iNKT cells (●). GVHD scores for control mice that received only TCD BM are shown (☐). Statistical analysis for GVHD score is shown between the B6 WT Tcon cell plus B6 WT iNKT cell and B6 WT Tcon cell plus B6 TIM-1−/− iNKT cell groups. Data are pooled from 2 independent experiments (n = 16 mice per group). Statistical evaluations of mouse survival (the log-rank test was used for Kaplan-Meier survival) and GVHD score (2-tailed Student t test) were performed. *P ≤ .05, ***P ≤ .01. Error bars indicate SEM.
One subpopulation of T cells in the donor graft, iNKT cells, has been shown to powerfully modulate GVHD.18 TIM-1 is constitutively expressed on iNKT cells, and TIM-1 agonism in these cells appears proinflammatory.10 To confirm this, we compared the cytokine profile from the supernatant of sorted TIM-1−/− knockout iNKT cells vs WT iNKT cells that were stimulated with anti-CD3/CD28 beads. As seen in supplemental Figure 4, levels of proinflammatory cytokines tumor necrosis factor α (TNF-α) and IL-2 were reduced in the supernatant of the TIM-1−/− knockout iNKT cells compared with WT iNKT cells, yet the level of immunoregulatory cytokines such as IL-4 and IL-13 remained the same.
We tested whether TIM-1 signaling in iNKT cells could worsen GVHD, whereas blockade of TIM-1 signaling could ameliorate acute GVHD. TIM-1−/− knockout vs WT iNKT cells were transferred into BALB/c mice with WT versus TIM-1−/− knockout Tcon cells (Figure 4C). In addition, WT iNKT cells that had been previously incubated with agonistic anti–TIM-1 mAb (3B3) or isotype control mAb were transferred into BALB/c mice with WT Tcon cells. Mice that received either WT Tcon and iNKT cells incubated with the agonistic anti–TIM-1 mAb (3B3) developed worse GVHD compared with mice that received WT Tcon cells and TIM-1−/− knockout iNKT cells. Mice that received TIM-1−/− knockout Tcon cells and WT iNKT cells also showed ameliorated acute GVHD (Figure 4D-E; supplemental Figure 3). These results suggest that loss of TIM-1 signaling in iNKT cells protects against GVHD.
Antagonistic anti–TIM-1 mAb does not interfere with the GVT effect
To test the consequences of anti–TIM-1 mAb therapy on the GVT effect, we used the BALB/c A20 B cell lymphoma model of hematological cancer in which mice are inoculated prior to HCT from B6 donors. Mice treated with antagonistic anti–TIM-1 mAb (3D10) cleared the A20 cells equally as well as mice that did not receive the anti-TIM-1 mAb (Figure 5A-D). In another tumor model, BALB/c mice treated with antagonistic anti–TIM-1 mAb (3D10) cleared BCL1 leukemia as well as the mice that did not receive the anti–TIM-1 mAb (supplemental Figure 5A-C). In addition, in both tumor models, anti–TIM-1 mAb (3D10) in the absence of donor Tcon cells did not exert a potentially confounding direct antitumor effect (Figure 5A-C; supplemental Figure 5A-C).

Antagonistic anti–TIM-1 does not interfere with GVT effect. Mice were infused IV with Luc+ A20 tumor cells on day 0 of BM transplantation. Tumor growth of Luc+ A20 cells as assessed by BLI. BALB/c recipient mice were transplanted with B6 TCD BM and Luc+ A20 cells (☐), Luc+ A20 cells and anti–TIM-1 mAb (3D10; 400 μg per mouse given IP) (▪), Tcon and Luc+ A20 cells (▼), or Tcon, Luc+ A20 cells and anti–TIM-1 mAb (3D10; 400 μg per mouse given IP) (●). (A) Representative bioluminescence images on days +7, +10, and +14 after transplantation are shown. (B) Bioluminescence signal intensity time course, pooled across 3 independent experiments with n ≥ 4 mice per group. (C-D) Tumor-free survival curve (C) and GVHD-free survival (D) of BALB/c recipient mice transplanted with B6 TCD BM and Luc+ A20 cells (☐), Luc+ A20 cells and anti–TIM-1 mAb (3D10; 400 μg per mouse given IP) (▪), Tcon and Luc+ A20 cells (▼), or Tcon, Luc+ A20 cells and anti–TIM-1 mAb (3D10; 400 μg per mouse given IP) (●). The animal from the BM plus Tcon-cell plus A20-cell group that was reported in the tumor-free survival curve was excluded from the GVHD-free survival curve. The animals that survived and are reported in panel D were tumor-free. Error bars indicate SEM. For statistical analysis, the 2-tailed Student t test was used. *P ≤ .05, ***P ≤ .001.
Antagonistic anti–TIM-1 does not interfere with GVT effect. Mice were infused IV with Luc+ A20 tumor cells on day 0 of BM transplantation. Tumor growth of Luc+ A20 cells as assessed by BLI. BALB/c recipient mice were transplanted with B6 TCD BM and Luc+ A20 cells (☐), Luc+ A20 cells and anti–TIM-1 mAb (3D10; 400 μg per mouse given IP) (▪), Tcon and Luc+ A20 cells (▼), or Tcon, Luc+ A20 cells and anti–TIM-1 mAb (3D10; 400 μg per mouse given IP) (●). (A) Representative bioluminescence images on days +7, +10, and +14 after transplantation are shown. (B) Bioluminescence signal intensity time course, pooled across 3 independent experiments with n ≥ 4 mice per group. (C-D) Tumor-free survival curve (C) and GVHD-free survival (D) of BALB/c recipient mice transplanted with B6 TCD BM and Luc+ A20 cells (☐), Luc+ A20 cells and anti–TIM-1 mAb (3D10; 400 μg per mouse given IP) (▪), Tcon and Luc+ A20 cells (▼), or Tcon, Luc+ A20 cells and anti–TIM-1 mAb (3D10; 400 μg per mouse given IP) (●). The animal from the BM plus Tcon-cell plus A20-cell group that was reported in the tumor-free survival curve was excluded from the GVHD-free survival curve. The animals that survived and are reported in panel D were tumor-free. Error bars indicate SEM. For statistical analysis, the 2-tailed Student t test was used. *P ≤ .05, ***P ≤ .001.
Treatment with anti–TIM-1 blocking mAb does not affect Tcon-cell expansion or proliferation in vivo or in vitro
Therapeutics used to interrupt major T-cell–signaling pathways and reduce T-cell proliferation, such as calcineurin inhibitors, antimetabolites like mycophenolate mofetil, or posttransplant cyclophosphamide, are the backbone of modern strategies to prevent transplantation rejection,28 although possibly at the risk of tumor relapse and infection. We sought to determine if the protection from lethal GVHD afforded by anti–TIM-1 treatment was due to a reduction in the proliferation and expansion of donor T cells or alternative mechanisms, such as changes in the T-cell inflammatory profile.
To address whether treatment with antagonistic TIM-1 mAb affects T-cell responses in vitro, CellTrace violet–labeled murine Tcon cells were stimulated with anti-CD3 and anti-CD28 beads in the presence of antagonistic anti–TIM-1 mAb (3D10) or isotype control. We also performed mixed lymphocyte reactions (MLRs) in which Tcon cells were isolated from the spleen of WT mice by CD4+ and CD8+ positive selection, labeled with CellTrace violet and incubated for 4 days with either irradiated allogeneic splenocytes in the presence of anti–TIM-1 mAb (3D10) or isotype control mAb. In both anti-CD3/CD28 stimulation and MLR, there was no difference in T-cell proliferation with antagonistic anti–TIM-1 mAb (3D10) vs isotype control mAb. No difference was observed in the upregulation of CD25 surface expression on activated Tcon cells (49.3 ± 0.75 in the anti–TIM-1 mAb [3D10]–treated group vs 48.87 ± 2.11 in the isotype-treated group [mean ± SEM]) (supplemental Figure 6). iNKT-cell proliferation is also not affected by anti–TIM-1 mAb (supplemental Figure 7A-D). In addition, there is no difference in the proliferation of WT and TIM-1−/− knockout Tcon cells (supplemental Figure 7E). Consistent with the murine data, anti-human TIM-1 blocking mAb had no effect on the proliferation of CD3+ T cells purified from human PBMCs either in an in vitro human MLR or following anti-CD3/CD28 stimulation of human T cells (Figure 6B).

Treatment with antagonistic anti–TIM-1 mAb does not affect Tcon-cell expansion or proliferation in vivo or in vitro. (A) TIM-1 blockade does not affect murine T-cell proliferation in MLR cell culture. Allogeneic responder Tcon cells were labeled with CellTrace violet and stimulated with irradiated splenocytes as antigen-presenting cells (APC) for 7 days at a ratio of 1:2 in the presence or absence of anti–TIM-1 mAb (3D10). In separate cultures, responder T cells were stimulated with anti-CD3/CD28 Dynabeads at 1:2 ratio in the presence or absence of anti–TIM-1 mAb (3D10; 20 μg/mL). Pooled data from 2 independent experiments are shown (n = 8 per group). (B) TIM-1 blockade does not affect human T cell proliferation in MLR cell culture. Monocyte-derived immature dendritic cells were generated from PBMCs. The dendritic cells were irradiated (30 Gy) and cocultured with allogeneic responder PBMCs for 7 days at a ratio of 1:5 in the presence or absence of antagonistic anti–TIM-1 mAb (1D12; 20 μg/mL). In separate cultures, responder PBMCs were stimulated with anti-CD3/CD28 Dynabeads (ThermoFisher) at a 1:1 ratio in the presence of anti–TIM-1 mAb or isotype control. Pooled data from 3 independent experiments are shown (n = 12 donors per group) for the MLR and (n = 6 donors per group) for anti-CD3/CD28 stimulation with statistical evaluation using the paired Student t test. (C) Representative serial bioluminescence images at days +3, +5, +7, +14, and +23 after transplantation of from Luc+ B6 donor mice to assess the proliferative capacity of T cells in the presence of anti–TIM-1 mAb (3D10). (D) Bioluminescence signal intensity time course. Allogeneic transplanted BALB/c recipient mice after injection of luc+ Tcon cells alone (▼) or Tcon cells and anti–TIM-1 mAb (3D10) (●). Mice that were injected only with BM (☐) were used as controls. Error bars indicate SEM. (E) Cytokine levels in the supernatant of splenocytes stimulated ex vivo with anti-CD3/CD28 Dynabeads beads, as assessed by a multiplex assay (Luminex). Splenocytes were isolated at day 9 after transplantation from spleens of BALB/c recipient mice treated with isotype control (white bars) or anti–TIM-1 mAb (3D10) (black bars). Shown are pooled data from 3 independent experiments. For statistical analysis, the 2-tailed Student t test was used (*P ≤ .05, **P ≤ .01, ***P ≤ .01). Error bars indicate SEM.
Treatment with antagonistic anti–TIM-1 mAb does not affect Tcon-cell expansion or proliferation in vivo or in vitro. (A) TIM-1 blockade does not affect murine T-cell proliferation in MLR cell culture. Allogeneic responder Tcon cells were labeled with CellTrace violet and stimulated with irradiated splenocytes as antigen-presenting cells (APC) for 7 days at a ratio of 1:2 in the presence or absence of anti–TIM-1 mAb (3D10). In separate cultures, responder T cells were stimulated with anti-CD3/CD28 Dynabeads at 1:2 ratio in the presence or absence of anti–TIM-1 mAb (3D10; 20 μg/mL). Pooled data from 2 independent experiments are shown (n = 8 per group). (B) TIM-1 blockade does not affect human T cell proliferation in MLR cell culture. Monocyte-derived immature dendritic cells were generated from PBMCs. The dendritic cells were irradiated (30 Gy) and cocultured with allogeneic responder PBMCs for 7 days at a ratio of 1:5 in the presence or absence of antagonistic anti–TIM-1 mAb (1D12; 20 μg/mL). In separate cultures, responder PBMCs were stimulated with anti-CD3/CD28 Dynabeads (ThermoFisher) at a 1:1 ratio in the presence of anti–TIM-1 mAb or isotype control. Pooled data from 3 independent experiments are shown (n = 12 donors per group) for the MLR and (n = 6 donors per group) for anti-CD3/CD28 stimulation with statistical evaluation using the paired Student t test. (C) Representative serial bioluminescence images at days +3, +5, +7, +14, and +23 after transplantation of from Luc+ B6 donor mice to assess the proliferative capacity of T cells in the presence of anti–TIM-1 mAb (3D10). (D) Bioluminescence signal intensity time course. Allogeneic transplanted BALB/c recipient mice after injection of luc+ Tcon cells alone (▼) or Tcon cells and anti–TIM-1 mAb (3D10) (●). Mice that were injected only with BM (☐) were used as controls. Error bars indicate SEM. (E) Cytokine levels in the supernatant of splenocytes stimulated ex vivo with anti-CD3/CD28 Dynabeads beads, as assessed by a multiplex assay (Luminex). Splenocytes were isolated at day 9 after transplantation from spleens of BALB/c recipient mice treated with isotype control (white bars) or anti–TIM-1 mAb (3D10) (black bars). Shown are pooled data from 3 independent experiments. For statistical analysis, the 2-tailed Student t test was used (*P ≤ .05, **P ≤ .01, ***P ≤ .01). Error bars indicate SEM.
To determine the effect of anti–TIM-1 mAb treatment on proliferation and expansion of Tcon cells in vivo, irradiated BALB/c recipient mice received TCD-BM and luc+ B6 Tcon cells and their expansion as well as proliferation was monitored by BLI. There was no difference in the expansion of donor luc+ Tcon cells between mice treated with anti–TIM-1 mAb (3D10) and control mice (Figure 6C-D). This suggests that TIM-1 blockade may have a lasting effect on T-cell reconstitution in terms of modifying the posttransplant milieu of the T cells, since proliferation/expansion of the T cells is not altered.
Treatment with anti–TIM-1 blocking mAb reduces inflammation in the spleen after HCT
Since T-cell proliferation is unaffected, we next investigated whether TIM-1 blockade might alter inflammation following HCT. To evaluate this, lethally irradiated BALB/c mice underwent HCT from B6 donors, and recipients were treated with antagonistic anti–TIM-1 mAb (3D10) vs isotype control. On day 9 post-BMT, when clinical signs of acute GVHD are observed, no difference was seen in the percentage of total T-cell receptor (TCR) β+ cells, CD4+ T cells, and CD8+ T cells in total T cells, regulatory T cells, or plasmacytoid dendritic cells in the spleens of mice that were treated with the anti–TIM-1 mAb (3D10) vs the isotype control mAb. However, the percentage and absolute number of total iNKT cells was significantly increased with anti–TIM-1 mAb treatment (supplemental Figure 8A-C). Supernatants collected from splenocytes cultured with anti-CD3/CD28 beads were analyzed for cytokine concentration by a multiplex assay (Luminex). Production of TNF-α, interferon-γ (IFN-γ) MCP-1, and IL-1β by splenocytes harvested from mice treated with anti–TIM-1 mAb was significantly lower compared with splenocytes from mice treated with isotype control mAb (Figure 6E). IL-2, IL-10, IL-4, and IL-12 were not detectable. TNF-α and IFN-γ levels in the serum collected on day 9 post-HCT from mice that were treated with the anti–TIM-1 mAb (3D10) were lower compared with cytokine levels in the spleen, and no differences were detectable between mice treated with anti–TIM-1 mAb (3D10) and isotype mAb (supplemental Figure 9). MCP-1 and IL-1β were not detectable in the serum. These data indicate that blockade of TIM-1 reduces splenic CD3/CD28–stimulated T-cell cytokine responses after HCT.
Treatment with anti–TIM-1 blocking mAb reduced inflammatory factors and infiltrating cells in the intestine following HCT
Since the gut is the major site of GVHD activity and driver of mortality, we next examined if TIM-1 blockade alters inflammation in the gut following HCT. Lethally irradiated BALB/c mice underwent HCT from B6 donors, and recipients were treated with antagonistic anti–TIM-1 mAb (3D10) vs isotype control. On day +9 following HCT, we observed no difference in the absolute number of T cells infiltrating the gut of treated vs untreated recipient mice by flow cytometry. We found no difference in the number of regulatory T cells or plasmacytoid dendritic cells, but there was an increase in the absolute number of iNKT cells (Figure 7A).
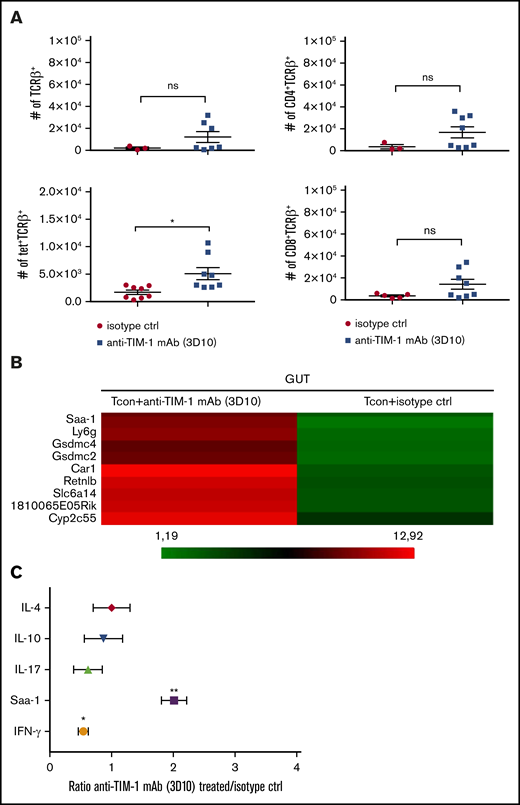
Treatment with anti–TIM-1 blocking mAb reduced inflammatory factors and infiltrating cells in the gut following HCT. (A) Absolute numbers of CD4+TCRβ+, CD8+TCRβ+, tet+TCRβ+, and CD4+CD25+Foxp3+ cells isolated at day 9 after transplantation from the gut of BALB/c recipient mice treated with isotype control (●) or anti–TIM-1 mAb (3D10) (▪). PBS-57–loaded murine CD1d tetramer was used to identify iNKT cells. Pooled data from 2 independent experiments are shown (n = 8 per group). For statistical analysis, the 2-tailed Student t test was used (*P ≤ .05). Error bars indicate SEM. (B) Microarray heatmap of whole gut cells isolated at day 9 after transplantation from BALB/c recipient mice treated with isotype control or anti–TIM-1 mAb (3D10). Representative results from 2 independent analyses are shown. Red indicates upregulated genes, and green indicates downregulated genes. Genes of interested are indicated. (C) IL-17, IL-10, IL-4, IFN-γ, and Saa-1 mRNA levels were assessed by qRT-PCR on whole cells isolated at day 9 after transplantation from gut of BALB/c recipient mice treated with isotype control or anti–TIM-1 mAb (3D10). The x-axis represents the ratio of TIM-1 to isotype control of relative gene expression normalized to the BM control. Shown are representative results in triplicate from 2 independent experiments. For statistical analysis, the 2-tailed Student t test was used (*P ≤ .05, **P ≤ .01).
Treatment with anti–TIM-1 blocking mAb reduced inflammatory factors and infiltrating cells in the gut following HCT. (A) Absolute numbers of CD4+TCRβ+, CD8+TCRβ+, tet+TCRβ+, and CD4+CD25+Foxp3+ cells isolated at day 9 after transplantation from the gut of BALB/c recipient mice treated with isotype control (●) or anti–TIM-1 mAb (3D10) (▪). PBS-57–loaded murine CD1d tetramer was used to identify iNKT cells. Pooled data from 2 independent experiments are shown (n = 8 per group). For statistical analysis, the 2-tailed Student t test was used (*P ≤ .05). Error bars indicate SEM. (B) Microarray heatmap of whole gut cells isolated at day 9 after transplantation from BALB/c recipient mice treated with isotype control or anti–TIM-1 mAb (3D10). Representative results from 2 independent analyses are shown. Red indicates upregulated genes, and green indicates downregulated genes. Genes of interested are indicated. (C) IL-17, IL-10, IL-4, IFN-γ, and Saa-1 mRNA levels were assessed by qRT-PCR on whole cells isolated at day 9 after transplantation from gut of BALB/c recipient mice treated with isotype control or anti–TIM-1 mAb (3D10). The x-axis represents the ratio of TIM-1 to isotype control of relative gene expression normalized to the BM control. Shown are representative results in triplicate from 2 independent experiments. For statistical analysis, the 2-tailed Student t test was used (*P ≤ .05, **P ≤ .01).
We performed a microarray analysis of the large intestine on day 9 posttransplantation and identified genes differentially expressed between the treated and untreated groups (supplemental Figure 10A). Recipient mice treated with anti–TIM-1 antagonistic antibody (3D10) had an upregulation of genes associated with anti-inflammatory responses, including carbonic anhydrase 1, resistin like β, and serum amyloid A1 (Figure 7B). Carbonic anhydrase 1 and serum amyloid A1 have a protective role in inflammatory bowel disease,29,30 and resistin like β has an immunoregulatory function in the gastrointestinal track.31 IL-10 receptor α, IL-4, and IL-13 upstream regulators are activated in the anti-TIM-1 (3D10) mAb–treated group (supplemental Figure 10B). There was no difference in the expression of genes associated with cell cycle and activation (supplemental Table 1), which is in agreement with our in vitro and in vivo T-cell expansion and proliferation data. In addition, inflammation of the intestine was downregulated based on pathway analysis in the anti–TIM-1 antagonistic mAb (3D10)–treated group (supplemental Table 2).
To further examine the mechanisms of anti–TIM-1 protection against GVHD, we performed a qRT-PCR analysis of the intestine from mice that received allogeneic Tcon cells and were treated with the antagonistic anti–TIM-1 mAb vs isotype control. As seen in Figure 7C, at day +9 after HCT, IFN-γ expression was significantly lower in the gut tissue of the mice treated with the antagonistic anti–TIM-1 mAb (3D10) compared with mice that were treated with isotype control mAb.
These data collectively indicate that TIM-1 blockade promotes an anti-inflammatory environment in the large intestine, pointing toward a critical role for TIM-1 in immune reconstitution following HCT, based upon this molecule’s function in promoting inflammation.
Discussion
Cell death and apoptosis are inherent to most HCT conditioning regimes, since irradiation and chemotherapy lead to significant tissue damage.19 Conditioning initiates a proinflammatory response that can adversely activate allogeneic T cells and lead to dysregulated immunity and GVHD.14,15 PtdSer is found in the inner leaflet of the cell membrane of living cells, but when a cell undergoes apoptosis, it is exposed on the outer membrane leaflet, where it can bind to the TIM-1 receptor, which is considered a damage-associated molecular pattern receptor whose agonistic binding increases inflammatory responses.6,7
In our murine experimental system of a major histocompatibility complex–mismatched GVHD model, we showed that the TIM-1 pathway modulates GVHD outcome by altering the intensity of donor cell inflammation and the resultant inflammation in the gut, a pivotal GVHD target organ. We showed that treatment with an anti–TIM-1 mAb (anti-murine 3D10 and anti-human 1D12) protected against GVHD in multiple strain combinations of murine HCT as well as a human-mouse xenograft model. Blockade of TIM-1 ameliorates acute GVHD without altering T-cell proliferation in vitro or in vivo, which stands apart mechanistically from current clinical agents used to control alloreactive T cells and ameliorates acute GVHD after HCT.
A concern of any immunomodulatory therapy is that it might reduce the GVT effect. GVT is an important aspect of HCT, as donor T cells are able to recognize residual cancer cells, eliminate them, and significantly decrease the risk of tumor relapse.32 We saw in 2 tumor models no evidence of impaired GVT effect following TIM-1 mAb treatment.
Since TIM-1−/− knockout recipient mice are not protected against GVHD, we reasoned that TIM-1 on donor graft cells is critical for GVHD. We further identified that TIM-1–mediated protection against GVHD was primarily mediated by TIM-1 on T cells in the donor graft. Given recent evidence that iNKT cells powerfully modulate GVHD22 and a known role for TIM-1 in regulating inflammatory responses in this population,10 we found that blockade of TIM-1 on donor iNKT cells protected against GVHD. It is not clear why anti–TIM-1 treatment appeared to increase iNKT cells during posttransplant reconstitution in the spleen and gut, but increased iNKT numbers have been associated with reduced GVHD.22
Given that TIM-1 is expressed by many cell types, including other donor T cells like Tregs and Th2 cells,23 it is likely that TIM-1 is acting in a pleotropic fashion on donor T-cell constituents. Importantly, all of these populations may be more sensitive to PtdSer damage-associated molecular pattern recognition, as we observed an upregulation of TIM-1 on donor Tcon cells, iNKT cells, and Foxp3+ T cells after HCT.
Treatment of GVHD using a TIM-1 blocking mAb could have an advantage over current prophylactic clinical approaches. The use of immunosuppressive drugs targeting T-cell proliferation subjects the allogeneic HCT patients to increased risk of opportunistic infections, toxicities, and disease relapse. TIM-1 blockade does not affect the expansion of the allogeneic T cells in vitro or in vivo or the proliferation of iNKT cells in vitro.
Since many types of virus incorporate PtdSer into membrane envelopes and viruses use TIM-1 in their replicative life cycle, TIM-1 sits at the immune surveillance crossroads of apoptosis, cellular death, and viral infection.3 TIM-1 blockade might lead to susceptibility to viruses if immune responsiveness to viruses coated with TIM-1 were blunted; alternatively, viral infectivity could be inhibited by TIM-1 blockade.33,34
TIM-1 allelic variants in humans have been associated with susceptibility to infection, autoimmune disease, and asthma in both humans and mice, leading to questions about how human polymorphism may affect HCT.5
The TIM-1 pathway appears to play an important role in GVHD following HCT and is a target of prophylactic treatment to prevent GVHD. A potential advantage of anti-TIM treatment compared with commonly used prophylactic treatments is that it maintains the GVT effect but at the same time does not affect the normal expansion of donor allogeneic T cells, instead acting to change the intensity of inflammation following HCT.
Acknowledgments
The authors thank Kent P. Jensen and Jeanette Baker for assistance with the Luminex multiplex assay. PBS-57–loaded mCD1d tetramer was provided by the National Institutes of Health Tetramer Facility.
This work was supported by the National Institutes of Health, National Heart, Lung, and Blood Institute (K08HL119590), an Amy Manesevit Award from the National Marrow Donor Program and American Society of Blood and Marrow Transplantation, a Stanford SPARK pilot grant, and the National Institutes of Health, National Institute of Allergy and Infectious Diseases R01 AI089955 (G.J.F. and R.H.D.).
Authorship
Contributions: B.P.I. designed and performed research, analyzed data and wrote the manuscript. K.H., M.P.-C., S.-W.T, W.W.P., and T.E. performed research; N.K. evaluated histopathology and took photomicrographs; G.J.F and R.H.D. provided overall feedback; E.H.M. is the senior author of this study and provided overall guidance; and all authors edited the manuscript for content.
Conflict-of-interest disclosure: Office of Technology Licensing has licensed intellectual property for which E.H.M., B.P.I., and R.H.D. are named coinventors. G.J.F., R.H.D., and E.H.M. have an equity interest in Triursus Therapeutics. The remaining authors declare no competing financial interests.
Correspondence: Everett H. Meyer, Division of Blood and Marrow Transplantation, Department of Medicine, Stanford University School of Medicine, 269 West Campus Dr, CCSR Building, Room 2245C, Stanford, CA 94305-5623; e-mail: evmeyer@stanford.edu.

