

Key Points
Low or nondetectable MRD pre-HCT leads to similar outcomes, suggesting that MRD negativity is not an absolute prerequisite for HCT.
MRD post-HCT is more important than pre-HCT, and monitoring with sensitive techniques can detect very high-risk patients early.

Abstract
Detection of minimal residual disease (MRD) pre– and post–hematopoietic cell transplantation (HCT) for pediatric acute lymphoblastic leukemia (ALL) has been associated with relapse and poor survival. Published studies have had insufficient numbers to: (1) compare the prognostic value of pre-HCT and post-HCT MRD; (2) determine clinical factors post-HCT associated with better outcomes in MRD+ patients; and (3) use MRD and other clinical factors to develop and validate a prognostic model for relapse in pediatric patients with ALL who undergo allogeneic HCT. To address these issues, we assembled an international database including sibling (n = 191), unrelated (n = 259), mismatched (n = 56), and cord blood (n = 110) grafts given after myeloablative conditioning. Although high and very high MRD pre-HCT were significant predictors in univariate analysis, with bivariate analysis using MRD pre-HCT and post-HCT, MRD pre-HCT at any level was less predictive than even low-level MRD post-HCT. Patients with MRD pre-HCT must become MRD low/negative at 1 to 2 months and negative within 3 to 6 months after HCT for successful therapy. Factors associated with improved outcome of patients with detectable MRD post-HCT included acute graft-versus-host disease. We derived a risk score with an MRD cohort from Europe, North America, and Australia using negative predictive characteristics (late disease status, non–total body irradiation regimen, and MRD [high, very high]) defining good, intermediate, and poor risk groups with 2-year cumulative incidences of relapse of 21%, 38%, and 47%, respectively. We validated the score in a second, more contemporaneous cohort and noted 2-year cumulative incidences of relapse of 13%, 26%, and 47% (P < .001) for the defined risk groups.
Introduction
Assessment of minimal residual disease (MRD) either by real-time quantitative polymerase chain reaction (qPCR) to detect immunoglobulin and T-cell receptor (TCR) gene rearrangements or by multiparameter flow cytometry (MFC) is standard of care in children and adolescents with acute lymphoblastic leukemia (ALL).1 Treatment response measured by using MRD is one of the most important criteria for stratification of patients into higher or lower risk groups, who then receive more or less intensive therapy, respectively.
Allogeneic hematopoietic cell transplantation (HCT) is a well-established treatment modality for high-risk patients with ALL.2 Recent improvements in HCT have decreased nonrelapse mortality (NRM), making relapse the major cause of treatment failure.3 Studies have noted that detection of MRD before HCT conditioning predicts relapse and poor survival.4-9 In addition, a handful of studies showing detectable MRD after HCT also defined an increased risk of relapse.9-12 These studies had insufficient numbers to allow the multivariate analysis necessary to put the predictive power of MRD into the context of other independent risk factors through risk modeling. These articles also did not offer insight into when in the course of the HCT process MRD measures matter the most, what the implications of serial positivity of MRD are, and what clinical factors post-HCT can modify the course of patients who are either MRD+ pre-HCT or become MRD+ post-HCT.
To address these issues, representatives from pediatric transplant groups in Europe, North America, and Australia (Children’s Oncology Group [COG], Pediatric Blood & Marrow Transplant Consortium [PBMTC], Australian Transplantation Group, International Berlin-Frankfurt-Münster [I-BFM] Study Group and Pediatric Diseases Working Party of the European Society for Blood and Marrow Transplantation, and all members of the Westhafen Intercontinental Group13 ) assembled an international database. Our analysis included 2 standardized approaches to MRD: the COG flow method used in North America and the EuroMRD qPCR approach used in Europe and Australia. Our analysis exceeds previously reported data set numbers by nearly sixfold, allowing us to define the relative risk of pre-HCT and post-HCT MRD in the context of other independent risk factors for patients with B-cell or T-cell ALL coming to HCT in early, intermediate, or late stages of treatment.
Methods
Study design
This multicenter observational study was designed to: (1) compare the prognostic value of pre-HCT and post-HCT MRD; (2) determine clinical factors post-HCT associated with better outcomes in MRD+ patients; and (3) use MRD and other clinical factors to develop and validate a prognostic model for relapse in pediatric and young adult patients with ALL who underwent allogeneic HCT.
Study participants
The study included 616 patients with ALL between the ages of 1 and 21 years who had undergone an allogeneic HCT who were in complete remission and had at least 1 MRD measurement before HCT. Data included patients enrolled in prospective trials or consented for center-specific databases after approval of local ethics committees. Data from post-HCT MRD were not released to clinicians in COG/PBMTC, France, and Germany; physicians from 2 centers in North America (Seattle and Minnesota), Australia, The Netherlands, and Italy were aware of the MRD results.
MRD detection
Real-time qPCR of immunoglobulin and TCR gene rearrangements was measured according to the ALL criteria of the EuroMRD Consortium14,15 and were reported from authorized laboratories.16 MFC MRD was measured by using 6-color flow cytometry17 at authorized laboratories according to COG standards.18,19
MRD was assessed in 2550 bone marrow samples: 616 pre-HCT (MRDpre-HCT) and 1934 post-HCT (MRDpost-HCT). The qPCR cohort included 1640 measurements of patients from Australia and Europe (n = 356), and the MFC cohort included 910 MRD assessments of patients from North America (n = 260). MRDpost-HCT was assessed in 372, 218, 334, 383, 386, and 241 patients within the first, second, third, fourth to sixth, seventh to 12th months, and later, respectively.
Definitions
Patients were classified into 4 groups: undetectable MRD was considered MRD negative; detectable MRD <10−4 (qPCR) or <0.01% (MFC) was MRD low positive; MRD ≥10−4 to <10−3 (qPCR) or ≥0.01 to <0.1% (MFC) was MRD high positive; and MRD ≥10−3 (qPCR) or ≥0.1% (MFC) was MRD very high positive. This grouping strategy for MFC and qPCR levels was confirmed previously in pediatric ALL.20
Acute graft-versus-host disease (aGVHD) and chronic GVHD (cGVHD) were diagnosed and graded according to standard criteria.
Statistics
Descriptive statistics are presented as absolute value and percentages or quartiles with range for categorized and quantitative variables, respectively. Patient-, disease-, and transplant-related variables were compared by using Fisher’s exact test or the χ2 test for categorical variables; the Wilcoxon-Mann-Whitney test was used for continuous variables. Median follow-up time was obtained by using the reverse Kaplan-Meier method.21 Probabilities of overall survival (OS) and event-free survival (EFS) were estimated by using the Kaplan-Meier product limit method. Events for EFS included relapse, secondary malignancy, and NRM. NRM was defined as death by any cause without prior relapse. Estimates of cumulative incidence of relapse (CIR) 22 were derived, considering NRM and secondary malignancy as competing risks. Cumulative incidence of aGVHD was estimated considering NRM and relapse as competing risks. Univariate comparisons of OS and EFS probabilities were performed by using the log-rank test,23 and Gray’s test24 was used for univariate analysis of the cumulative incidences.
We analyzed the association between MRDpre-HCT or MRDpost-HCT and relapse or EFS by using Cox proportional hazards models.25 First, we performed a univariate analysis with a standard Cox regression model for MRDpre-HCT and a time-dependent Cox regression model26 for all measurements of MRDpost-HCT. A second bivariate Cox regression model was fitted including MRDpre-HCT as a fixed covariate and MRDpost-HCT as a time-varying covariate.
The prognostic information contained in MRDpre-HCT and MRDpost-HCT was assessed through the concordance index (c-index),27 the likelihood ratio χ2 statistic, and the partial effect of each variable. The c-index is the probability of concordance between the predicted and the observed outcome. Log likelihoods are very suitable for quantifying the prognostic information contained in a variable compared with the information contained in the entire set of variables. The partial effect of each variable was assessed by computing the proportion of explainable log-likelihood by each variable (ie, the Wald χ2 statistic) minus its degree of freedom.28
To assess the influence of both MRD after HCT and aGVHD on relapse, a time-dependent Cox regression model was also used, entering both factors as time-dependent covariates. The considered levels were MRD negative vs MRD positive and no aGVHD vs aGVHD.
We performed a landmark analysis29 using time intervals from [0-45] days, [46-75] days, [76-115] days, [150-210] days, and [305-425] days for the analysis of MRD+30, MRD+60, MRD+90, MRD+180, and MRD+365, respectively. The time to event was considered from HCT or the landmark day to the first event date or the last follow-up date. To evaluate the effect of both variables MRD and aGVHD on EFS, a Cox proportional hazards model was performed while cause-specific Cox proportional hazards models were used to analyze the effect of both variables on relapse.
Prognostic model using clinical characteristics and MRD pre-HCT
The entire patient data set (N = 616) was divided by time of HCT (August 1999-May 2015) into 2 equal samples. We used the data set from the first period (August 1999-April 2009; n = 308 [50%]) to develop the risk model and evaluated its performance in the second time period data (May 2009-May 2015; n = 308 [50%]). The end point of the prognostic model was CIR up to 2 years after HCT.
Covariates with missing data were handled with multiple imputations. To take into account the heterogeneity of the treatment effects or baseline risks that may vary among centers, we used extended Fine-Gray proportional hazards model for subdistribution30 considering the center as a cluster. The variables considered in the initial model were: MRD (MRD <10−4 or <0.01%, MRD high positive, and MRD very high positive), sex, age, remission status (first complete remission [CR1], second complete remission [CR2], and higher than CR2 [>CR2]), immune phenotype (B vs T lineage), breakpoint cluster region abelson (BCR/ABL) and mixed lineage leukemia (MLL) gene rearrangement, stem cell source (bone marrow, peripheral blood, and cord blood), donor (matched sibling donor, matched unrelated donor, mismatched donor, and cord) and conditioning regimen (total body irradiation [TBI] vs non-TBI). After manual backward stepwise variable selection using P > .05, the remaining variables were used to build the final model, derive regression coefficients, and generate the risk score.31 The integrated risk score was generated by adding the rounded β*10 estimations. The first and third quartiles of the integrated score were used to define the good, intermediate, and poor outcome groups.
For validation, the second temporal data set (patients who received HCT between May 2009 and May 2015) was used. The distributions of the integrated scores between the derivation and validation sets were compared by using histograms. The integrated scores were validated by calculating the regression coefficients and hazard ratios (HRs) in the validation set. To evaluate the discriminative ability of the model and the integrated risk scores, the c-index for the competing risk model was used in the derivation and validation sets.32 We computed the bootstrap cross-validation estimate of the c-index taking out random samples with replacements 300 times at 3, 6, 12, 18, and 24 months. The calibration of the model was assessed graphically by comparing the predicted probability of relapse vs the observed probability of relapse across the quartiles of predicted risk.33
All statistical tests were 2-sided, and P < .05 was considered significant. Analyses were performed by using statistical software R version 3.3.3.34
Results
Overall cohort
A total of 616 eligible pediatric and young adult patients with ALL received HCT between September 1999 and May 2015. Patient and donor characteristics are given in Table 1. Median survival follow-up was 4.6 years (range, 0.16-15 years). Overall, 400 (65%) of the 616 patients were alive, 357 of whom were in complete remission at last follow-up, deriving an estimated 4-year OS and EFS probability of 63% (95% confidence interval [CI], 59-68) and 57% (95% CI, 53-61), respectively. A total of 175 (28%) patients relapsed, 79 (13%) patients died in remission after transplantation, and 5 (1%) developed a secondary malignancy, resulting in a 4-year CIR of 30% (95% CI, 26-34) and an NRM of 14% (95% CI, 11-17).
Patient characteristics of the overall cohort, the derivation cohort, and the validation cohort
| Characteristic | Overall cohort | Derivation cohort | Validation cohort | P |
|---|---|---|---|---|
| N (%) | 616 (100) | 308 (50) | 308 (50) | |
| HCT time period | August 1999-May 2015 | August 1999-April 2009 | May 2009-May 2015 | |
| Method, n (%) | .001 | |||
| MFC | 260 (58) | 110 (36) | 150 (49) | |
| qPCR | 356 (42) | 198 (64) | 158 (51) | |
| MRD categories, n (%) | <.001 | |||
| Negative | 331 (54) | 174 (56) | 157 (51) | |
| Low | 107 (17) | 32 (10) | 75 (24) | |
| High | 82 (13) | 49 (16) | 33 (11) | |
| Very high | 96 (16) | 53 (17) | 43 (14) | |
| Age at HCT, y | .279 | |||
| Median | 9.6 | 9.2 | 9.8 | |
| 1st quartile-3rd quartile | 6.0-14 | 6.0-14 | 6.0-14 | |
| Range | 0.5-21.9 | 0.5-21.9 | 0.7-21.4 | |
| Age groups, n (%) | .612 | |||
| <2 y | 26 (4) | 13 (4) | 13 (4) | |
| 2 to 10 y | 308 (50) | 160 (52) | 148 (48) | |
| ≥10 y | 282 (46) | 135 (44) | 147 (48) | |
| Sex, n (%) | .803 | |||
| Female | 234 (38) | 115 (37) | 119 (39) | |
| Male | 382 (62) | 193 (63) | 189 (61) | |
| Remission status, n (%) | .164 | |||
| CR1 | 236 (38) | 112 (36) | 124 (40) | |
| CR2 | 339 (55) | 170 (55) | 169 (55) | |
| >CR2 | 41 (7) | 26 (8) | 15 (5) | |
| Subgroup CR2, n (%) | ||||
| Time to relapse | .001 | |||
| Very early | 72 (21) | 34 (20) | 38 (22) | |
| Early | 114 (34) | 53 (31) | 61 (36) | |
| Late | 129 (38) | 62 (36) | 67 (40) | |
| No data | 24 (7) | 21 (12) | 3 (2) | |
| Site to relapse | .007 | |||
| Isolated BM | 240 (71) | 132 (78) | 108 (64) | |
| Isolatedextramedullary | 45 (13) | 13 (8) | 32 (19) | |
| BM combined | 51 (15) | 24 (14) | 27 (16) | |
| No data | 3 (1) | 1 (1) | 2 (1) | |
| Immunophenotype, n (%) | .266 | |||
| BCP | 494 (80) | 253 (82) | 241 (78) | |
| T lineage | 122 (20) | 55 (18) | 67 (22) | |
| BCR/ABL rearrangement, n (%) | .501 | |||
| Negative | 445 (72) | 224 (73) | 221 (72) | |
| Positive | 54 (9) | 30 (10) | 24 (8) | |
| No data | 117 (19) | 54 (18) | 63 (20) | |
| MLL rearrangement, n (%) | .011 | |||
| Negative | 374 (61) | 201 (65) | 173 (56) | |
| Positive | 22 (4) | 14 (5) | 8 (3) | |
| No data | 220 (36) | 93 (30) | 127 (41) | |
| Donor, n (%) | <.001 | |||
| MSD | 191 (31) | 98 (32) | 93 (30) | |
| MUD | 259 (42) | 142 (46) | 117 (38) | |
| MMD | 56 (9) | 36 (12) | 20 (6) | |
| Cord | 110 (18) | 32 (10) | 78 (25) | |
| Stem cell source, n (%) | <.001 | |||
| BM | 385 (62.5) | 200 (65) | 185 (60) | |
| PB | 104 (16.9) | 67 (22) | 37 (12) | |
| CB | 127 (20.6) | 41 (13) | 86 (28) | |
| Conditioning, n (%) | .044 | |||
| TBI-based | 521 (84.6) | 251 (81) | 270 (88) | |
| Non–TBI-based | 95 (15.4) | 57 (19) | 38 (12) |
P values were determined by using Fisher’s exact test, χ-quadrant test, or Wilcoxon-Mann-Whitney test; no data values were excluded. The variables time to relapse and site of relapse were available for all patients with remission = CR2 at HCT. The percentages of patients with both variables were calculated considering patients with CR2 as 100%.
BCP, B-cell precursor; BM, bone marrow; CB, cord blood; MMD, mismatched donor; MUD, matched unrelated donor; MSD, matched sibling donor; PB, peripheral blood.
About 63% of the patients developed aGVHD with a median onset (range) of 22 (4-301) days. Grade II to IV aGVHD occurred in 249 patients with a cumulative incidence of 40% (95% CI, 37-44). Grade III to IV aGVHD was observed in 77 patients (cumulative incidence, 13%; 95% CI, 10-15); cGVHD developed in 128 (21%) patients (95% CI, 18-24). Supplemental Tables 1 to 5 summarize the results of the outcomes and univariate analyses for OS, EFS, CIR, and NRM.
Prognostic value of pre-HCT MRD and post-HCT MRD
Detectable MRDpre-HCT and MRDpost-HCT exhibited a significant association with both EFS and relapse (Figure 1A; supplemental Figure 1). Higher MRD was strongly associated with inferior EFS and a higher CIR. Patients classified as MRD negative, MRD low, MRD high positive, and MRD very high had a 2-year CIR of 20%, 19%, 35%, and 44%, respectively (HR, 0.87, 1.75, and 2.85; P =.575, P =.009, and P < .001), showing no effect on outcome when MRDpre-HCT is detected at the lowest levels. After HCT, measures of MRD ≥ MRD low were always highly predictive of relapse (HR, 1.65, 4.39, 14.58; P = .022, P < .001, P < .001). Importantly, detectable MRD at any level (including the lowest level) on days +180 and +365 was highly predictive of relapse and poor survival (supplemental Figures 1E-F). Conversely, patients who were MRD negative on day +365 had long-term survival of 90%.
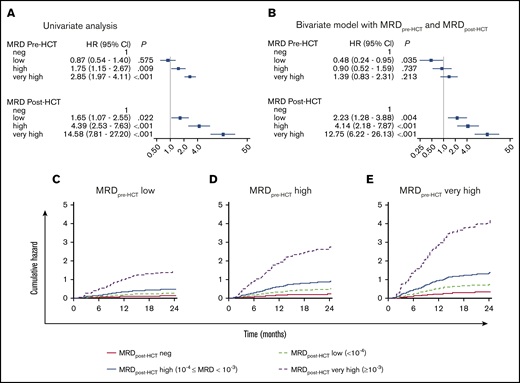
Influence on relapse of MRDpre-HCT and MRDpost-HCT. HRs for relapse from a Cox regression model (A) considering only pre-HCT MRD or considering only post-HCT MRD treated as time-dependent covariate (B) with both variables MRDpre-HCT as a fixed covariate and MRDpost-HCT as a time-dependent covariate. Cumulative hazard of relapse from children with ALL who were MRD positive before HCT low (C), high (D), and very high (E). The MRD values after transplant are MRD negative (neg; solid red line), MRD low positive (dashed light green line), MRD high positive (solid blue line), and MRD very high positive (dashed purple line); the values were treated as time-dependent covariates. The vertical line represents an HR of 1 for reference.
Influence on relapse of MRDpre-HCT and MRDpost-HCT. HRs for relapse from a Cox regression model (A) considering only pre-HCT MRD or considering only post-HCT MRD treated as time-dependent covariate (B) with both variables MRDpre-HCT as a fixed covariate and MRDpost-HCT as a time-dependent covariate. Cumulative hazard of relapse from children with ALL who were MRD positive before HCT low (C), high (D), and very high (E). The MRD values after transplant are MRD negative (neg; solid red line), MRD low positive (dashed light green line), MRD high positive (solid blue line), and MRD very high positive (dashed purple line); the values were treated as time-dependent covariates. The vertical line represents an HR of 1 for reference.
Is the prognostic value of pre-HCT MRD higher or lower than post-HCT MRD?
To answer this question, a time-dependent Cox regression analysis based on MRD measurements before transplant (fixed covariate) and MRD assessments after transplant (time-dependent covariate) was performed. When MRDpre-HCT and MRDpost-HCT were considered individually, each had a significant prognostic value. However, in the bivariate analysis considering both pre-HCT and post-HCT measures of MRD simultaneously, the MRDpre-HCT became less important in determining risk compared with the post-HCT MRD (Figure 1B). In other words, after the HCT begins, the presence or absence of MRD post-HCT is very important, with marked increases in risk if it is present. Figure 1C-E illustrates this finding showing that the cumulative hazard risk of relapse is more strongly influenced by MRDpost-HCT than by MRDpre-HCT.
We also assessed the prognostic value contained in the MRDpre-HCT or MRDpost-HCT to predict relapse using the c-index, the likelihood ratio χ2 statistic, and the partial effect of each variable. The c-index measured the amount of agreement between MRDpre-HCT or MRDpost-HCT and time until relapse. The c-index was higher for the MRDpost-HCT than for the MRDpre-HCT (c-index = 0.649 vs 0.612). Similarly, the likelihood ratio χ2 for the MRDpost-HCT was also higher (98.18 vs 33.71). Furthermore, the prognostic value of both MRDpre-HCT and MRDpost-HCT was evaluated with the proportion of explainable log-likelihood by each variable, which indicates the amount of prognostic information contained in a given variable. The proportion of explainable risk of relapse from MRDpost-HCT was 58% (P < .001), whereas that from MRDpre-HCT was 7% (P = .007); these findings indicate that the relative importance of MRDpost-HCT to predict relapse is significantly higher than that of MRDpre-HCT.
Predictive power of MRD measurements posttransplant according to the presence and level of previous HCT MRD
Figure 1C-E shows cumulative hazards of relapse. As might be expected, patients who were MRD negative or MRD low before transplant and remained negative during the post-HCT MRD monitoring period (first 3-12 months, depending on center preferences) have a low risk for relapse and an excellent chance of survival. Conversely, higher levels of pre-HCT MRD led to marked increases in risk when any level of MRD was noted post-HCT (especially high levels of MRD).
Figure 2 shows the predicted event-free survival probabilities and relapse incidences from a Cox regression model considering the level of MRD pre-HCT in the context of post-HCT MRD assessments. A key observation is that the most important factor in determining whether patients have a chance of survival when they choose to undergo HCT with detectable MRD before transplant is whether they achieve negative or low MRD status in their follow-up measures early posttransplant. Patients who did not achieve MRD low or negative results (instead showing high or very high MRD levels post-HCT) had an 40% to 100% chance of relapse. It is also notable that patients with pre-HCT MRD levels that were high have a reasonable chance of survival if they achieve MRD negativity early after HCT and maintain it during their first year post-HCT.
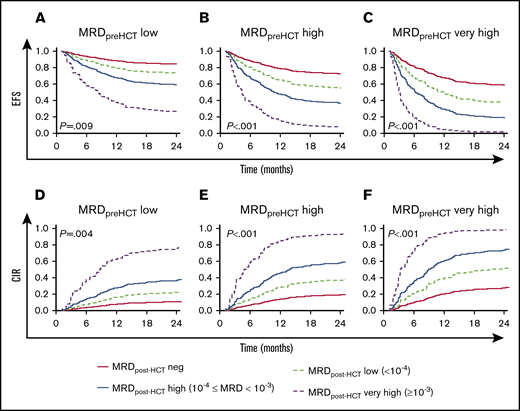
Predicted EFS and CIR in patients with MRD post-HCT according to their pre-HCT MRD level. (A-C) Model-based EFS. (D-F) A model-based CIR. The model is presented in Figure 1B. The lines represented the predicted outcome for reference children with MRD assessed on day +30 after HCT. The red solid lines represent the outcome for reference children whose MRD was negative. The dashed light green lines show the predicted outcome for reference children whose MRD was low. Analogously, the blue solid lines illustrate the reference children whose MRD measurements were high, and the dashed purple lines represent the predicted outcome for reference children with MRD very high. In addition, panels A and D are the prediction considering MRD before HCT = low, panels B and E are the prediction considering MRD before HCT = high, and panels C and F are the prediction considering MRD before HCT = very high.
Predicted EFS and CIR in patients with MRD post-HCT according to their pre-HCT MRD level. (A-C) Model-based EFS. (D-F) A model-based CIR. The model is presented in Figure 1B. The lines represented the predicted outcome for reference children with MRD assessed on day +30 after HCT. The red solid lines represent the outcome for reference children whose MRD was negative. The dashed light green lines show the predicted outcome for reference children whose MRD was low. Analogously, the blue solid lines illustrate the reference children whose MRD measurements were high, and the dashed purple lines represent the predicted outcome for reference children with MRD very high. In addition, panels A and D are the prediction considering MRD before HCT = low, panels B and E are the prediction considering MRD before HCT = high, and panels C and F are the prediction considering MRD before HCT = very high.
Sensitivity of MRD detection by MFC vs qPCR
We compared the percentage of patients with detectable MRD by using MFC vs qPCR in our 2 cohorts. At all time points, qPCR detected more than twice the percentage of patients than MFC. This differed according to level of MRD, as shown by pre-HCT data (supplemental Table 6). High-level MRD detection was equivalent using the 2 approaches (MFC vs qPCR, 15% vs 16%); however, detection of low-level MRD (<0.01% MFC, <10−4 qPCR) was very different, with disease detected at low levels pre-HCT in only 2% of MFC patients vs 28% of qPCR patients. Although the 2 patient cohorts differed in many aspects, it is unlikely that the large difference in detection of low-level disease was due to patient population disease differences; instead, this observation reflects increased sensitivity of European standardized qPCR measures compared with COG standardized flow assessments over the period this trial was performed. Because pre-HCT outcomes for patients with lower level MRD vs undetectable MRD did not differ, the clinical relevance of undetected low-level MRD in the MFC cohort is unknown.
Clinical factors that modify post-HCT outcomes in MRD+ patients
We analyzed the effect of clinical factors after HCT on modifying the outcomes of patients with detectable MRD. Considering both MRD and aGVHD as time-dependent covariates, we noted that both patients who were MRD negative (Figure 3A) or positive (Figure 3B) had an approximately threefold decrease in relapse if they developed aGVHD. Patients who were MRD+ post-HCT who did not develop aGVHD had an exceptionally high relapse rate. However, patients who had MRD noted post-HCT who developed aGVHD had relapse rates that were similar to those who were MRD negative who did not develop aGVHD.
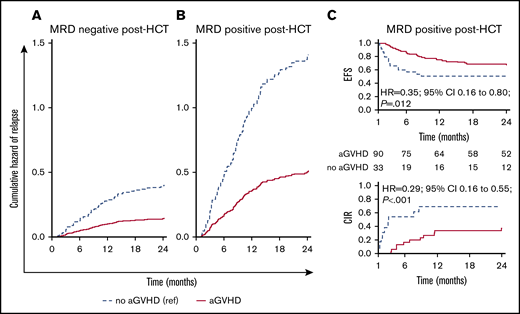
Influence of MRD and aGVHD early after HCT (day +30 time point) on relapse. Cumulative hazard estimates for relapse in children with ALL during the first 2 years after HCT for patients remaining MRD negative post-HCT at the first month after HCT (A) and patients with MRD detected at any level post-HCT (B). The estimates are from a Cox proportional hazards regression model with all MRD (MRD negative, MRD positive) measurements after transplant and aGVHD both as time-dependent covariates. (C) EFS and CIR curves for patients who were MRD positive during the landmark day +30 time point interval and did or did not experience aGVHD.
Influence of MRD and aGVHD early after HCT (day +30 time point) on relapse. Cumulative hazard estimates for relapse in children with ALL during the first 2 years after HCT for patients remaining MRD negative post-HCT at the first month after HCT (A) and patients with MRD detected at any level post-HCT (B). The estimates are from a Cox proportional hazards regression model with all MRD (MRD negative, MRD positive) measurements after transplant and aGVHD both as time-dependent covariates. (C) EFS and CIR curves for patients who were MRD positive during the landmark day +30 time point interval and did or did not experience aGVHD.
In a landmark analysis that combined MRD measurements after HCT and aGVHD, we found that both were clearly associated with EFS and relapse (P < .001). Patients who did not experience aGVHD had a higher relapse incidence and lower EFS than those who developed aGVHD in both groups (MRD negative or positive). For example, as shown in Figure 3C in patients with detectable MRD at day +30, development of aGVHD led to a significant decrease in relapse and an improvement in EFS, an observation we were able to replicate at days +90 and +180 (supplemental Table 7). Relapse was a rare event in patients who were MRD negative who developed aGVHD (<20%, days +30 to +90; <10%, day +180).
We explored whether there was an interaction between aGVHD and MRD for decreasing relapse risk. Supplemental Table 8 shows the independent effects of MRD in increasing relapse and aGVHD in decreasing relapse. In testing for an interaction, there was no significant interaction for grade I to II aGVHD with MRD; with grade III to IV aGVHD, however, there was a trend toward a statistically significant interaction favoring less relapse (HR, 0.34; P = .103).
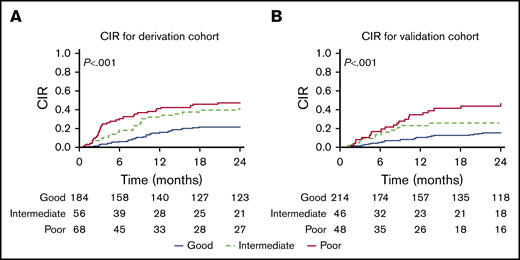
CIR by the integrated score before HCT. Values are given for the derivation cohort (A) and the validation cohort (B).
CIR by the integrated score before HCT. Values are given for the derivation cohort (A) and the validation cohort (B).
Prognostic risk score for relapse
The initial cohort of 616 patients was separated into 2 equal groups taking into consideration the date of transplantation. Our derivation cohort comprised 308 patients who underwent HCT between August 1999 and April 2009; in the validation cohort, the HCTs were performed between May 2009 and May 2015. This nonrandom criterion to obtain the data sets allowed us to check conclusions over time because the cohorts belonged to 2 different eras. Our data set contained within it 2 distinct cohorts, patients treated in Europe and Australia followed up by using qPCR MRD, and patients treated in North America who were monitored by using MFC MRD. There were a number of differences in the cohorts, reflecting differences in HCT approaches according to COG12 and I-BFM standards,35 as well as likely differences in ethnic backgrounds of patients, with much higher percentages of patients from North America undergoing cord blood procedures. We reasoned that these would be appropriate for derivation and validation of a prognostic model that would be reflective of international practice and would be more generalizable and useful.
Patient characteristics and outcomes of derivation and validation cohorts are presented in Table 1 and supplemental Table 1. Table 2 shows the HRs for key independent risk factors noted by using multivariate analysis of the derivation cohort. Remission status was found to be independently associated with relapse risk, with patients in second or subsequent remissions having an increased HR for relapse incidence of 1.60 and 1.70, respectively (P < .001 and P = .073). A second independent predictor of relapse was use of non-TBI preparative regimens, which had an HR of 1.54 (P < .001). MRD was an independent predictor as well, with an HR of 1.99 and 2.45 for those with high and very high MRD (P < .001). We used an integrated risk score (IRS) that gives 5 to patients in CR2 or >CR2, and adds 4 to those receiving non-TBI regimens and 7 to those with high MRDpre-HCT or 9 for very high MRDpre-HCT. We were thus able to separate patients into 3 prognostic categories with good (score, 0-5), intermediate (5 > score ≤ 9), and poor (score >9) outcomes (Table 3; Figure 4). These 3 risk groups were defined on the basis of the IRS, placing cut points at the 25th (IRS = 5) and 75th (IRS = 9) percentiles of the model’s IRS distribution. The good outcome subgroup (IRS ≤5) had CIR at 1 and 2 years of 16% (95% CI, 11-21) and 21% (95% CI, 15-27). The intermediate outcome subgroup (6 < IRS ≤ 9) had CIR at 1 and 2 years of 32% (95% CI, 20-44) and 38% (95% CI, 30-56). The poor outcome group (IRS >9) had CIR at 1 and 2 years of 41% (95% CI, 30-53) and 47% (95% CI, 35-59). The score predicted statistically significant and meaningful differences in both EFS and relapse rates in our derivation cohort (P < .001). Testing the score in the validation cohort resulted in similar separation of low, intermediate, and higher risks of CIR, confirming the model (P = .001).
HRs for relapse analyzed by using an extended Fine and Gray competing risk approach
| Clinical factor | n (%) | Relapse, n (%) | Coefficient | HR (95% CI) | P | Score |
|---|---|---|---|---|---|---|
| Remission status | ||||||
| CR1 | 112 (36) | 27 (24) | Ref | 1 | 0 | |
| CR2 | 170 (55) | 58 (34) | 0.4701 | 1.60 (1.46-1.76) | <.001 | 5 |
| > CR2 | 26 (8) | 10 (38) | 0.5324 | 1.70 (0.95-3.05) | .073 | 5 |
| Conditioning regimen | ||||||
| TBI-based | 251 (81) | 72 (29) | Ref | 1 | 0 | |
| Non–TBI-based | 57 (19) | 23 (40) | 0.4298 | 1.54 (1.26-1.87) | .006 | 4 |
| Prior-HCT MRD | ||||||
| <10−4 | 206 (67) | 50 (24) | Ref | 1 | 0 | |
| High | 49 (16) | 20 (41) | 0.6896 | 1.99 (1.38-2.87) | <.001 | 7 |
| Very high | 53 (17) | 25 (47) | 0.8951 | 2.45 (2.29-2.61) | <.001 | 9 |
CR, complete remission.
IRS and estimates of probabilities
| Variable | IRS | n (%) | Relapse, n (%) | HR (95% CI) | P | 1y-CIR (95%CI) | 2y-CIR (95%CI) | P |
|---|---|---|---|---|---|---|---|---|
| Derivation set | <.001 | |||||||
| Good | 0-5 | 184 (60) | 40 (22) | 1 | 16 (11-21) | 21 (15-27) | ||
| Intermediate | >5 to ≤9 | 56 (18) | 23 (41) | 2.46 (1.47-4.12) | .001 | 32 (20-44) | 38 (30-56) | |
| Poor | >9 | 68 (22) | 32 (47) | 2.89 (1.82-4.61) | <.001 | 41 (30-53) | 47 (35-59) | |
| Validation set | <.001 | |||||||
| Good | 0-5 | 214 (69) | 30 (14) | 1 | 10 (6-14) | 15 (10-20) | ||
| Intermediate | >5 to ≤9 | 46 (15) | 11 (24) | 2.14 (1.10-4.27) | .031 | 23 (11-36) | 26 (13-39) | |
| Poor | >9 | 48 (16) | 21 (44) | 3.81 (2.18-6.67) | <.001 | 35 (21-48) | 47 (32-61) |
We assessed the predictive accuracy of the score at several time points post-HCT (Table 4). In the derivation cohort, the apparent discrimination for the occurrence of relapse by the integrated score within 3, 6, 12, 18, and 24 months was equal to 83%, 78.2%, 72.2, 67.9%, and 67.5%, respectively. In the validation cohort, the apparent discrimination for the occurrence of relapse within 3, 6, 12, 18, and 24 months was equal to 67.9%, 67.1%, 65%, 65.6%, and 62.7%. Calibration of the model was assessed graphically by comparing the predicted probability of relapse within 24 months vs the observed probability of relapse across the quartiles of predicted risk (supplemental Figure 2).
Predictive accuracy of the IRS
| Variable | t = 3 mo | t = 6 mo | t = 12 mo | t = 18 mo | t = 24 mo |
|---|---|---|---|---|---|
| Derivation set, % | |||||
| Apparent c-index | 83 | 78.2 | 72.2 | 67.9 | 67.5 |
| Bootstrap c-index | 82.9 | 78.4 | 72.6 | 68.1 | 68 |
| Validation set, % | |||||
| Apparent c-index | 67.9 | 67.1 | 65 | 65.6 | 62.7 |
| Bootstrap c-index | — | 67.7 | 64.9 | 65.7 | 63 |
t, time.
Discussion
A recent worldwide study led by individuals from the US Food and Drug Administration combined results of pediatric and adult trials using flow cytometry and PCR-based approaches to show that persistence of MRD in non-HCT trials was consistently associated with worsened prognosis, regardless of trial approach and method of MRD detection.36 The study highlighted a need for interventions in MRD+ patients and suggested that MRD response could be used as an early end point to assess novel therapies, a concept that the US Food and Drug Administration had previously resisted. It is notable, however, that the study did not include an assessment of the predictive power of MRD in the peri-HCT period, at which point, because of the graft-versus-leukemia (GVL) effect, the prognostic significance of MRD could be different. This study addresses that gap, measuring GVL through the surrogate of GVHD, showing its ability to dramatically reduce the risk of relapse, especially in the context of MRD.
During the past decade, several studies have described the impact of MRD pre-HCT and post-HCT in pediatric ALL.4-7,9-12,37,38 These studies showed a correlation of MRD positivity with relapse, but patient numbers in each study were small, limiting the investigators’ ability to test for independent risk factors and create prognostic models. To address the challenge of accurately defining risk in the context contemporary approaches to pediatric HCT for ALL, the Westhafen Intercontinental Group gathered primary data from leading treatment consortia in North America, Australia, and Europe. Two different methods were used; the data included highly standardized qPCR measures and flow cytometry performed at accredited laboratories using standardized COG approaches.
In contrast to former studies,6,8-10,38 in which patients with high MRD levels could only be grouped as MRD positive (>10−4), the dramatically increased numbers in this investigation revealed distinct differences in outcomes between 3 levels of MRD and the absence of measurable MRD both pre-HCT and post-HCT. In addition, once the HCT began, defining risk through the course of the HCT was not previously possible, especially given the fact that GVHD and MRD post-HCT can alter risk dramatically. Several of our observations help better define risk. For the first time, we were able to define the importance of a given post-HCT MRD measurement in the context of the pre-HCT value. It is notable that if patients with detectable MRD pre-HCT do not achieve low or nondetectable MRD at their next assessment, their prognosis is very poor (relapse, 90%-100%), and novel interventions to prevent relapse are warranted. We also show that the further one is from HCT, the more likely even low levels of MRD portend a very poor prognosis. This scenario is in-line with a recently published retrospective analysis by Lovisa et al,39 in which the authors reported poor survival in patients who were MRD positive pre-HSCT and did not clear the disease, as well as in patients who become MRD positive posttransplant.
The current study used a multivariable Fine-Gray regression model to assess the impact of risk factors on relapse and was able to determine that independent risk factors for relapse pre-HCT included CR2 or CR3+ remission status, presence of MRD, and non-TBI regimens. Using these factors, we created a risk score that is notable for showing that the presence of MRD at high and very high levels in addition to late remission status (CR2 and CR3+) are the risk factors with the highest HRs, followed by use of non-TBI conditioning and CR2 status. These findings are important, as previous risk models focused only on remission status or MRD alone as determinants of outcome. It is also notable that the integrated score that we created using a historical cohort retained the ability to show meaningful differences in relapse in an independent time era cohort in which the patient population differed in many ways (eg, donor type, use of different stem cell sources). This validation adds more weight to the merit of this score, suggesting that our score could be a valuable tool for individualized counseling pre-HCT and used in research protocols for risk stratification.
This new risk classification score is especially important with the introduction of effective immune and cell-based therapies over the past 5 years. The practice of tapering immune suppression,8,38,40-42 or giving donor lymphocyte infusion or cytokine-induced killer cells,43-45 can be more effectively targeted by using our risk analysis. Use of newer leukemia-specific treatment with targeted monoclonal antibodies,46 bispecific T-cell engager therapy,47 or chimeric antigen receptor–modified T cells48,-50 could be studied either before or after HCT in high-risk patients determined by using this classification.
It is important to emphasize that although our data identify high-risk patients before HCT, at which point interventions can be studied to decrease MRD, a significant percentage of relapses occur in the cohort of patients who enter transplant MRD low positive or MRD negative. Although different methods were used and MFC MRD has a lower sensitivity than MRD PCR, our data indicate that one can identify many of these relapses early by frequent post-HCT MRD monitoring, when positive MRD has the strongest prognostic value. In addition, our data define groups at especially high risk that may benefit from more frequent MRD assessment (eg, MRD+ pre-HCT, CR2, CR3+, non-TBI regimen, no aGVHD by day +90). Early after HCT, MRD high or very high identifies a group at risk of imminent relapse for whom rapid intervention may be beneficial, especially if it is a second measure of MRD positive disease. Later after HCT (180+ days), even the lowest levels of MRD indicate a high risk for relapse and could trigger novel immunological interventions.
As shown in Figure 3 and supplemental Table 7, the occurrence of aGVHD has an important effect on relapse risk and survival of patients with MRD positivity noted after HCT. Landmark analyses at multiple time points show improved outcomes and elimination of MRD in patients developing aGVHD, providing evidence that GVHD/GVL can be beneficial to these patients. This confirms an observation from an earlier COG/PBMTC study showing an improvement in survival in children with ALL who experience grade I to III aGVHD, as well as the findings from Zecca et al from the Associazione Italiana di Ematologica e Oncologia Pediatrica group regarding cGVHD.51,52 The downside of this is that grade IV GVHD is not beneficial (data not shown), and thus investigators should be cautious about interventions that stimulate excessive GVHD.6,40 Our study did not specifically address the type and intensity of GVHD prophylaxis used or approaches to withdrawal of immune suppression. This important topic should be further addressed, ideally in a prospective manner, to define best methods for patients shown to be high risk pre-HCT or post-HCT.
In conclusion, this multinational study revealed the importance of MRD assessment in the peri-HCT period and how it relates to a patient’s risk for relapse and mortality. Pre-HCT and post-HCT MRD measurements paired with independent clinical factors in our validated model accurately define risk and therefore could be part of inclusion criteria for clinical studies aimed at relapse prevention or aid in individualized patient counseling regarding treatment.
Acknowledgments
This study was supported in part by National Institutes of Health (NIH) grants N01 HC-45220/HHSN268200425220C, U10 CA098543, and R01CA1116660 (from the National Cancer Institute) for COG activities. PBMTC activities were supported by NIH grant U10 HL069254 (from both the National Heart, Lung, and Blood Institute and National Cancer Institute) and a Johnny Crisstopher Children’s Charitable Foundation St. Baldrick’s Consortium Grant. P.B. was supported by the LOEWE Center for Cell and Gene Therapy Frankfurt, funded by the Hessian Ministry of Higher Education, Research and the Arts (funding reference number III L 4-518/17.004 [2013]). MRD testing for Australian patients was supported by NHMRC APP1057746.
Authorship
Contribution: M.A.P. and P.B. were responsible for study conception and design; all authors except K.R.S. and E.S.-M. were responsible for provision of study material or patients; all authors except K.R.S. were responsible for collection and assembly of data; P.B., E.S.-M., and M.A.P. were responsible for data analysis and interpretation, and writing the manuscript; and all authors approved the final manuscript as submitted.
Conflict-of-interest disclosure: P.B. reports institutional research grants from Riemser, Medac, Neovii; speakers bureau for Novartis and Amgen; and advisory boards for Amgen, Novartis, and Medac. A.B. reports consultation fees from Autolus, ElsaLys, and EusaPharma; travel reimbursement from Neovii; and company trial sponsorship from Novartis. M.R.V. reports advisory boards for Fate Therapeutics and B-MoGen, as well as stock options from both companies. M.J.B. reports research support from Becton Dickinson Biosciences, Amgen, and Bristol-Myers Squibb. C.P. reports research grants from Jazz, Riemser, Medac, and Neovii; speakers bureau for Riemser and Amgen; and advisory boards for Amgen and Novartis. S.A.G. reports research and/or clinical trial support from Novartis, Servier, and Kite; and consulting, study steering committees, or scientific advisory boards for Novartis, Adaptimmune, Eureka, TCR2, Juno, GlaxoSmithKline, Cellectis, Janssen, and Roche. M.A.P. reports institutional research grants from Adaptive and Miltenyi; speakers bureau for Novartis; advisory boards for Novartis; and educational activities for Novartis, Amgen, and Bellicum. The remaining authors declare no competing financial interests.
A list of the members of the Children’s Oncology Group, the Pediatric Blood & Marrow Transplant Consortium, the Australian Transplantation Group, the International Berlin-Frankfurt-Münster Study Group, the Pediatric Diseases Working Party of the European Society for Blood and Marrow Transplantation, and the Westhafen Intercontinental Group appears in “Appendix.”
Correspondence: Peter Bader, Division for Stem Cell Transplantation and Immunology, Department for Children and Adolescents, University Hospital Frankfurt, Goethe University, Theodor-Stern-Kai 7, D-60590 Frankfurt am Main, Germany; e-mail: peter.bader@kgu.de; or Michael A. Pulsipher, USC Keck School of Medicine, Division of Hematology, Oncology and Blood and Marrow Transplantation, Children's Hospital Los Angeles, 4650 Sunset Blvd, Mailstop #54, Los Angeles, CA 90027; e-mail: mpulsipher@chla.usc.edu.
Appendix: study group members
The members of the Children’s Oncology Group are: A.E.W., M.B., M.R.V., M.J.B., N.N.S., N.G., A.R.C., S.A.G., and M.A.P. The members of the Pediatric Blood & Marrow Transplant Consortium are: K.R.S., S.A.G., and M.A.P. The members of the Australian Transplantation Group are: P.J.S. and R.S. The members of the International Berlin-Frankfurt-Münster Study Group are: P.B., A.B., J.-H.D., C.E., A.L., and C.P. The members of the Pediatric Diseases Working Party of the European Society for Blood and Marrow Transplantation are: P.B., A.B., J.-H.D., A.L., C.P., T.E.K., and A.M.W. The members of the Westhafen Intercontinental Group are: P.B., A.B., J.-H.D., A.E.W., M.B., M.R.V., M.J.B., N.N.S., N.G., A.R.C., K.R.S., A.L., C.P., T.E.K., S.A.G., and M.A.P.

