

Key Points
The cost of TKI for treatment of CML can be substantially saved by treatment discontinuation in patients who achieved DMR.
Starting treatment with imatinib is the most cost-effective strategy even after incorporation of treatment discontinuation.

Abstract
The cost of tyrosine kinase inhibitors (TKIs) in the treatment of chronic myeloid leukemia (CML) is a substantial economic burden. In Japan, imatinib, dasatinib, and nilotinib are now approved as first-line treatment of CML in chronic phase. Recent “stop TKI” trials have shown that TKIs can be safely discontinued in nearly one-half of patients with sustained deep molecular response (DMR). In this study, we analyzed the cost-effectiveness of a simulated 10 years of CML treatment including stop TKI in both the United States and Japan. We constructed Markov models to compare 4 strategies in which treatment was initiated with imatinib, dasatinib, nilotinib, or any of these TKIs at the physician’s discretion. Treatment was switched to another TKI in the case of intolerance or resistance to the initial TKI, and TKIs were discontinued if DMR persisted for 2 years. “Imatinib first” offered 7.34 quality-adjusted life years (QALYs) at the cost of $1 022 148 in the United States (US dollars) and ¥32 526 785 in Japan (Japanese yen). In comparison with imatinib first, the incremental cost-effectiveness ratio per QALY of “dasatinib first” (7.68 QALY, $1 236 052, ¥51 506 254), “nilotinib first” (7.64 QALY, $1 245 667, ¥39 635 598), and “physician’s choice” (7.55 QALY, $1 167 818, ¥41 187 740) was $641 324, $696 717, and $666 634 in the United States and ¥54 456 325, ¥23 154 465, and ¥39 635 615 in Japan, respectively. None of the 3 strategies met the willingness-to-pay threshold. The results were robust to univariate and multivariate sensitivity analyses. Imatinib first was shown to be the most cost-effective approach even with the incorporation of stop TKI.
Introduction
Imatinib, a BCR-ABL1 tyrosine kinase inhibitor (TKI), has changed chronic myeloid leukemia (CML) in chronic phase (CML-CP) from a fatal hematological malignancy to a disease that can be managed on an outpatient basis. The International Randomized Study of Interferon vs Imatinib (IRIS trial) showed that 10-year overall survival in CML-CP patients treated by imatinib was 83.3%.1,2 Following the arrival of imatinib, more potent “second-generation” TKIs such as dasatinib and nilotinib were developed and these have been shown to be both effective and tolerable in patients who were resistant or intolerant to imatinib.3,4 They have also been introduced as first-line treatment of newly diagnosed CML-CP patients and have been shown to give similar overall survival but a faster molecular response compared with imatinib.5,6 The additional development of bosutinib and ponatinib, which have been approved in the case of intolerance or failure of prior TKI therapy, has made the treatment strategy for CML-CP more complex. The European LeukemiaNet recommendation, a comprehensive guide for physicians regarding the diagnosis and treatment of CML, suggests that treatment of CML-CP can be started with any of the TKIs that are currently approved for first-line treatment, and should be switched as necessary according to the tolerability or the response, defined according to the reduction in the International Scale (IS) as the ratio of BCR-ABL1 transcripts to ABL1 transcripts (BCR-ABL IS).7
Because most patients require lifelong treatment with TKI, its cost is a substantial economic burden on patients and payers for health services. Second- and third-generation TKIs cost much more than imatinib, and this difference has increased since the patent for imatinib expired and generic compounds have become widely available. The cost-effectiveness of CML treatment has been of particular interest for physicians and researchers in many countries.8-11
As a solution to this problem, Padula et al compared the cost-effectiveness of an “imatinib-first” approach, in which physicians start treatment with imatinib, switching to dasatinib or nilotinib only in cases of resistance or intolerance, to that of a “physician’s choice” approach, in which they initiate treatment with any 1 of 3 TKIs.8 Their Markov model analysis clearly showed that the imatinib-first approach was associated with lower cost but similar quality-adjusted life years (QALYs) compared with the physician’s choice approach.
Another important issue for CML is whether TKIs can be stopped. Following the pioneering Stop Imatinib (STIM) study, in which imatinib was successfully stopped in 38% of patients with a deep molecular response (DMR),12,13 several “stop TKI” studies have found that nearly one-half of patients who tried treatment cessation could achieve sustained treatment-free remission (TFR).14-19 The definition of DMR that would allow treatment cessation in most of those studies was molecular response 4.5 (MR4.5; BCR-ABL IS ⩽0.0032%) or MR4.0 (BCR-ABL IS ⩽0.01%) sustained for 2 years. Because second-generation TKIs have been shown to induce earlier DMR compared with imatinib, they may increase opportunities for treatment cessation. The shorter duration of initial treatment and the higher incidence of TFR with second-generation TKIs may change the conclusion regarding cost-effectiveness by allowing the incorporation of a “stop TKI” strategy.
Recently, Shih et al conducted a decision analysis to compare the cost-effectiveness of generic imatinib and second-generation TKIs including treatment discontinuation.20 Assuming that 13% and 22% of the patients achieved TFR with imatinib and second-generation TKI, respectively, they concluded that second-generation TKIs were not cost-effective under current standards of willingness-to-pay (WTP) threshold in the United States, Europe, and developing countries. However, because they did not use Markov modeling, simulations of survival or changes in health status due to CML were not included. In addition, switching to second-generation TKIs in patients with suboptimal response, which is a standard approach after first-line treatment with imatinib, was not allowed in their model. Therefore, their results need to be verified with a more sophisticated model.
In the present study, we performed a cost-effectiveness analysis in both the United States and Japan using the Markov model, in which we simulated 10 years of CML treatment, initially starting with imatinib, dasatinib, nilotinib, or any TKI according to the physician’s choice, and attempting stop TKI on the achievement of DMR for 2 years.
Methods
Construction of the Markov model
We reconstructed a model based on the Markov diagram kindly provided by Padula et al8 with the following modifications: (1) extension of the observation period from 5 years to 10 years; (2) modification of the transition probability of the Markov model to more closely approximate the survival in clinical trials; (3) inclusion of “dasatinib-first” and “nilotinib-first” strategies in addition to imatinib first and physician’s choice; and (4) incorporation of stop TKI on achievement of DMR for 2 years.
The structure of our Markov diagram that is common to all 4 strategies is shown in Figure 1. In the imatinib-first, dasatinib-first, and nilotinib-first approaches, treatment is started with 1 of the 3 TKIs, switched to either of the other TKIs in case of treatment failure, and stopped at 2 years after the achievement of DMR, defined as MR4.5 (MR4.5 model). Because some stop TKI trials required only MR4.0,19 we constructed an alternative model using MR4.0 as a definition of DMR (MR4.0 model). In the physician’s choice approach, treatment was assumed to be chosen from among these 3 strategies in equal proportions. The duration of each Markov cycle was 1 year.
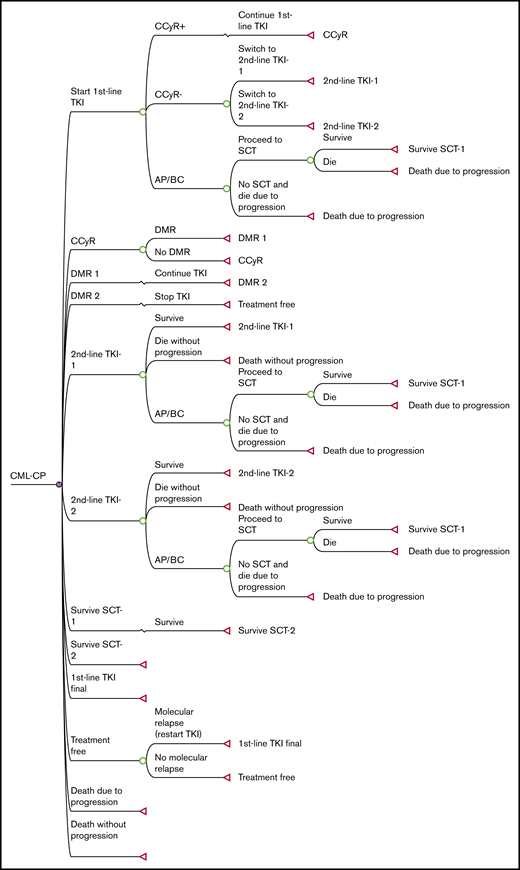
Simplified decision tree common to all 4 strategies. AP, accelerated phase; BC, blastic crisis; CCyR, complete cytogenetic response; SCT, stem cell transplantation.
Simplified decision tree common to all 4 strategies. AP, accelerated phase; BC, blastic crisis; CCyR, complete cytogenetic response; SCT, stem cell transplantation.
As in the original model, treatment failure leading to a TKI switch was defined as less than complete cytogenetic response (CCyR) at 12 months or intolerance of TKI. After the failure of imatinib, the TKI was switched to either of the second-generation TKIs in equal proportions. After the failure of dasatinib or nilotinib, it was assumed that 15% of patients were switched to imatinib due to intolerance, and 85% of patients were switched to the other second-generation TKIs due to resistance.
Regarding progression to accelerated phase/blastic crisis (AP/BC) and overall survival, we defined transition probability differently than in the original model. First, we converted the 5-year progression rate extracted from clinical trials to an annual probability,1,5,6 and applied it to the first 12 months. Progression after 12 months was assumed to occur exclusively in patients who had undergone a TKI switch. After the switch, patients either survived on second-line TKI, progressed to AP/BC, or died without progression. The annual transition probabilities among these Markov states were calculated based on data from clinical trials regarding survival and causes of death. In the published clinical trials, overall survival on second-line dasatinib3,21,22 or nilotinib,4,23 and first-line imatinib,2 has been reported to be 65% at 7 years, 78% at 4 years, and 83% at 10 years, with 48.5%, 43.2%, and 56.2% of deaths attributable to CML progression, respectively. The probability that patients would proceed to allogeneic stem cell transplantation (SCT) after progression to AP/BC was calculated based on the results of the IRIS study,2 in which 37 patients died of CML without SCT, and 13 died after SCT. If we assume that all CML deaths occur after progression to AP/BC and survival after SCT is 50%, the percentage of AP/BC patients who undergo SCT is estimated to be 41%.
In the simulation of stop TKI, DMR was assumed to occur exclusively in patients who had achieved CCyR at 12 months. Patients with CCyR proceeded to DMR with annual transition probabilities defined according to the results of clinical trials.5,6 Because the cumulative incidence of MR4.0 on dasatinib was not available in the Dasatinib versus Imatinib Study in Treatment-Naive CML patients (DASISION) trial, we assumed the transition probabilities to MR4.0 based on the incidence of major molecular response (MMR) and MR4.5. TKI was discontinued after DMR persisted for 2 years. Molecular relapse was defined as a loss of MMR (BCR-ABL IS ⩽0.1%), which was assumed to occur exclusively in the first year. When a relapse occurred, TKI was restarted, and MMR was regained in all patients. These assumptions were made based on the results of published stop TKI trials. Among the patients who experienced molecular relapse, 95% and 80.5% of the relapse occurred within 12 months in the STIM study and the Stop Second-Generation TKI (STOP-2G-TKI) study, respectively, and 80% of the relapse occurred within 6 months in the European Stop TKI (EURO-SKI) study.13,17,19 The probabilities of successful stop TKI were defined as 38% for imatinib and 54% for dasatinib and nilotinib, according to the STIM study13 and the STOP-2G-TKI study,17 respectively.
All transition probabilities defined in the model are shown in Table 1, along with their plausible ranges and distributions for a sensitivity analysis. The 10-year simulation of overall survival and the cumulative incidence of CML-related events was performed using these Markov diagrams and parameters. All calculations were performed using TreeAge Pro 2018 software (TreeAge Software Inc, Williamstown, MA).
The probabilities used for the analysis of cost-effectiveness with plausible ranges and distributions for a sensitivity analysis
| Items | Values or formulae | Ref. | |
|---|---|---|---|
| Baseline | Plausible range | ||
| At 12 mo* | |||
| Imatinib | |||
| CCyR | 0.7 | 0.60-0.81 | 8 |
| AP/BC | 0.015 | 0.013-0.017 | 1, 2 |
| Not CCyR or intolerant | Remainder | ||
| Dasatinib | |||
| CCyR | 0.85 | 0.72-0.98 | 8 |
| AP/BC | 0.01 | 0.009-0.012 | 5 |
| Not CCyR or intolerant | Remainder | ||
| Nilotinib | |||
| CCyR | 0.8 | 0.68-0.92 | 8 |
| AP/BC | 0.008 | 0.007-0.009 | 6 |
| Not CCyR or intolerant | Remainder | ||
| At TKI switch* | |||
| Annual transition probability after switch to imatinib | |||
| Survive | 0.977 | 0.83-1 | 1, 2 |
| AP/BC | 0.014 | ||
| Die without progression | Remainder | ||
| Annual transition probability after switch to dasatinib | |||
| Survive | 0.931 | 0.79-1 | 3, 21, 22 |
| AP/BC | 0.037 | ||
| Die without progression | Remainder | ||
| Annual transition probability after switch to nilotinib | |||
| Survive | 0.933 | 0.79-1 | 4, 23 |
| AP/BC | 0.032 | ||
| Die without progression | Remainder | ||
| At AP/BC | |||
| Proceed to SCT after AP/BC | 0.41 | 0-1 | 1, 2 |
| Survive after SCT | 0.5 | 0.425-0.575 | 8 |
| At CCyR | |||
| Annual transition probability from CCyR to MR4.5 | |||
| Imatinib | 0.147 | 0.125-0.181 | 1, 2, 6 |
| Dasatinib | 0.157 | 0.11-0.171 | 5 |
| Nilotinib | 0.231 | 0.192-0.284 | 6 |
| Annual transition probability from CCyR to MR4.0 | |||
| Imatinib | 0.205 | 0.165-0.248 | 1, 2, 6 |
| Dasatinib | 0.255 | 0.212-0.293 | 5 |
| Nilotinib | 0.352 | 0.290-0.422 | 6 |
| At MR4.5 | |||
| Probability of successful stop TKI | |||
| Imatinib | 0.38 | 0.33-0.5 | 12-15, 19 |
| Dasatinib | 0.54 | 0.46-0.62 | 16-19 |
| Nilotinib | 0.54 | 0.46-0.62 | 16-19 |
β distributions were applied for probabilistic sensitivity analysis.
MR4.5, molecular response 4.5 (BCR-ABL IS ⩽0.0032%); MR4.0, molecular response 4.0 (BCR-ABL IS ⩽0.01%); Ref., reference number.
For nodes with multiple subtrees, Dirichret distributions were applied for probabilistic sensitivity analysis.
Costs and effectiveness
The costs used for the analysis are shown in Table 2. The analysis was performed from the payer’s perspective and only included direct medical costs. The baseline costs of TKIs were determined based on the current prices of branded TKIs, and the prices of currently available generic compounds of imatinib were included in the sensitivity analysis. Patients were assumed to receive standard doses of imatinib (400 mg once daily), dasatinib (100 mg once daily), and nilotinib (300 mg twice daily for the initial treatment and 400 mg twice daily for the second-line treatment). The prices of TKIs were extracted from the 2019 wholesale acquisition cost in RED BOOK for the US and Japanese national health insurance drug price standard listed in 2019 for Japanese analysis. Because generic imatinib is widely available, we also performed the analysis using our Markov model with the costs calculated by other investigators,8,20 in which the estimated cost of imatinib was much lower, assuming widespread use of generic compounds (supplemental Table 1). The costs for office visits20 and allogeneic transplantation24 in the United States were extracted from published studies. For Japanese analysis, we defined costs for office visits according to standard practice in Japan. Briefly, patients were assumed to undergo detailed examination at diagnosis including blood tests, bone marrow examination, chest radiograph, electrocardiogram, and abdominal echogram. After TKIs were started, physician visits were assumed to be done weekly for the first month, monthly for 3 months, and once every 3 months thereafter. BCR-ABL IS was measured once every 3 months. When TKIs were discontinued, BCR-ABL IS was measured more frequently, monthly for a year and once every 3 months thereafter. The Japanese cost for allogeneic SCT was defined based on data published in a national database.25
The costs used for the analysis of cost-effectiveness with plausible ranges and distributions for a sensitivity analysis
| Item | Value | Range |
|---|---|---|
| US analysis | ||
| Treatment costs in USD | ||
| Office visit | 109 | |
| Drug payments, per daily dose | ||
| Imatinib, branded, 400 mg | 337 | |
| Imatinib, generic, 400 mg | 12 to 201 | |
| Dasatinib, 100 mg | 456 | |
| Nilotinib, 600 mg | 491 | |
| Nilotinib, 800 mg | 491 | |
| Annual costs used in the model health states in USD | ||
| Chronic phase, first year | ||
| Imatinib | 124 141 | 5 469 to 142 762 |
| Dasatinib | 167 508 | 124 141 to 192 634 |
| Nilotinib | 180 268 | 124 141 to 207 308 |
| Chronic phase, subsequent years | ||
| Imatinib | 123 594 | 4 922 to 142 133 |
| Dasatinib | 166 960 | 123 594 to 192 004 |
| Nilotinib | 179 721 | 123 594 to 206 679 |
| Allogeneic transplantation | 544 178 | 489 944 to 604 353 |
| Treatment-free remission | ||
| First year | 1 313 | 1 116 to 1 510 |
| Subsequent years | 438 | 372 to 503 |
| After allogeneic transplantation | ||
| First year | 2 298 | 1 953 to 2 643 |
| Subsequent years | 1 313 | 1 116 to 1 510 |
| Japanese analysis | ||
| Treatment costs in Japan in JPY (USD)* | ||
| Detailed examination at diagnosis | 120 230 (1 098) | |
| Routine clinical visit | 2 970 (27) | |
| BCR-ABL IS | 25 200 (230) | |
| Drug payments, per daily dose | ||
| Imatinib, branded, 400 mg | 9 214 (84) | |
| Imatinib, generic, 400 mg | 2 125 to 8 016 (19-73) | |
| Dasatinib, 100 mg | 18 955 (173) | |
| Nilotinib, 600 mg | 14 468 (132) | |
| Nilotinib, 800 mg | 18 955 (173) | |
| Annual costs used in the model health states in JPY (USD) | ||
| Chronic phase, first year | ||
| Imatinib | 3 614 950 (33 013) | 1 027 392 to 4 157 192 |
| Dasatinib | 7 170 415 (65 483) | 3 614 950 to 8 245 977 |
| Nilotinib | 5 532 660 (50 527) | 3 614 950 to 8 245 977 |
| Chronic phase, subsequent years | ||
| Imatinib | 3 475 790 (31 742) | 888 232 to 3 997 159 |
| Dasatinib | 7 031 255 (64 212) | 3 475 790 to 8 085 943 |
| Nilotinib | 5 393 500 (49 255) | 3 475 790 to 8 085 943 |
| Nilotinib, second line | 7 031 255 (64 212) | 3 475 790 to 8 085 943 |
| Treatment-free remission | ||
| First year | 338 040 (3 087) | 287 334 to 388 746 |
| Subsequent years | 112 680 (1 029) | 95 778 to 129 582 |
| Allogeneic transplantation | 8 337 907 (76 145) | 7 087 221 to 9 588 594 |
| After allogeneic transplantation | ||
| First year | 136 440 (1 246) | 115 974 to 156 906 |
| Subsequent years | 112 680 (1 029) | 95 778 to 129 582 |
γ distributions were used in the probabilistic sensitivity analysis. Exchange rate, 1 USD = 109.5 JPY.
JPY, Japanese yen; USD, US dollar.
Japanese national health insurance price listed in 2018.
The effectiveness was defined in terms of QALYs. The values were extracted from the original model, except that we defined 1 year of TFR after stop TKI as 1 QALY (Table 3).
The utilities used for analysis of cost-effectiveness with plausible ranges for a sensitivity analysis
| Health states | QALY | |
|---|---|---|
| Baseline | Range | |
| MMR, MR4.5, MR4.0 | 0.9 | 0.765-0.99 |
| CCyR | 0.89 | 0.78-0.94 |
| Untreated or CP not responding to treatment | 0.75 | 0.57-0.85 |
| Intolerance to TKI | 0.58 | 0.38-0.76 |
| AP/BC | 0.22 | 0.07-0.34 |
| Allogeneic SCT, within 1 y | 0.6 | 0.51-0.69 |
| Allogeneic SCT, after 1 y | 0.85 | 0.723-0.978 |
| Death | 0 | 0 |
| TFR | 1 | 0.85-1 |
QALYs other than TFR were extracted from the original model.8 β distributions were used for utilities in probabilistic sensitivity analysis.
In the cost-effectiveness analysis, we used a WTP threshold of $100 000 per QALY for the US analysis and ¥7 500 000 ($68 943) per QALY for Japanese analysis.26 All costs and utilities were discounted by 3% annually.
Sensitivity analysis
The value range for the sensitivity analysis is shown in Tables 1-3. For parameters extracted from the original model, we used the same plausible ranges. We defined the range for probabilities of stop TKI to include the following studies: STIM (38%),13 the Australasian Leukaemia and Lymphoma Group (ALLG) CML8 trial (TWISTER) (47%),14 the Imatinib Suspension and Validation trial (ISAV) (48%),15 and EURO-SKI (50%)19 for imatinib and STOP-2G-TKI (54%),17 the imatinib-intolerant subgroup of the Dasatinib Discontinuation trial (DADI) (56%),27 the Nilotinib Treatment-free Remission Study in CML Patients (ENESTfreedom) (51%),28 and EURO-SKI for second-generation TKIs. The probabilities that AP/BC patients undergo SCT ranged from 0% to 100%. For costs of imatinib, we varied the cost from the lowest price of currently available generic compounds to +15% of the cost of branded imatinib. For dasatinib, we varied the cost from the base-case cost of imatinib to +15% of the base-case cost of dasatinib. For nilotinib, both in first-line and second-line settings, we varied the cost from the base-case cost of imatinib to +15% of the cost of nilotinib 800 mg. Other ranges were defined according to the 95% confidence intervals of the data from clinical trials or ±15% of the base value if the range was not available.
For the construction of the model, we varied the duration of DMR required for discontinuation of TKI to 1 year and to 3 years. We also performed the analysis in which the simulation period was extended to 20 years.
For a probabilistic sensitivity analysis (PSA), we used β distributions for probabilities and QALYs, and γ distributions for costs. For the transition probabilities at CML-CP and second-line TKI, the nodes at which the patients proceed to 1 of 3 Markov states, we attributed Dirichlet distributions. A multivariable PSA was performed using 10 000 Monte Carlo simulations comparing imatinib first to the other 3 strategies.
Results
Survival curve and incidence of TFR according to the current model in comparison with published data
Figure 2A-C show the cumulative incidence of DMR with imatinib, dasatinib, and nilotinib, respectively, calculated based on the probability of achieving CCyR at 12 months and the annual transition probability from CCyR to DMR defined in our model. Figure 2D-F show survival after switching to imatinib, dasatinib, and nilotinib, respectively, calculated based on the defined transition probability at the node of TKI switch. Because these survival curves correlate well with those in clinical trials, the entire simulation was performed based on these calculations.
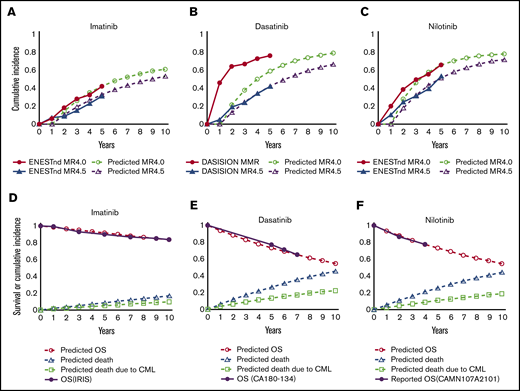
Simulated incidence of DMR and survival after TKI switch according to the model assumption. Simulated cumulative incidence of MR4.5 and MR4.0 in the present model in imatinib first (A), dasatinib first (B), and nilotinib first (C), in comparison with the results of the DASISION trial and ENENTnd trial. Simulated overall survival (OS) under second-line treatment with imatinib after intolerance to dasatinib or nilotinib (D), dasatinib after resistance or intolerance to imatinib or nilotinib (E), or nilotinib after resistance or intolerance to imatinib or dasatinib (F), in comparison with the results of the IRIS trial, the CA180-134 trial, and the CAMN107A2101 trial.
Simulated incidence of DMR and survival after TKI switch according to the model assumption. Simulated cumulative incidence of MR4.5 and MR4.0 in the present model in imatinib first (A), dasatinib first (B), and nilotinib first (C), in comparison with the results of the DASISION trial and ENENTnd trial. Simulated overall survival (OS) under second-line treatment with imatinib after intolerance to dasatinib or nilotinib (D), dasatinib after resistance or intolerance to imatinib or nilotinib (E), or nilotinib after resistance or intolerance to imatinib or dasatinib (F), in comparison with the results of the IRIS trial, the CA180-134 trial, and the CAMN107A2101 trial.
The simulated overall survival for the imatinib-first, dasatinib-first, nilotinib-first, and physician’s choice strategies at 10 years was 86.8%, 93.9%, 92.0%, and 90.9%, respectively (Figure 3A). The survival curve for the imatinib-first strategy overlapped that in the IRIS trial, and its agreement with the imatinib arm in the Evaluating Nilotinib Efficacy and Safety in Clinical Trials–Newly Diagnosed Patients (ENESTnd) trial shows that this simulation correlates well with clinical data with a long observation period (Figure 3B).
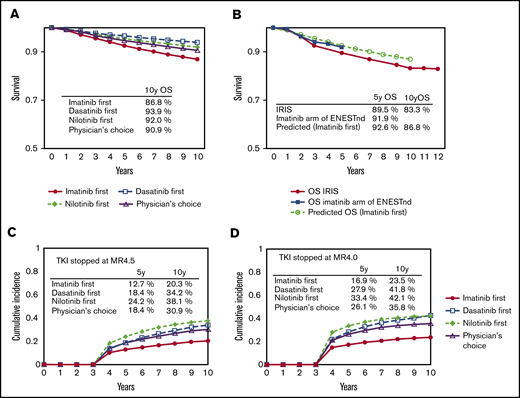
The survival and the incidence of treatment cessation according to the model. Overall survival at 10 years in the 4 strategies simulated by the current model (A) and the survival for the imatinib-first strategy simulated by the current model in comparison with the results of the IRIS trial and the imatinib arm of the ENESTnd trial (B). Cumulative incidence of treatment cessation in the 4 strategies simulated by the MR4.5 model (C) and the MR4.0 model (D).
The survival and the incidence of treatment cessation according to the model. Overall survival at 10 years in the 4 strategies simulated by the current model (A) and the survival for the imatinib-first strategy simulated by the current model in comparison with the results of the IRIS trial and the imatinib arm of the ENESTnd trial (B). Cumulative incidence of treatment cessation in the 4 strategies simulated by the MR4.5 model (C) and the MR4.0 model (D).
The simulated cumulative incidence of stop TKI at 10 years with the imatinib-first, dasatinib-first, nilotinib-first, and physician’s choice strategies was 20.3%, 34.2%, 38.1%, and 30.9% for the MR4.5 model (Figure 3C), and 23.5%, 41.8%, 42.1%, and 35.8% for the MR4.0 model (Figure 3D), respectively.
Cost-effectiveness analyses
Base-case analysis
The cost-effectiveness of the 4 strategies with and without stop TKI is shown in Table 4. Stop TKI is associated with slightly improved QALY with decreased cost for all 4 strategies. The cost-effectiveness analysis based on the incremental cost-effectiveness ratio (ICER) showed that imatinib first is the most cost-effective approach. None of the other 3 strategies met a WTP threshold based on ICER ($100 000 in the United States [US dollars] and ¥7 500 000 in Japan [Japanese yen] per QALY), in comparison with imatinib first. The results were similar in the MR4.5 and MR4.0 models, although the latter showed slightly improved QALY and greater cost saved by stop TKI. We also performed the analyses based on the estimated costs extracted from other published studies that assumed the use of generic imatinib. As expected, the imatinib first was by far the most cost-effective approach compared with other 3 strategies with greater values of ICER compared with the analysis based on our cost estimation (supplemental Table 2).
Base-case results of the analysis of cost-effectiveness for the 4 treatment strategies
| Strategy | Cost | QALY | ICER | Cost saved by stop TKI |
|---|---|---|---|---|
| US analysis in USD | ||||
| Without stop TKI | ||||
| Imatinib first | 1 114 358 | 7.26 | ||
| Physician’s choice | 1 347 721 | 7.44 | 1 281 231 | |
| Nilotinib first | 1 500 262 | 7.50 | 1 315 100 | |
| Dasatinib first | 1 429 013 | 7.57 | 1 256 379 | |
| With stop TKI at MR4.5 for 2 y | ||||
| Imatinib first | 1 022 148 | 7.34 | 92 210 | |
| Physician’s choice | 1 167 818 | 7.55 | 666 634 | 179 903 |
| Nilotinib first | 1 245 667 | 7.64 | 696 717 | 192 961 |
| Dasatinib first | 1 236 052 | 7.68 | 641 324 | 254 595 |
| With stop TKI at MR4.0 for 2 y | ||||
| Imatinib first | 998 197 | 7.36 | 116 161 | |
| Physician’s choice | 1 112 415 | 7.60 | 485 386 | 235 306 |
| Nilotinib first | 1 177 994 | 7.69 | 548 509 | 251 020 |
| Dasatinib first | 1 161 600 | 7.74 | 432 113 | 338 662 |
| Japanese analysis in JPY | ||||
| Without stop TKI | ||||
| Imatinib first | 35 079 009 | 7.26 | ||
| Physician’s choice | 47 110 318 | 7.44 | 66 055 404 | |
| Nilotinib first | 46 934 624 | 7.50 | 49 550 510 | |
| Dasatinib first | 59 436 959 | 7.57 | 79 301 617 | |
| With stop TKI at MR4.5 for 2 y | ||||
| Imatinib first | 32 526 785 | 7.34 | 2 552 224 | |
| Physician’s choice | 41 187 740 | 7.55 | 39 635 615 | 5 922 578 |
| Nilotinib first | 39 635 598 | 7.64 | 23 154 465 | 7 299 026 |
| Dasatinib first | 51 506 254 | 7.68 | 54 456 325 | 7 930 706 |
| With stop TKI at MR4.0 for 2 y | ||||
| Imatinib first | 31 888 894 | 7.36 | 3 190 115 | |
| Physician’s choice | 39 293 527 | 7.60 | 31 467 039 | 7 816 791 |
| Nilotinib first | 37 691 159 | 7.69 | 17 701 079 | 9 243 465 |
| Dasatinib first | 48 439 329 | 7.74 | 43 766 827 | 10 997 630 |
ICER, incremental cost-effectiveness ratio (in comparison with imatinib first); NA, not applicable.
Sensitivity analysis
The deterministic sensitivity analysis of the model including stop TKI was performed based on the plausible ranges shown in Tables 1-3. Both in US and in Japanese analysis using MR4.5 and MR4.0 models, the univariate analysis showed that the cost-effectiveness of imatinib first was robust to changes in all parameters except for the costs of dasatinib and nilotinib. The result of the 2-way sensitivity analysis varying the costs of dasatinib and nilotinib is shown in Figure 4. When the cost-effectiveness of the 4 strategies was compared based on the net monetary benefit, the imatinib first was the most cost-effective strategy in most areas. The physician’s choice was less cost-effective than other strategies, regardless of the change in the costs. In the 1-way sensitivity analysis, the annual cost of dasatinib for the dasatinib-first strategy to be as cost-effective as the imatinib-first strategy was $134 533 in the United States and ¥3 994 758 in Japan, and the annual cost of nilotinib for the nilotinib-first strategy to be as cost-effective as the imatinib-first strategy was $146 061 in the United States and ¥4 452 722 in Japan.
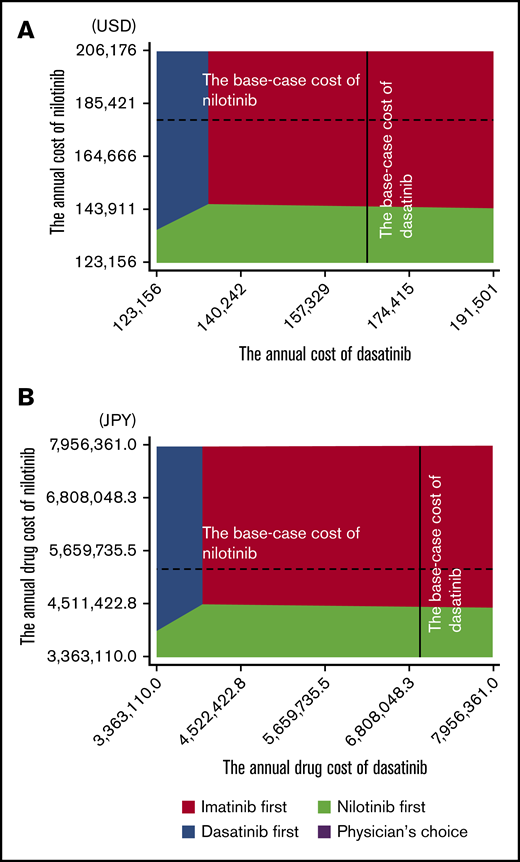
Two-way sensitivity analysis varying the cost of nilotinib and dasatinib. United States (A) and Japan (B). The colored area indicates the range in which the strategy dominates others. Broken lines indicate the base-case cost of nilotinib; solid lines indicate the base-case cost of dasatinib.
Two-way sensitivity analysis varying the cost of nilotinib and dasatinib. United States (A) and Japan (B). The colored area indicates the range in which the strategy dominates others. Broken lines indicate the base-case cost of nilotinib; solid lines indicate the base-case cost of dasatinib.
We also varied the duration of DMR required for stop TKI to 1 year and to 3 years. As in the case with the base-case analysis, all models showed that imatinib first was the most cost-effective strategy. The models were sensitive only to changes in the costs for dasatinib and nilotinib. When the observation period was extended to 20 years, none of the base-case results met the WTP threshold except for the Japanese model allowing stop TKI after 1 year of MR4.0, the setting in which the largest number of the patients achieved TFR. The analysis showed TFR at 20 years of 26.3%, 45.7%, 43.2%, and 38.4% for imatinib-first, dasatinib-first, nilotinib-first, and physician’s choice strategies, respectively, and the nilotinib-first strategy offered ¥52 977 820 (accounted for $483 816 in US dollars) for 13.27 QALY, compared with ¥46 885 433 ($428 177) for 12.42 QALY in imatinib first, with ICER of ¥7 175 288 ($65 523) per QALY, meeting the Japanese WTP threshold of ¥7 500 000. Although the US analysis in the same setting did not meet the WTP threshold of $100 000 at baseline, the result was sensitive for the probability of achieving CCyR at 12 months and successful stop TKI (supplemental Figure 1). However, when we analyzed the model using the reduced cost of imatinib due to generic compounds (supplemental Table 1), the superiority of imatinib first was robust to changes in all parameters.
In the PSA of the US model using a Monte Carlo simulation with 10 000 trials, >99% of iterations showed improved net monetary benefit of imatinib first compared with the other 3 strategies (Figure 5). In the PSA of the Japanese model, the analysis comparing imatinib first to nilotinib first, 90.91% of simulations determined that imatinib first had improved net monetary benefit, was less costly at a slightly lower effectiveness compared with nilotinib first, and had an ICER below the line of a WTP threshold of ¥7 500 000 per QALY. In an additional 2.28% of simulation, imatinib first dominated nilotinib first, with lower cost and higher effectiveness. In the remaining 6.81%, nilotinib first showed improved net monetary benefit, with higher effectiveness with a slightly higher cost, with the ICER above the line of the WTP threshold. In the Japanese analysis comparing imatinib first to dasatinib first and physician’s choice, >99% of iterations showed the improved net monetary benefit of imatinib first (Figure 6).
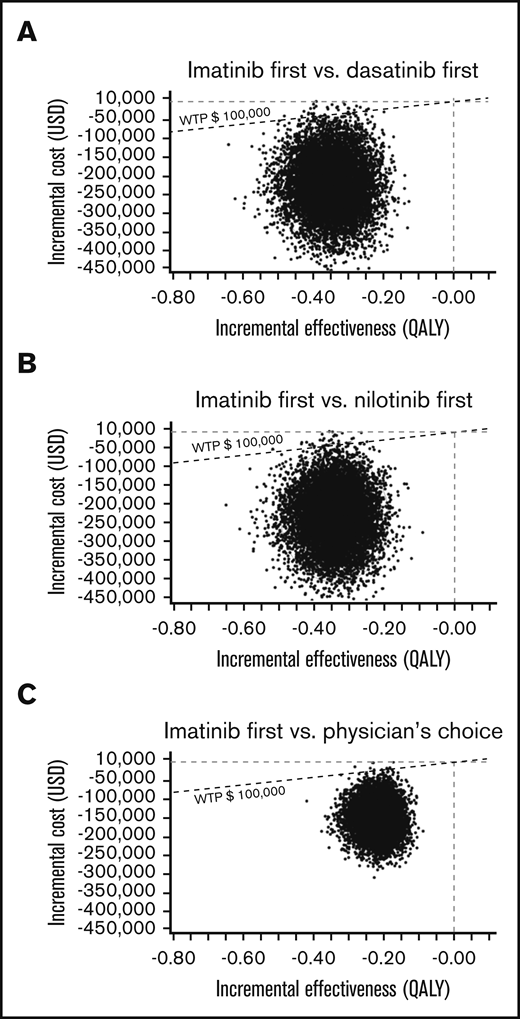
A multivariable PSA in the US model. ICER scattered plots of imatinib first vs dasatinib first (A), imatinib first vs nilotinib first (B), and imatinib first vs physician’s choice (C).
A multivariable PSA in the US model. ICER scattered plots of imatinib first vs dasatinib first (A), imatinib first vs nilotinib first (B), and imatinib first vs physician’s choice (C).
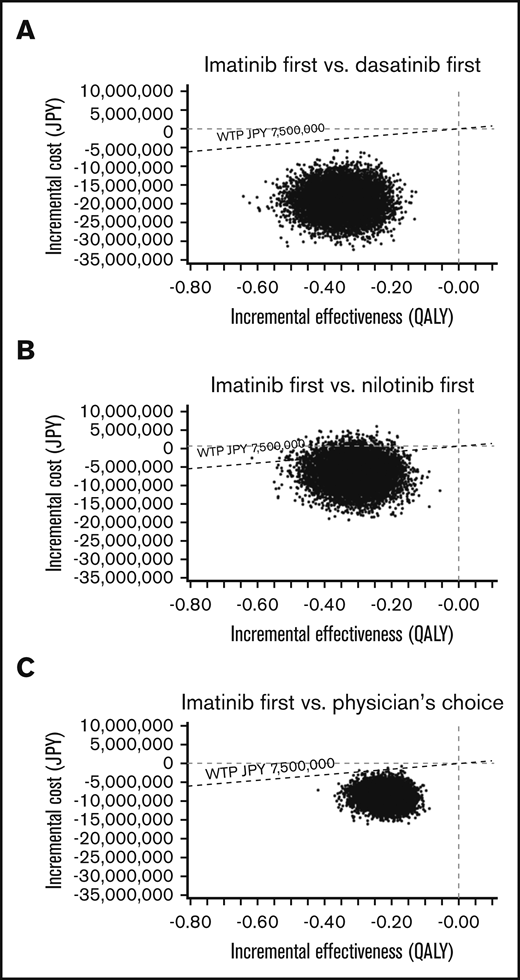
A multivariable PSA in the Japanese model. ICER scattered plots of imatinib first vs dasatinib first (A), imatinib first vs nilotinib first (B), and imatinib first vs physician’s choice (C).
A multivariable PSA in the Japanese model. ICER scattered plots of imatinib first vs dasatinib first (A), imatinib first vs nilotinib first (B), and imatinib first vs physician’s choice (C).
The PSA acceptability curve of the US and Japanese model showed that imatinib first is the most cost-effective of all strategies unless the WTP far exceeds the current standard of $100 000 in the United States and ¥7 500 000 in Japan (Figure 7).
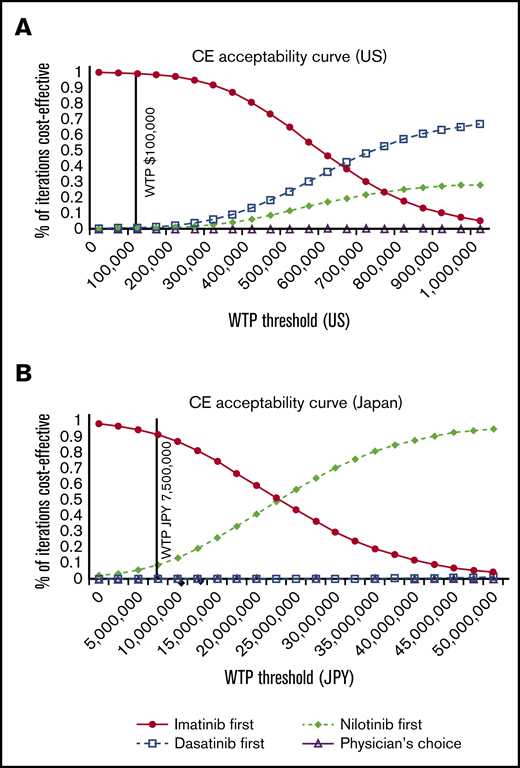
The cost-effectiveness (CE) acceptability curves of the 4 strategies. United States (A) and Japan (B).
The cost-effectiveness (CE) acceptability curves of the 4 strategies. United States (A) and Japan (B).
Discussion
In this study, we performed a simulation using a Markov model to compare the cost-effectiveness of 4 strategies for CML-CP based on the initial TKI choice with the incorporation of stop TKI. We conducted a 10-year simulation of imatinib-first, dasatinib-first, nilotinib-first, and physician’s choice approaches. The estimated overall survival using our model correlated well with the results of published clinical trials, and was similar in all 4 strategies. We estimated that ∼20% to 40% of patients would achieve TFR in 10 years, and the cost saved with remission was smaller for imatinib first compared with the other 3 strategies, due to the smaller percentage of patients who stop TKI. However, the cost-effectiveness analysis that compared 4 strategies showed that imatinib first was still the most cost-effective approach even after the incorporation of stop TKI, and this result was robust to deterministic sensitivity analysis and PSA with wide plausible ranges, except that the results were potentially sensitive to the changes in the costs of second-generation TKIs. For second-generation TKIs to be as cost-effective as imatinib as first-line treatment, the cost of the second-generation TKI needs to be within 119% of the current price of imatinib. The results may change when the patents of second-generation TKIs expire and generic compounds become available.
Our results were consistent with the decision analysis by Shih et al that showed that generic imatinib was overwhelmingly cost-effective compared with second-generation TKIs.20 Our study differed from theirs in several aspects. First, we simulated the clinical course of CML using the Markov model including altered health status due to CML. As a result, QALYs were lower in all strategies, and the difference between imatinib and second-generation TKIs was larger in our analysis. Second, our protocol for treatment discontinuation was rather conservative, in which DMR was defined as MR4.5 and TFR rate on imatinib was lower than that of second-generation TKI because we extracted the data from older studies with long-term follow-up.13,17 Regarding the costs, although the cost estimation was different between models and was highly sensitive to various factors such as prices of TKIs and WTP thresholds, their base-case results in the United States, which showed that the highest acceptable cost of second-generation TKI was 111% of the cost of imatinib, was very similar to our results. It is notable that we reached the same conclusion despite substantial differences between models and some assumptions in our model that could very favorably affect second-generation TKIs.
This analysis has several limitations. First, we did not include the second attempt to stop TKI after the first molecular relapse, or stop TKI after switching to second-line therapy. Attempts to discontinue treatment in such populations have been reported,17-19,29 and excluding these patients may have led to an underestimation of patients who achieve TFR. Second, the utilities regarding the health status of CML vary depending on the patient background.30 For women of childbearing age, a pregnancy while on TKI treatment is contraindicated because spontaneous abortion and infant abnormalities have been reported in women exposed to imatinib during pregnancy.31 The benefit of second-generation TKIs may be greater in patients who wish to discontinue TKI treatment to conceive a child because they offer a greater chance of treatment discontinuation. The cost-effectiveness of TKIs for such patients should be discussed separately. Third, we relied on the results of second-line therapy after first-line imatinib from older clinical studies,3,4,22 in which most patients had received longer prior therapy including hydroxycarbamide and interferon. This may have led to an underestimation of survival in the imatinib-first approach, and this discrepancy would become magnified as the simulation period is extended. Notably, the imatinib-first approach was still superior to other strategies despite this disadvantage. Another limitation is that this analysis was not a population-based lifelong simulation with a long observation period that incorporated the age distribution and normal life expectancy of the patients. However, because extending the simulation period to 20 years yielded similar results and the median age at CML diagnosis is ∼50 years,32 it is unlikely that the results would substantially change with such a simulation. Finally, we did not incorporate risk scores such as Sokal, Euro, and EUTOS into the model. Although imatinib was shown to be the most cost-effective option in this model, there may be some high-risk populations that could benefit from the earlier introduction of second-generation TKIs. In the original model, the authors reported that the imatinib-first approach was still cost-effective in patients with a high Sokal score.8 Because such populations would have fewer chances to achieve TFR, second-generation TKIs are unlikely to be cost-saving with the incorporation of stop TKI. In clinical practice, however, it is reasonable to choose second-generation TKIs in carefully selected populations if there is a survival benefit.
In conclusion, the imatinib-first strategy was shown to be the most cost-effective approach even with the incorporation of stop TKI. Although second-generation TKIs offer several advantages such as a fast and profound response, we need to be strategic in including them in the treatment algorithm. The use of imatinib as first-line therapy with careful monitoring of the molecular response and a prompt switch to second-generation TKIs could make the treatment of CML more cost-effective without compromising overall survival.
Acknowledgments
The authors are grateful to William V. Padula and Rena M. Conti for providing the details of the Markov diagram used in their published work. This research received no specific grant from any funding agency in the public, commercial, or not-for-profit sectors.
Authorship
Contribution: C.Y. wrote the paper; C.Y. and Y.K. designed research; and T.I., S.-i.K., Y.T., S.I., K. Mashima, T.N., K.U., D.M., H. Nakashima, H. Nakano, R.Y., M.S., Y.I., M.A., K.H., K.S., I.O., S.-i.F., M.U., K.O., K. Morita, and K. Muroi collected and analyzed data.
Conflict-of-interest disclosure: Y.K. received research grant and honoraria from Novartis Pharma, Bristol-Myers Squibb, Pfizer, Otsuka, and Takeda. S.-i.F. received honoraria from Novartis Pharma, Pfizer, and Takeda. M.A. and I.O. received honoraria from Novartis Pharma. The remaining authors declare no competing financial interests.
Correspondence: Yoshinobu Kanda, Division of Hematology, Department of Medicine, Jichi Medical University, 3311-1 Yakushiji, Shimotsuke, Tochigi 329-0498, Japan; e-mail address: ycanda-tky@umin.ac.jp.

