

Key Points
NRAS and KRAS mutations lead to different downstream transcriptional signatures and patient prognoses under current myeloma therapies.
RAS genotype alone does not strongly predict degree of active MAPK signaling, suggesting alternate precision medicine approaches are needed.

Abstract
A major driver of multiple myeloma (MM) is thought to be aberrant signaling, yet no kinase inhibitors have proven successful in the clinic. Here, we employed an integrated, systems approach combining phosphoproteomic and transcriptome analysis to dissect cellular signaling in MM to inform precision medicine strategies. Unbiased phosphoproteomics initially revealed differential activation of kinases across MM cell lines and that sensitivity to mammalian target of rapamycin (mTOR) inhibition may be particularly dependent on mTOR kinase baseline activity. We further noted differential activity of immediate downstream effectors of Ras as a function of cell line genotype. We extended these observations to patient transcriptome data in the Multiple Myeloma Research Foundation CoMMpass study. A machine-learning–based classifier identified surprisingly divergent transcriptional outputs between NRAS- and KRAS-mutated tumors. Genetic dependency and gene expression analysis revealed mutated Ras as a selective vulnerability, but not other MAPK pathway genes. Transcriptional analysis further suggested that aberrant MAPK pathway activation is only present in a fraction of RAS-mutated vs wild-type RAS patients. These high-MAPK patients, enriched for NRAS Q61 mutations, have inferior outcomes, whereas RAS mutations overall carry no survival impact. We further developed an interactive software tool to relate pharmacologic and genetic kinase dependencies in myeloma. Collectively, these predictive models identify vulnerable signaling signatures and highlight surprising differences in functional signaling patterns between NRAS and KRAS mutants invisible to the genomic landscape. These results will lead to improved stratification of MM patients in precision medicine trials while also revealing unexplored modes of Ras biology in MM.
Introduction
Multiple myeloma (MM) is an incurable malignancy of plasma cells. Considerable effort has gone into deep sequencing of MM to genomically classify patients for risk assessment and targeted therapy.1-5 While these studies have offered significant insight into MM biology and prognosis, this genomic knowledge largely remains untranslated into therapeutic strategies.6
We hypothesized that one reason genomic profiles alone have not improved clinical outcome is that they may not be fully predictive of higher-level processes, such as dysregulated signaling, that drive cancer phenotypes. Mass spectrometry–based phosphoproteomics has therefore proven a powerful tool to explore cellular-wide signaling alterations in cancer.7,8 For example, studies in acute myeloid leukemia have shown that phosphorylation signatures can be used to predict sensitivity to kinase inhibitors in cell lines and primary samples.9,10 Alternatively, as an indirect measure of cellular signaling, downstream transcriptional signatures may reveal specific functional readouts of upstream kinase activity.11
In MM, it is thought that aberrant signaling is strongly driven by mutations in the RAS family of proto-oncogenes. These mutations are proposed to activate oncogenic signaling primarily via the MAPK and phosphatidylinositol 3-kinase (PI3K)/protein kinase B (AKT) pathways.12,13 An outstanding mystery in oncology is tumor-specific selection of mutations in different RAS isoforms, despite >80% sequence homology and highly similar function.13,14 Furthermore, it is not known why mutations in specific RAS codons predominate in some cancers but not others.15,16
MM is a unique case study of Ras biology, as ∼40% of MM patient tumors have predicted activating mutations in KRAS or NRAS,4,5 with an approximately equal distribution between the two. Notably, these mutations are very rare in the precursor lesion monoclonal gammopathy of uncertain significance, suggesting that RAS mutations are important for disease transformation.17 The majority of MM research has treated mutations in these RAS isoforms as largely indistinguishable, though some distinctions have emerged. For example, under earlier MM therapies, patients with KRAS mutations had worse overall survival than those with NRAS mutations.18,19 However, later observations suggested that patients with NRAS mutations responded more poorly to bortezomib-based therapies than patients with KRAS mutations.20 Cell line studies indicated that KRAS leads to more rapid proliferation in the absence of interleukin-6 stimulation than NRAS.21,22 More recent sequencing studies have suggested that NRAS mutations tend to cluster with specific genomic aberrations.5 Finally, bone marrow immunohistochemistry suggested differences in extracellular signal-regulated kinase (ERK) phosphorylation depending on the RAS isoform and specific mutation.23 Therefore, this evidence suggests that KRAS and NRAS in MM are not exactly equivalent, but much about the biology of these differences remains unclear.
Here, we apply an integrated approach using both unbiased phosphoproteomics and machine-learning classifiers of transcriptional response to dissect signaling in MM. Our results reveal differential kinase activity across MM cell lines with potential implications for selective kinase vulnerability. We next uncover underlying transcriptional output differences for patients with KRAS and NRAS mutations, with particular prognostic implications of NRAS Q61 mutations. Surprisingly, we find that only a fraction of RAS-mutated patients are predicted to have highly activated MAPK signaling vs wild-type (WT) RAS patients. Our results identify RAS-mutated MM patients who may benefit from precision medicine strategies and reveal modes of RAS isoform-driven biology with implications across RAS-mutated cancers.
Methods
Cell culture and phosphoproteomics
Cell lines were cultured and phosphoproteomics experiments and analysis were performed as described previously.24 Additional details can be found in supplemental Methods.
Kinase inhibitor screens on myeloma cell lines
Briefly, 1e3 myeloma cells were seeded per well in a 384-well plate and treated with the designated inhibitor at each dose in quadruplicate. Viability was determined at 48 hours using CellTiterGlo reagent (Promega) and 50% inhibitory concentration calculated using GraphPad Prism software v6. Additional details are available in supplemental Methods.
RAS classifier for MM
We downloaded RNA sequencing (RNA-seq) and somatic mutation data from the Multiple Myeloma Research Foundation (MMRF) CoMMpass (version IA11a); 90% of patient data with transcriptome and genotype information (n = 706) was used to optimize and train the machine-learning classifier, and the remaining 10% of data (n = 80) was withheld as a test set. The data were split to ensure balanced representation of total KRAS, NRAS, and WT RAS samples. We adapted our previously published elastic net penalized logistic regression classifier for predicting RAS pathway activation25 with a one-vs-rest approach to classify KRAS and NRAS mutations separately. Additional details can be found in supplemental Methods.
MAPK pathway activity and the Multiple Myeloma Kinome Browser
We applied a perturbation-response machine-learning model called PROGENy (https://github.com/saezlab/progeny) implemented in R on RNA-seq data from myeloma cell lines (www.keatslab.org) and patient samples (CoMMpass IA11). The MAPK PROGENy score quartiles were compared with patient progression-free survival (PFS) and overall survival (OS) using a Cox proportional hazards regression; score quartiles were compared with patient clinical characteristics (age, sex, race, β2 microglobulin, and M-protein) using a linear regression for continuous variables and Fisher’s exact test for discrete variables. Common translocations and copy-number alterations were determined as previously described.26 Additional details are available in supplemental Methods.
Results
Kinase activity from phosphoproteomics is modestly predictive of kinase inhibitor sensitivity in myeloma cell lines
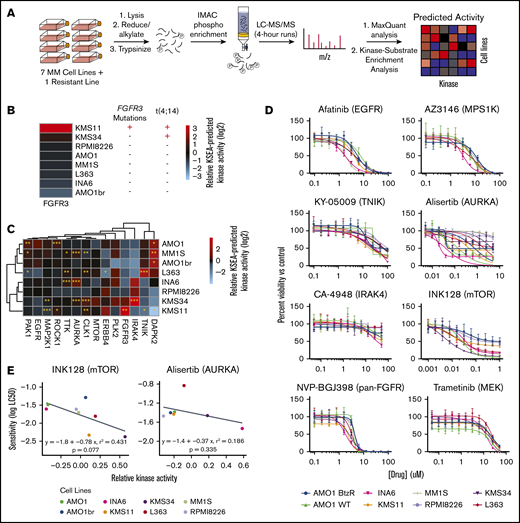
Predicting kinase activity and inhibitor sensitivity in MM by unbiased phosphoproteomics. (A) Schematic of the pipeline for kinase activity prediction from phosphoproteomic data. All phosphoproteomics were performed in biological triplicate and combined by averaging the log2-transformed intensities of phosphosites associated with each kinase to generate activity scores. (B) Association of predicted FGFR3 activity from KSEA with known genetic aberrations. (C) Heatmap of the KSEA-predicted activities of 14 kinases that exhibited differential activity signatures across myeloma cell lines. The significance of the score from the median activity across cell lines was calculated by z-statistics (see “Methods”). *P ≤ .05, **P ≤ .01, ***P ≤ .001. (D) Viability curves showing the drug response of 8 myeloma cell lines to 8 kinase inhibitors (n = 4, mean ± standard deviation), with only INK128 and alisertib exhibiting strongly differential effects. (E) Correlation between inhibitor sensitivity and KSEA-predicted kinase activity for mTOR and aurora kinase A across myeloma cell lines shows modest predictive power. P values were calculated based on the null hypothesis that no relationship exists between the activity of a kinase and its sensitivity to an inhibitor. LC50, 50% lethal concentration; IMAC, immobilized metal affinity chromatography; LC-MS/MS, liquid chromatography-tandem mass spectrometry.
Predicting kinase activity and inhibitor sensitivity in MM by unbiased phosphoproteomics. (A) Schematic of the pipeline for kinase activity prediction from phosphoproteomic data. All phosphoproteomics were performed in biological triplicate and combined by averaging the log2-transformed intensities of phosphosites associated with each kinase to generate activity scores. (B) Association of predicted FGFR3 activity from KSEA with known genetic aberrations. (C) Heatmap of the KSEA-predicted activities of 14 kinases that exhibited differential activity signatures across myeloma cell lines. The significance of the score from the median activity across cell lines was calculated by z-statistics (see “Methods”). *P ≤ .05, **P ≤ .01, ***P ≤ .001. (D) Viability curves showing the drug response of 8 myeloma cell lines to 8 kinase inhibitors (n = 4, mean ± standard deviation), with only INK128 and alisertib exhibiting strongly differential effects. (E) Correlation between inhibitor sensitivity and KSEA-predicted kinase activity for mTOR and aurora kinase A across myeloma cell lines shows modest predictive power. P values were calculated based on the null hypothesis that no relationship exists between the activity of a kinase and its sensitivity to an inhibitor. LC50, 50% lethal concentration; IMAC, immobilized metal affinity chromatography; LC-MS/MS, liquid chromatography-tandem mass spectrometry.
We used kinase-substrate enrichment analysis (KSEA)28 to identify kinases with predicted differential activity in ≥1 cell line vs all others. As an initial validation of KSEA, we found that KMS-11, with both a t(4;14) translocation and an activating mutation in FGFR3, showed the highest predicted activity of FGFR3 kinase (Figure 1B). KMS-34, with a t(4;14) translocation increasing FGFR3 expression but no FGFR3 mutation, showed the second-highest predicted FGFR3 activity. Overall, using KSEA, we identified 14 kinases that appeared to have differential activity across MM cell lines (Figure 1C).
We next evaluated whether differential kinase activities predicted sensitivity to inhibitors. Using an initial prescreening on 3 MM lines (AMO-1, MM.1S, and RPMI-8226), we found that 8 of 13 available selective inhibitors demonstrated anti-MM effects at ≤20 μM (supplemental Figure 2A). We then tested these inhibitors on all 8 lines used for phosphoproteomics (Figure 1D). We were surprised to find that only 2 of the 8 inhibitors tested in the full panel showed a notable distribution of the lethal concentrations required to kill 50% of the population (LC50s) across the tested MM lines. We more closely examined these inhibitors (alisertib targeting Aurora kinase A and INK128 targeting mammalian target of rapamycin [mTOR] kinase) and found a modest correlation between predicted kinase activity and sensitivity to the inhibitor (Figure 1E). Within the smaller range of LC50s for other inhibitors, we did not find correlations between predicted kinase activity and inhibitor LC50, though we note that KMS-11 and KMS-34 were 2 of the 3 most sensitive lines to the pan-FGFR inhibitor NVP-BGJ398 (supplemental Figure 2B). Overall, these results suggest that kinase activities from KSEA are modestly predictive of sensitivity to targeted kinase inhibitor therapy.
Phosphoproteomics reports on specific alterations in MAPK pathway activity as a function of RAS mutation status
As mutations in RAS are the most commonly seen single-nucleotide genomic alteration in MM,5 we next examined the known Ras effectors. The KSEA-predicted activity of the RAF isoforms ARAF, BRAF, and CRAF/RAF1 is reflective of MAPK activation immediately downstream of Ras.29 We first noted that cell lines with RAS mutations did not show uniform RAF isoform activity as inferred by KSEA on our phosphoproteomic data. Instead, the 2 lines (MM.1S and RPMI-8226) with canonical activating mutations in KRAS (both G12A) showed the highest levels of predicted BRAF and ARAF activity (Figure 2A). We note that while relative BRAF and CRAF phosphorylation at a single canonical site alone appears largely unchanged across lines, KSEA kinase activity scores reflect aggregate signaling effects across annotated phosphosites on multiple proteins. Similar to findings in other studies,30 by western blotting, we further found that RAS mutation status did not lead to consistent levels of ERK1/2T202/Y204, AKTT308/S473, and 4EBP1T37/46 phosphorylation, commonly used readouts of downstream MAPK and PI3K/AKT activities (Figure 2B).
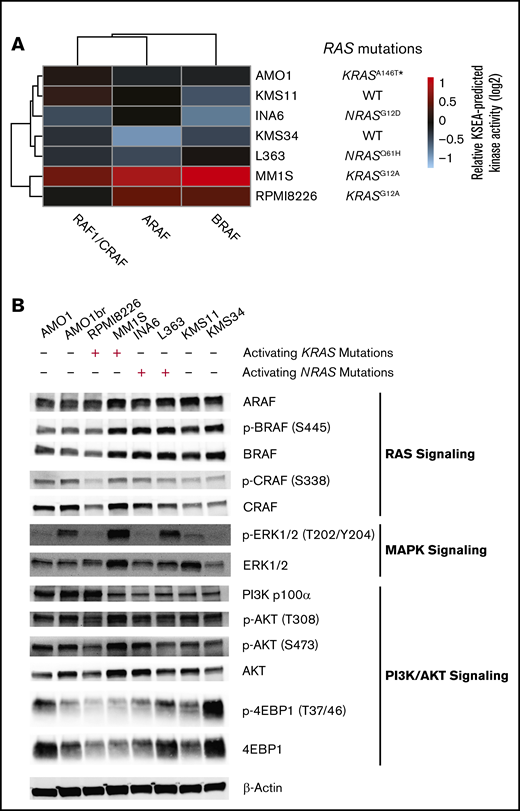
KRAS mutant MM cell lines show greatest activation of downstream RAF effectors based on phosphoproteomics. (A) Heatmap of KSEA-predicted activity of the immediate downstream substrates of Ras protein (ARAF, BRAF, and RAF1/CRAF) across the 7 profiled myeloma cell lines. (B) Western blot analysis of RAS, MAPK, and PI3K/AKT pathway signatures in MM cell lines.
KRAS mutant MM cell lines show greatest activation of downstream RAF effectors based on phosphoproteomics. (A) Heatmap of KSEA-predicted activity of the immediate downstream substrates of Ras protein (ARAF, BRAF, and RAF1/CRAF) across the 7 profiled myeloma cell lines. (B) Western blot analysis of RAS, MAPK, and PI3K/AKT pathway signatures in MM cell lines.
A machine-learning–based classifier distinguishes transcriptional output of KRAS vs NRAS mutants in MM patients and cell lines
These findings motivated us to further evaluate the biological differences between KRAS and NRAS mutations in MM patients. As MM patient samples are not amenable to phosphoproteomics due to sample input limitations, we turned to more widely available transcriptome data. We recently reported a machine-learning classifier based on an elastic net penalized logistic regression able to predict RAS genotype, or RAS-mutant-like phenotype, from tumor RNA-seq.25 This initial classifier, trained and tested on solid tumor data from The Cancer Genome Atlas, did not distinguish between RAS isoforms. Applying this initial classifier to RNA-seq data from 812 patient tumors in the MMRF CoMMpass study (release IA11a; research.themmrf.org), we observed very limited predictive power for RAS genotype (supplemental Figure 3A).
Review of gene weights in the initial RAS classifier revealed that many highly weighted genes were expressed minimally in hematopoietic cells (not shown), potentially leading to this lack of applicability. Ras signaling has previously been detected using machine learning applied to a single tumor type.31 We therefore used a similar machine-learning strategy to build an MM-specific classifier based on CoMMpass patient data. We extended our prior computational approach by developing a 3-way classifier, attempting to distinguish transcriptional signatures of patients with WT RAS, KRAS mutations, and NRAS mutations (Figure 3A). For building the classifier, we included patients in the mutation category if activating KRAS/NRAS mutations in codon positions 12, 13, and 61 were reported in CoMMpass data, irrespective of variant allele frequency (VAF). Ten patients with subclonal mutations in both KRAS and NRAS were excluded.
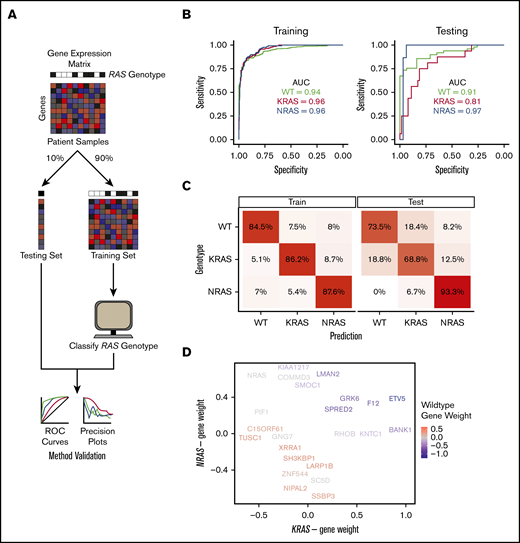
An MM-specific, transcriptome-based RAS classifier reveals genes driving the NRAS and KRAS phenotype. (A) Workflow for training and testing a gene-expression–based machine-learning algorithm to predict RAS genotype using an elastic net regression model. (B) Receiver operating characteristic curves for evaluating the performance of the predictive model on the training and testing sets. The area under the curve (AUC) is reported for each prediction class. (C) Confusion matrices showing the fraction of samples in each label-vs-predicted-class combination. (D) Multidimensional plot displaying weighted genes playing the most prominent role in predicting NRAS, KRAS, or WT RAS genotype.
An MM-specific, transcriptome-based RAS classifier reveals genes driving the NRAS and KRAS phenotype. (A) Workflow for training and testing a gene-expression–based machine-learning algorithm to predict RAS genotype using an elastic net regression model. (B) Receiver operating characteristic curves for evaluating the performance of the predictive model on the training and testing sets. The area under the curve (AUC) is reported for each prediction class. (C) Confusion matrices showing the fraction of samples in each label-vs-predicted-class combination. (D) Multidimensional plot displaying weighted genes playing the most prominent role in predicting NRAS, KRAS, or WT RAS genotype.
We used 90% of the CoMMpass patient data as a training set (n = 706 total; n = 439 WT, n = 138 KRAS, n = 129 NRAS) and the remaining 10% (n = 106 total; n = 49 WT, n = 16 KRAS, n = 15 NRAS) as a holdout test set. The one-vs-rest, multiclass logistic regression classifier was trained to predict RAS genotype based on transcriptional signatures in 8000 genes that exhibited the greatest variance in expression across CoMMpass samples. Our classifier performed robustly in both the training and test sets, with areas under the receiver operating characteristic curves between 0.81 and 0.97 in the test set (Figure 3B). We also applied the classifier to a data set of 65 MM cell lines (data from www.keatslab.org). The classifier performed similarly well in these data, indicating high generalizability (supplemental Figure 3B).
We next investigated whether differences exist in predictions between patients carrying KRAS and NRAS mutations. To address this, we first examined the “confusion matrix,” finding that incorrectly predicted NRAS-mutant genotype samples in the training set and incorrectly predicted KRAS-mutant genotype samples in the testing set were more likely to be predicted as being WT RAS rather than a mutation in the other RAS isoform (Figure 3C). This finding underscores divergence in transcriptional output between these mutations. We also observed that tumors with higher VAF had less accurate classification between KRAS and NRAS mutation while lower VAF led to less accurate classification between WT and RAS mutant (supplemental Figure 3C). Overall, we found no statistical difference between the clonality of activating KRAS and NRAS mutations in MM patients (supplemental Figure 3D).
We further examined the highest weighted genes for the KRAS mutant, NRAS mutant, or WT RAS classifiers (Figure 3D; supplemental Data Set 2). We found a limited set of genes whose expression levels increased the probability of classification as either RAS mutant and decreased probability of WT RAS: SPRED2, GRK6, F12, and ETV5. Of these genes, SPRED2 and ETV5 are well defined as MAPK responsive.32,33 Overall, however, the genes that specifically defined an increased or decreased probability of KRAS or NRAS mutant classification were largely independent of each other (genes along x- and y-axes in Figure 3D). Surprisingly, the only gene whose expression strongly predicted NRAS over KRAS mutation was NRAS itself.
RAS mutants drive differential expression of RAS genes and oncogenic addiction in myeloma
This finding motivated us to further examine RAS gene expression as a function of genotype in MM patients. Consistent with our machine-learning classifier, we indeed found that patients with a detected NRAS mutation had significantly increased expression of NRAS compared with KRAS-mutated samples (Figure 4A). We also saw a less pronounced reciprocal relationship in KRAS-mutated samples. This finding is reminiscent of that found in a prior analysis of numerous cancer cell lines, where mutations in one RAS isoform were associated with increased expression of that isoform and depressed expression of the other.34 We further confirmed a similar relationship between NRAS mutation and gene expression, but not KRAS, across MM cell lines (supplemental Figure 4).
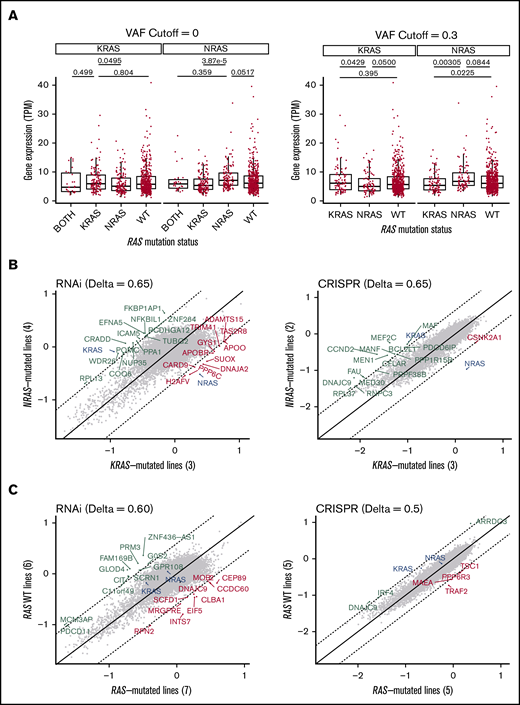
MM-mutant KRAS and NRAS are associated with differential RAS expression and are “addicted” to the mutated RAS isoform. (A) Boxplots of KRAS and NRAS expression in tumor samples from newly diagnosed MM patients in CoMMpass. The distributions are stratified by RAS mutation status and VAF to evaluate their effects on gene expression. P values from Welch’s 2-tailed t tests are reported for relevant comparisons. (B) Scatterplot of the gene dependency scores from DepMap between NRAS-mutated and KRAS-mutated MM cell lines from RNA interference (18Q2 release) or CRISPR deletion (Avana 18Q2) functional screens. Comparing between the two data sets, the related RAS gene shows consistent essentiality, but not other genes. Dashed lines represent cutoffs (Δ) for differential gene dependency between the RAS-mutated lines. (C) Similar to panel B, comparing WT RAS and RAS-mutated myeloma cell lines.
MM-mutant KRAS and NRAS are associated with differential RAS expression and are “addicted” to the mutated RAS isoform. (A) Boxplots of KRAS and NRAS expression in tumor samples from newly diagnosed MM patients in CoMMpass. The distributions are stratified by RAS mutation status and VAF to evaluate their effects on gene expression. P values from Welch’s 2-tailed t tests are reported for relevant comparisons. (B) Scatterplot of the gene dependency scores from DepMap between NRAS-mutated and KRAS-mutated MM cell lines from RNA interference (18Q2 release) or CRISPR deletion (Avana 18Q2) functional screens. Comparing between the two data sets, the related RAS gene shows consistent essentiality, but not other genes. Dashed lines represent cutoffs (Δ) for differential gene dependency between the RAS-mutated lines. (C) Similar to panel B, comparing WT RAS and RAS-mutated myeloma cell lines.
We next took advantage of data on “essential genes” required for cell viability as determined via genome-wide short hairpin RNA (shRNA) and clustered regularly interspaced short palindromic repeats (CRISPR) screens.35 We confirmed earlier single-gene knockdown results36 that RAS-mutated MM cells are highly dependent on the specific RAS-mutated isoform (Figure 4B). However, this genome-wide analysis did not identify any other genes across both the shRNA and CRISPR data that led to specific dependency in NRAS or KRAS mutants or between RAS-mutated cell lines and WT RAS lines (Figure 4C). These findings underscore the profound “oncogene addiction” of MM plasma cells to mutated RAS.
KRAS mutations at any codon and NRAS Q61 mutations lead to poorer prognosis
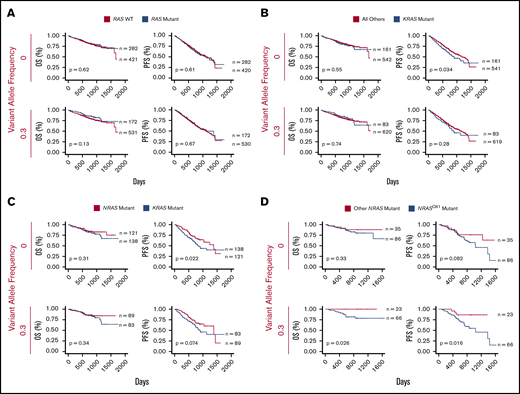
KRAS mutations and NRAS Q61 predict worse outcomes in MM. (A) Survival curves comparing the clinical outcome of newly-diagnosed MM patients with and without activating RAS mutations (CoMMpass release IA11). (B) KRAS-mutated MM patients vs all other patients. (C) Activating KRAS vs NRAS mutations. (D) Codon-61 NRAS mutations vs other NRAS variants. All analyses were performed at VAF cutoffs of 0 and 0.3 to assess the effect of tumor heterogeneity on survivorship, with 0.3 as a signifier of a largely dominant RAS-mutated clone for this heterozygous mutation. P values from log-rank test and the sample size for each group are reported.
KRAS mutations and NRAS Q61 predict worse outcomes in MM. (A) Survival curves comparing the clinical outcome of newly-diagnosed MM patients with and without activating RAS mutations (CoMMpass release IA11). (B) KRAS-mutated MM patients vs all other patients. (C) Activating KRAS vs NRAS mutations. (D) Codon-61 NRAS mutations vs other NRAS variants. All analyses were performed at VAF cutoffs of 0 and 0.3 to assess the effect of tumor heterogeneity on survivorship, with 0.3 as a signifier of a largely dominant RAS-mutated clone for this heterozygous mutation. P values from log-rank test and the sample size for each group are reported.
We next looked more specifically at differences in KRAS and NRAS mutations. We found that cases with KRAS mutation at VAF >0 (n = 161) have a significantly decreased PFS vs all others (P = .034), though there was no significant difference in OS (P = .55) (Figure 5B). Surprisingly, for cases with a dominant KRAS-mutant subclone (VAF >0.3; n = 83), any relationship with survival difference disappeared (PFS P = .28; OS P = .74).
In contrast, we did not find any outcome effects of all patients with NRAS mutations vs all others (supplemental Figure 5A). We next found significantly decreased PFS at VAF >0 (P = .022) and a similar trend at VAF >0.3 (P = .074) for KRAS vs NRAS-mutated samples but no significant difference in OS (Figure 5C). Overall, these findings appear somewhat consistent with earlier results, suggesting that KRAS mutations carry a worse prognosis than NRAS mutations,18,19 though with modern treatment regimens, this poor-prognosis effect of KRAS is perhaps not as pronounced.
We next looked at specific effects of activating mutations13 in codons 12, 13, and 61. We did not find significant differential survival effects for KRAS mutations in any specific codon (supplemental Figure 5D-F). However, NRAS mutations at codon Q61 led to strikingly worse PFS and OS vs other NRAS mutations, but only when present in a dominant subclone (PFS P = .016 and OS P = .026 at VAF >0.3) (Figure 5D). This finding suggests that clonal or near-clonal NRAS Q61 mutations are particularly potent in driving disease in the setting of current therapies.
A perturbation-based transcriptional signature identifies highly variable activation of the MAPK pathway across RAS mutant samples
Our results thus far strongly suggest that NRAS and KRAS mutants are not equivalent in driving MM. We next examined functional readouts of MAPK pathway activation in the context of RAS mutation. We took advantage of a recently described method of transcriptional classification of pathway activity termed PROGENy.38 This method provides improved prediction of pathway activation when compared with prior methods of transcriptional analysis.38 Using PROGENy prediction for MAPK pathway activity, we were surprised to find a very prominent overlap of MAPK activation scores across RAS-mutated patients vs WT RAS (Figure 6A). This result stands in contrast to the expected finding of clearly increased MAPK activity in RAS-mutated patients vs WT RAS, which, notably, we found in MM cell lines (Figure 6B). Despite this large degree of overlap in patient samples, we still found that the mean of the MAPK distribution was significantly increased for both KRAS (P = 2.16e-6) and NRAS mutants (P = .0123), as well as rare patients with mutations in both genes (P = 1.53e-4), vs WT RAS. Overall, however, our results suggest that many patients with RAS mutations do not strongly activate the MAPK pathway over patients with WT RAS tumors.
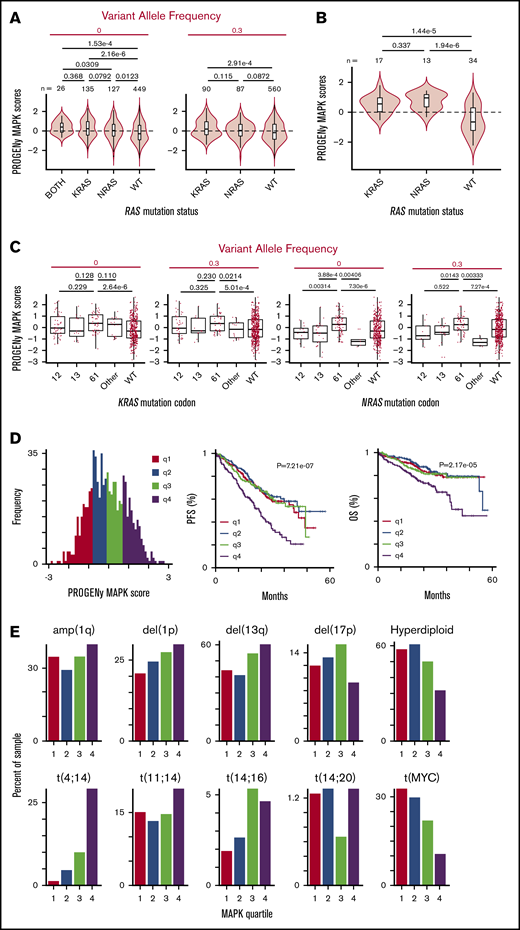
PROGENy reveals RAS mutations do not strongly increase MAPK activity in all RAS-mutant tumors, but patients with increased MAPK activity have decreased survival. (A) Violin plots showing the distribution of MAPK pathway activation for MM patient samples in CoMMpass based on PROGENy predictions reveals a surprisingly similar range of scores for WT RAS and RAS-mutated patients, though mean of distribution is significantly different. P values for all combinations using Welch’s 2-tailed t tests. (B) MM cell lines (data from www.keatslab.org) show more pronounced effects of RAS mutation driving MAPK activity than patient samples in panel A. (C) Activating mutations at the Q61 codon show the strongest effect in driving MAPK activity in NRAS mutants in CoMMpass samples, whereas KRAS mutations do not show similar codon-specific effects. P values by Welch’s 2-tailed t test. (D) Histogram of PROGENy-predicted MAPK activation colored by quartiles. Survival analyses demonstrate that high levels of MAPK activity are predictive of poorer outcomes. P values were calculated using Wald’s test. (E) Association between PROGENy-predicted MAPK scores and common genomic markers in MM.
PROGENy reveals RAS mutations do not strongly increase MAPK activity in all RAS-mutant tumors, but patients with increased MAPK activity have decreased survival. (A) Violin plots showing the distribution of MAPK pathway activation for MM patient samples in CoMMpass based on PROGENy predictions reveals a surprisingly similar range of scores for WT RAS and RAS-mutated patients, though mean of distribution is significantly different. P values for all combinations using Welch’s 2-tailed t tests. (B) MM cell lines (data from www.keatslab.org) show more pronounced effects of RAS mutation driving MAPK activity than patient samples in panel A. (C) Activating mutations at the Q61 codon show the strongest effect in driving MAPK activity in NRAS mutants in CoMMpass samples, whereas KRAS mutations do not show similar codon-specific effects. P values by Welch’s 2-tailed t test. (D) Histogram of PROGENy-predicted MAPK activation colored by quartiles. Survival analyses demonstrate that high levels of MAPK activity are predictive of poorer outcomes. P values were calculated using Wald’s test. (E) Association between PROGENy-predicted MAPK scores and common genomic markers in MM.
Examining codon-level effects (Figure 6C) for KRAS, we found no significant differences between MAPK scores for mutations in codons 12, 13, and 61. For NRAS, in contrast, we found significantly higher MAPK scores for mutations in codon 61 vs codons 12 and 13. MAPK scores were also markedly higher for codon 61 vs rare mutations in other noncanonical NRAS codons in patients.
Increased MAPK activity predicts worse patient outcomes
These observations led us to hypothesize that high levels of tumor MAPK pathway activity, regardless of RAS mutation status, may manifest in more aggressive disease. Consistent with our hypothesis, we indeed found that patients in the highest quartile MAPK score had significantly decreased PFS (P = 7.21e-7) and OS (P = 2.17e-5) (Figure 6D).
We sought to rule out the possibility that an increased MAPK score served as a proxy for known prognostic features in MM. We did not find any relationship between MAPK score and sex, race, age, or β2 microglobulin, though we identified an association with increased M-protein at diagnosis (supplemental Figure 6A). We next evaluated the relationship between MAPK score and MM genomic subtypes (Figure 6E). We found a significant relationship between MAPK score and t(4;14) translocation,39 consistent with the ability of FGFR-family tyrosine kinases to activate MAPK upstream of Ras.40 We also observed more limited associations with other poor prognosis features such as del(1p) and del(13q) (Figure 6E; supplemental Figure 6B). We further evaluated the relationship between MAPK score and common sequence variants present in >2% of CoMMpass patients (supplemental Figure 6C; supplemental Data Set 3), finding a significant association with FGFR3, KRAS, and BRAF mutations, but not NRAS. Together, these results confirm MAPK-related genomic lesions can lead to increased MAPK activity, consistent with known biology. However, these results also underscore the limitation of genome-only testing; a majority of patients with these well-characterized changes are not in the top quartile of MAPK activity associated with poor prognosis. Overall, our results support the transcriptome-based PROGENy MAPK score as a differential predictor of MM outcomes from other previously known biochemical or genomic markers.
Integrated analysis of kinase activity and drug sensitivity informs precision medicine in MM
Our results suggest that targeting therapies specifically for patients with increased MAPK activity, as opposed to RAS genotype alone, may be a fruitful strategy in MM precision medicine. To suggest agents which may be most effective in this context, we analyzed data from the Genomics of Drug Sensitivity in Cancer database.41 Of 265 total compounds tested, we identified 3 small molecules, the MEK inhibitor refametinib, the MEK inhibitor PD0325901, and the BRAF inhibitor dabrafenib, that showed the greatest correlation (R2 > 0.65; supplemental Figure 7) between the Genomics of Drug Sensitivity in Cancer IC50s in MM cell lines (n = 15) and PROGENy MAPK scores from transcriptome data (Figure 7A). These agents could be potentially considered in clinical applications with targeted use based on tumor transcriptome-based MAPK score.
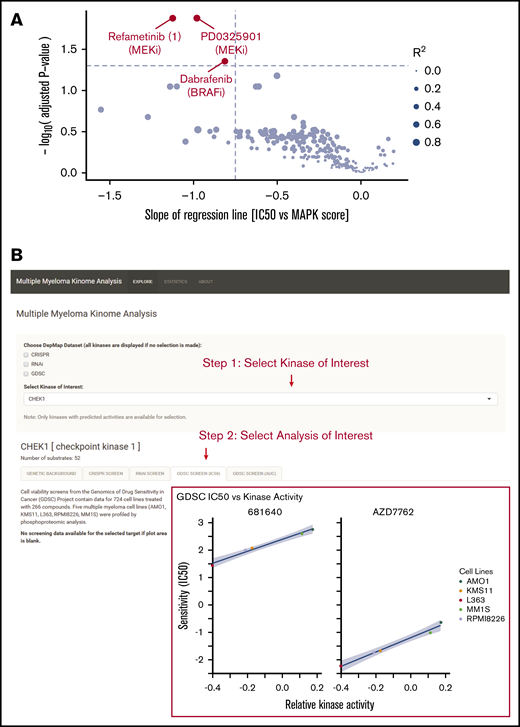
Integration of multiple data types for precision therapy in MM. (A) Volcano plot showing drug candidates for treating tumors with high predicted MAPK activity. Drug sensitivity data from Genomics of Drug Sensitivity in Cancer database (across 265 compounds tested) and MAPK scores from MM cell line transcriptome data (keatslab.org). P values are calculated based on the null hypothesis that no relationship exists between MAPK activity and inhibitor sensitivity. The 3 compounds with significant correlations between MAPK activity and drug sensitivity are highlighted in red. (B) Screenshot of the Multiple Myeloma Kinome Browser (https://tony-lin.shinyapps.io/depmap_app/). The example shows the integration of drug sensitivity data with phosphoproteome-based kinase activity predictions on MM cell lines for checkpoint kinase 1.
Integration of multiple data types for precision therapy in MM. (A) Volcano plot showing drug candidates for treating tumors with high predicted MAPK activity. Drug sensitivity data from Genomics of Drug Sensitivity in Cancer database (across 265 compounds tested) and MAPK scores from MM cell line transcriptome data (keatslab.org). P values are calculated based on the null hypothesis that no relationship exists between MAPK activity and inhibitor sensitivity. The 3 compounds with significant correlations between MAPK activity and drug sensitivity are highlighted in red. (B) Screenshot of the Multiple Myeloma Kinome Browser (https://tony-lin.shinyapps.io/depmap_app/). The example shows the integration of drug sensitivity data with phosphoproteome-based kinase activity predictions on MM cell lines for checkpoint kinase 1.
To assist in further integration of kinase activity into precision medicine, we developed an interactive software tool called the Multiple Myeloma Kinome Browser (https://tony-lin.shinyapps.io/depmap_app/) combining our phosphoproteome-based kinase activity predictions with multiple data types on MM cell lines from the Cancer Dependency Map (18Q2 release). We integrated functional studies, such as drug sensitivity, CRISPR deletion, and shRNA screens, with features including gene expression, copy-number variation, and mutations, for 297 kinases across seven MM cell lines. As one example of its use, we show that a strong, negative association exists between the predicted activity and the sensitivity of checkpoint kinase 1 to 2 different Chk1 inhibitors (Figure 7B). This freely available resource may prove beneficial for future investigation of targeted therapies in MM.
Discussion
Here, we used an integrated approach of unbiased phosphoproteomics and transcriptional classifiers to identify differential regulation of signaling in MM. Our results delineate prominent differences in KRAS and NRAS signaling outputs, biology, and patient outcomes.
Notably, only 2 of 13 inhibitors we tested showed any notable correlation between predicted kinase activity and sensitivity. For INK128 (TAK-228/sapanasertib), a phase 1/2 trial in MM showed only minimal responses to single-agent therapy.42 Our data suggest that selecting patients based on mTOR pathway activation may lead to better results for other mTOR inhibitors, such as the newly described molecule RapaLink-1.43 Some of the lack of predictive power of our phosphoproteome analysis is likely biological; simply because a specific kinase activity is increased does not mean a tumor will selectively depend on it for survival. We are also limited by current bioinformatics tools, which are imperfect in predicting kinase activity across thousands of phosphopeptides.44
We next shifted our focus to RAS. Both in MM cell lines and primary samples, there has been surprisingly little correlation between MAPK activity as measured by ERK phosphorylation and sensitivity to tested MEK/ERK inhibitors.30,45 We also found no relationship between predicted MEK activity and sensitivity to the MEK inhibitor trametinib (Figure 1D). Immunohistochemistry of MM patient bone marrow has suggested that the majority shows ERK phosphorylation, regardless of RAS mutation status.46 These findings suggest that ERK phosphorylation is not a specific readout of MAPK activity that drives tumor aggression. Broader transcriptional signatures, such as those we derive here, could be more effective in identifying patients who could benefit from targeted therapies.
By adapting a machine-learning classifier,25 we demonstrated that mutated NRAS and KRAS are associated with divergent downstream transcriptional signatures. The relationship between RAS mutation status and gene expression may align with emerging evidence of allelic imbalance across oncogenes, where both mutation status and gene expression converge to drive tumor proliferation.47,48 These findings further elucidate underlying biological differences among these Ras isoforms in MM that were not previously observed.
Our finding that patients with the highest predicted PROGENy MAPK scores carry the poorest prognosis leads to a pressing question: is there a way to exploit this observation for MM precision medicine? Our results strongly support the notion that genotype alone is not enough to stratify MM patients to receive MEK or ERK inhibitors, for example. Instead, we should focus on patients with high MAPK scores, regardless of RAS genotype. We found strongly increased MAPK scores in RAS-mutant cell lines vs WT, but not in patient samples, suggesting the tumor microenvironment in vivo may play an important role in modulating MAPK pathway activity. This hypothesis is in line with our prior evidence that interleukin-6 in the microenvironment strongly modulates MEK signaling and MM survival.49 Furthermore, the high degree of intratumoral heterogeneity in MM creates particular hurdles for any therapy that may only eliminate specific subclones.4 However, new approaches to directly target Ras,12 in addition to existing strategies, may be particularly intriguing in these high-MAPK patients. We therefore suggest a functionally driven, as opposed to genotype-driven, approach to kinase inhibitor selection in MM. Though currently limited to cell lines, our publicly available tool at https://tony-lin.shinyapps.io/depmap_app/ will enable others to readily extract other kinase- and signaling-level relationships.
While we cannot definitively separate causation from correlation based on observational CoMMpass data, our results suggest that increased MAPK signaling is a driver of poor prognosis and that this increased signaling can be driven by various genomic lesions. In particular, the increased MAPK signaling and poorer outcomes driven by NRAS Q61 mutations are of interest. Q61 mutations in RAS (any isoform) may activate downstream signaling via complete abolition of guanosine triphosphate hydrolysis, as opposed to G12 and G13 mutations, which decrease but do not eliminate it.13 This biochemistry may underpin the greater MAPK scores we find here for Q61 but does not necessarily explain the correlation between higher MAPK activity and poorer outcomes. Murine modeling in melanoma suggests similar increased potency of Q61 mutations,50 and a minimal overexpression model of NRAS Q61 in WT RAS MM cell line (ANBL-6) confirmed increased proliferation with the introduction of this oncogene.51 Further evaluating the effects of NRAS Q61 in myeloma is an intriguing path forward.
In summary, our results reveal the power of extending genomic studies to the dissection of functional changes within tumor cells using both phosphoproteomics and transcriptional data. We propose these findings will have broad implications in both MM precision medicine and the wider study of Ras biology.
Acknowledgments
The authors thank the MMRF for access to the CoMMpass data set and Kevin Shannon, Sandy Wong, Nina Shah, Jeffrey Wolf, and Tom Martin for the insightful discussions.
This work was supported by the Damon Runyon Cancer Research Foundation Dale Frey Breakthrough Award (DFS 14-15), the National Institutes of Health (National Cancer Institute grants K08CA184116 and R01CA226851; and National Institute of General Medical Sciences grant DP2OD022552), and the UCSF Stephen and Nancy Grand Multiple Myeloma Translational Initiative (A.P.W.); the MMRF Answer Fund and the National Institutes of Health (National Cancer Institute grant P30 CA138292) (L.H.B.); and American Cancer Society postdoctoral fellowship PF-17-109-1-TBG (B.G.B.). G.P.W. was supported in part by a training grant from the National Institutes of Health (National Human Genome Research Institute grant T32 HG000046). This work was funded in part by a grant from the Gordon and Betty Moore Foundation (GBMF 4552) (C.S.G.).
Authorship
Contribution: A.P.W. conceptualized the study; Y.-H.T.L., G.P.W., B.G.B., L.H.B., C.S.G., and A.P.W. contributed to methodology; Y.-H.T.L., G.P.W., and B.G.B. contributed to software, data curation, formal analysis, and visualization; Y.-H.T.L., M.C.M., M.M., and I.D.F. contributed to investigation; C.D. provided resources; Y.-H.T.L. and A.P.W. wrote the original draft; G.P.W., B.G.B., L.H.B., and C.S.G. reviewed and edited the manuscript; and C.S.G., L.H.B., and A.P.W. acquired funding.
Conflict-of-interest disclosure: A.P.W. has received past research funding from TeneoBio, Sutro BioPharma, and Quadriga BioSciences and is a member of the scientific advisory board and equity holder of Indapta Therapeutics and Protocol Intelligence. The remaining authors declare no competing financial interests.
The current affiliation for G.P.W. is Imaging Platform, Broad Institute of Harvard and MIT, Cambridge, MA.
Correspondence: Arun P. Wiita, UCSF Department of Laboratory Medicine, 185 Berry St, Suite 290, San Francisco, CA 94107; e-mail: arun.wiita@ucsf.edu.

