

Key Points
Targeted DNAm profiling of MDS patient bone marrow mononuclear cells identifies several distinct DNAm clusters.
Clusters enrich for specific genetic lesions and show differences in survival independent of clinical prognostic scoring systems..

Abstract
Recurrent mutations implicate several epigenetic regulators in the early molecular pathobiology of myelodysplastic syndromes (MDS). We hypothesized that MDS subtypes defined by DNA methylation (DNAm) patterns could enhance our understanding of MDS disease biology and identify patients with convergent epigenetic profiles. Bisulfite padlock probe sequencing was used to measure DNAm of ∼500 000 unique cytosine guanine dinucleotides covering 140 749 nonoverlapping regulatory regions across the genome in bone marrow DNA samples from 141 patients with MDS. Application of a nonnegative matrix factorization (NMF)–based decomposition of DNAm profiles identified 5 consensus clusters described by 5 NMF components as the most stable grouping solution. Each of the 5 NMF components identified by this approach correlated with specific genetic abnormalities and categorized patients into 5 distinct methylation clusters, each largely defined by a single NMF component. Methylation clusters displayed unique differentially methylated regulatory loci enriched for active and bivalent promoters and enhancers. Two clusters were enriched for samples with complex karyotypes, although only one had an increased number of TP53 mutations. Each of the 3 most frequently mutated splicing factors, SF3B1, U2AF1, and SRSF2, was enriched in different clusters. Mutations of ASXL1, EZH2, and RUNX1 were coenriched in the SRSF2-containing cluster. In multivariate analysis, methylation cluster membership remained independently associated with overall survival. Targeted DNAm profiles identify clinically relevant subtypes of MDS not otherwise distinguished by mutations or clinical features. Patients with diverse genetic lesions can converge on common DNAm states with shared pathogenic mechanisms and clinical outcomes.
Introduction
Myelodysplastic syndromes (MDS) are a group of diverse hematologic malignancies caused by accumulation of somatic driver mutations in clonally expanded hematopoietic stem and progenitor cells (HSPCs).1,-3 The progeny of these cells demonstrate impaired myeloid differentiation, resulting in peripheral blood cytopenias, progressive bone marrow failure, and potential progression to acute myeloid leukemia (AML). Genetic lesions are identified in the vast majority of patients with MDS; however, no single mutation profile describes the typical MDS patient.4,5 Instead, a wide variety of mutation profiles appear capable of generating morphologic and clinical features typical of MDS.6 Epigenetic marks, such as DNA methylation (DNAm), are critical for mammalian development and are frequently implicated in oncogenesis.7,8 Somatic mutations in epigenetic regulators are prevalent in more than half of all MDS cases and include genes involved in maintenance of DNAm (eg, TET2 and DNMT3A)9,10 and histone modification (eg, ASXL1 and EZH2).11,12 Epigenetic mutations frequently occur early in MDS pathogenesis,13,14 and aberrant DNAm has been associated with progression to AML.15,-17 MDS patients without mutations in epigenetic regulators can show alterations in their epigenome, suggesting a convergent pathogenic mechanism.18,19 Finally, DNA methyltransferase inhibitors are standard-of-care treatments for certain MDS subtypes because their effects can improve hematopoiesis and prolong overall survival (OS), with associated changes in DNAm and gene expression in responding patients.20,,,,-25 Because DNAm patterns may be influenced by microenvironmental cues and genetic perturbations, we hypothesized that convergent oncogenic states defined by DNAm may represent a useful tool to understand the different pathobiological mechanisms active in MDS.
Prior studies have attributed altered gene expression to DNA promoter hypomethylation in MDS,25,-27 and more recently, to aberrant methylation at more distal regulatory regions, such as enhancers.24,28,,-31 Methylation assays that interrogate genomic regions beyond promoters may better inform which regulatory regions possess biologic importance in the development and progression of MDS. Because the functional relevance of methylation in these regions is not well understood, computational methods that agnostically evaluate DNAm datasets may better classify MDS patients without bias. To characterize biologically relevant features of the MDS methylome, we used a targeted bisulfite padlock probe (BSPP) sequencing method that captures specific nonoverlapping regulatory regions, including differentially methylated regions (DMRs) related to genes involved in pluripotency, differentiation, and cancer,32,,-35 all known promoters for human National Center for Biotechnology Information (NCBI) Reference Sequence genes as well as all microRNA genes, CCCTC–binding factor binding sites, and DNase I hypersensitive regions.36,37 We employed a computational approach called the OncoGenic Positioning System (Onco-GPS) that uses nonnegative matrix factorization (NMF) to decompose a high dimensional methylation matrix into components that serve as inputs for consensus clustering, resulting in classification of patients by shared methylation signatures.38 There are several advantages to this approach over standard clustering of raw methylation values. Standard clustering may disproportionately weight the influence of cytosine guanine dinucleotide (CpG) dense regions with highly correlated methylation levels such as CpG islands, whereas NMF first summarizes highly correlated parts of the data into components before clustering, giving equal weighting for regions of lower CpG density, such as enhancers, that may have comparable or even higher biologic importance. NMF decomposition also produces quantitative component amplitudes for each patient and each component, such that we can determine whether the underlying components used for clustering are associated with any clinical or genetic variables themselves, as a means of validating the biological information contained in the components used for clustering. With standard clustering of raw DNAm values, there is no mechanism for this type of validation.
Here, we report an epigenomic analysis using the BSPP methylation platform and Onco-GPS computational approach of 141 genetically characterized MDS patient samples.1,39 We identify distinct methylation states enriched for specific patterns of somatic mutations, cytogenetic abnormalities, and clinical outcomes, including differences in OS. Our findings suggest that DNAm signatures, similar to genetic mutations and gene expression profiles, may refine our ability to classify and predict clinical outcomes in MDS.
Methods
Patients and samples
A total of 154 patients with treatment-naive MDS were considered for this study. Samples and data from 140 patients were obtained and processed as previously described.1,39,-41 Samples and data from an additional 14 patients were included from the University of California San Diego Moores Cancer Center. All samples were collected with patient consent under protocols approved by institutional review boards and in accordance with the Declaration of Helsinki. Clinical data to determine the Revised International Prognostic Scoring System (IPSS-R) score were available at the time of sample collection.42
Genomic DNA samples were isolated from bone marrow aspirate mononuclear cells, and most were genetically characterized in previous studies.1,39 Samples collected at University of California San Diego were genetically characterized by targeted capture of DNA and sequenced on the Illumina platform. Alignment and variant calling were performed using a custom pipeline, and variant calls were annotated using validated software utilizing databases of known germline and somatic variants (supplemental Methods), followed by confirmation of these variants by manual review.
Generation of BSPP methylomes
BSPP libraries were generated and sequenced using a standard 150-bp paired-end read protocol on Illumina HiSeq 2500. Sequencing reads were trimmed, processed, and aligned as previously described.36,37 CpGs with ≥10× and <500× read coverage were included and summarized into 25-bp tiles by the coverage-weighted average of CpGs within the 25-bp region.43 Filtering and quality control analysis yielded 141 samples covering 246 088 25-bp tiles for our final cohort (supplemental Methods).
Identification of epigenetic subtypes by onco-GPS
NMF was performed on the 3% most variably methylated CpG tiles (n = 7382) to decompose these methylation data into a smaller matrix of NMF components that served as inputs for consensus clustering.38,44 NMF is a feature extraction algorithm that combines similar attributes (in this case, methylation values at collections of CpG loci) into summary components that represent cohesive properties of the data (in this case, localized methylation differences among patients), thus reducing redundancy while maintaining interpretability. The number of NMF components and consensus clusters was selected based on the cophenetic correlation coefficient peak and visual inspection of the clustering result after evaluating different numbers of clusters (supplemental Methods; visual abstract). Unsupervised and consensus hierarchical clustering were also performed on the 3% most variably methylated CpG tiles for comparison.
Differential methylation analysis and genomic annotation
Differential methylation analyses were performed on 25-bp CpG tiles with ≥10× and <500× coverage in >60% of samples in each comparison group, with a minimum of 3 samples per group (R package “MethylSig” version 0.4.4). Differentially methylated CpG tiles were defined as those with false discovery rate (FDR) corrected P < .05 and a mean methylation difference >20% between comparison groups unless otherwise specified.
Analysis of Gerstung et al gene expression microarray data
Gene expression datasets (Affymetrix GeneChip Human Genome U133 Plus 2.0 arrays) and metadata were downloaded from NCBI Gene Expression Omnibus with accession number GSE58831. Probe intensity values were normalized using the “gcrma” R package from Bioconductor, and normalized probe intensities were averaged for genes with >1 probe. Comparison groups for survival analysis in the Gerstung et al data were defined based on the average expression of the given genes.45
Analysis of TCGA LAML RNA-seq and Illumina 450k methylation data
Preprocessed level 3 RNA-seq and Illumina 450k methylation array data for the AML cohort (LAML) were downloaded from the The Cancer Genome Atlas (TCGA) data portal. See figure legends of supplemental Figures 13 and 15 for specific analyses performed.
Statistics
Differences in Kaplan-Meier survival curves were assessed using the log-rank test. Univariate and multivariate models of OS were constructed using Cox proportional hazards regression. Variables with univariate P < .2 were evaluated for inclusion in the final multivariable model, and the final model was constructed using a forward and backward stepwise procedure optimized by the Aikake Information Criterion. Variables with multiple categories (such as IPSS-R categories) were assessed for inclusion in the final multivariable model based on the full variable. An FDR corrected Fisher's exact test was used for all tests of enrichment, including genetic lesions in specific clusters, DMRs within RefSeq genes and chromatin state segments, and gene ontology (GO) terms. GO term enrichment analysis was performed with R package “clusterProfiler” version 3.6.0. Associations between NMF component amplitudes and specific genetic lesions were tested via the information coefficient and an empirical permutation test (n = 100 000 permutations per comparison) to determine statistical significance of the association.46
Results
Patient demographics and clinical features
Of the 154 patient samples selected for methylation profiling, 10 were removed due to insufficient coverage and 3 were removed after being identified as extreme outliers (supplemental Methods), leaving 141 samples in the final cohort. Demographic and clinical information is provided in Table 1 and supplemental Table 1. The median age was 72 years with 103 (73%) men. Forty-eight patients (34%) were known to subsequently receive hypomethylating agent (HMA) therapy. HMA-treated patients had higher IPSS-R risk, higher bone marrow blast percentages, and lower hemoglobin levels. Demographic characteristics of the final cohort were similar to those in previously published studies from which most of these samples were selected.1,39
Patient characteristics
| n (%) | |
|---|---|
| Number of cases | 141 |
| Sex | |
| Male | 103 (73) |
| Female | 38 (27) |
| Age at diagnosis, y | |
| <70 | 55 (39) |
| ≥70 | 86 (61) |
| FAB | |
| RA | 47 (33) |
| RARS | 27 (19) |
| RAEB | 48 (34) |
| RAEBT | 5 (4) |
| RCUD/MD | 4 (3) |
| CMML | 7 (5) |
| Other | 3 (2) |
| IPSS-R* | |
| Very low | 23 (21) |
| Low | 31 (28) |
| Intermediate | 20 (18) |
| High | 24 (21) |
| Very high | 14 (13) |
| Cytogenetics† | |
| Normal | 89 (63) |
| Abnormal, not complex | 41 (29) |
| Complex | 11 (8) |
| Blood counts, median (range) | |
| White blood cell, ×109/L | 3.7 (0.9-95.2) |
| ANC, ×109/L | 1.6 (0.1-28) |
| Hemoglobin, g/dL | 9.7 (5.8-15.2) |
| Platelet, ×109/L | 102 (6-987) |
| Bone marrow blast, %‡ | 1 (0-28) |
| Treatment during follow-up | |
| Azacitidine | 28 (20) |
| Decitabine§ | 20 (14) |
CMML, chronic myelomonocytic leukemia; FAB, French-American-British classification system; RA, refractory anemia; RAEB, refractory anemia with excess blasts; RAEBT, refractory anemia with excess blasts in transformation; RARS, refractory anemia with ring sideroblasts; RCUD/MD, refractory cytopenia with unilineage/multilineage dysplasia.
Twenty-nine patients were missing data for 1 or more variables in the IPSS-R and could not be classified.
Several patients had incomplete cytogenetic information so we stratified them into known groups.
Twenty patients had missing data for bone marrow blast percent; these patients were excluded from survival modeling.
One decitabine treated patient stopped treatment after 1 cycle.
Identification of genetically distinct DNAm subtypes of MDS
To identify coherent subgroups defined by DNAm profiles, we employed the Onco-GPS unsupervised computational clustering approach (schema shown in visual abstract). Repeated NMF decompositions with random seeding resulted in the greatest stability with 5 NMF components, indicated by a peak in the cophenetic correlation coefficient (supplemental Figure 1A). Consensus clustering of patients by the amplitudes of these 5 NMF components resulted in stable clustering solutions (as indicated by the cophenetic correlation) for 4 and 5 patient clusters; however, only the 5-cluster solution provided the most distinct clusters as measured by the average silhouette width (supplemental Figure 1C-F). Subdivisions of <5 clusters yielded groups composed of patient samples with heterogeneous component amplitudes (supplemental Figure 1G-I). The 5-cluster solution yielded clusters composed of samples with high amplitudes for a single component, where each cluster was largely defined by a separate component (Figure 1A-B; supplemental Figure 1). For example, patient samples in cluster A were significantly associated with component 1, but not with any other component. For comparison, we also performed consensus clustering of raw methylation data for the most variably methylated CpG tiles and observed that 5 clusters again provided a similarly stable solution (supplemental Figures 2 and 3).
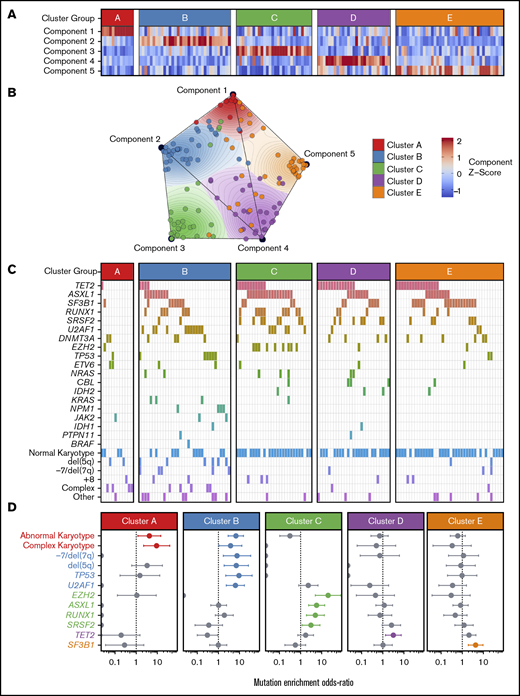
Onco-GPS defined 5 NMF components, which clustered into 5 patient groups with distinct DNAm states. (A) NMF component amplitudes (rows) are plotted for each patient (columns) by methylation cluster membership. (B) A 2-dimensional Onco-GPS map is created based on the NMF components, where each patient is represented by an individual colored dot, and each dot’s location is determined by a 2-dimensional projection of the patient’s 5 component amplitudes. (C) Five methylation clusters categorize patients (columns) with distinct genetic and cytogenetic abnormalities (rows). (D) Odds ratio of enrichment for patients with particular genetic lesions within each methylation cluster. Significantly enriched lesions (P < .05) are highlighted in color.
Onco-GPS defined 5 NMF components, which clustered into 5 patient groups with distinct DNAm states. (A) NMF component amplitudes (rows) are plotted for each patient (columns) by methylation cluster membership. (B) A 2-dimensional Onco-GPS map is created based on the NMF components, where each patient is represented by an individual colored dot, and each dot’s location is determined by a 2-dimensional projection of the patient’s 5 component amplitudes. (C) Five methylation clusters categorize patients (columns) with distinct genetic and cytogenetic abnormalities (rows). (D) Odds ratio of enrichment for patients with particular genetic lesions within each methylation cluster. Significantly enriched lesions (P < .05) are highlighted in color.
Methylation clusters are enriched for distinct patterns of genetic lesions
Each of the 5 methylation clusters was significantly enriched for specific genetic and cytogenetic lesions (Figure 1C-D; supplemental 2). Cytogenetic abnormalities were unequally distributed across clusters, with abnormal and complex karyotype patients enriched in clusters A and B and depleted in clusters C through E (cluster A: complex odds ratio [OR] 9.3, FDR <0.1; cluster B: abnormal OR 7.6, FDR <0.01). Alterations of chromosome 7 (OR 9.4, FDR <0.1) and del(5q) (OR 7.0, FDR <0.1) were enriched in cluster B. Total mutation burden was lowest in cluster A, with a mean of 0.8 mutations per patient compared with a mean of 1.5 to 2 mutations per patient for clusters B through E (Figure 1D; supplemental Table 3). Mutations known to convey adverse risk occurred more frequently in clusters B and C. Cluster B had significant enrichment of mutations in TP53 (OR 9.4, FDR <0.05) and U2AF1 (OR 6.4, FDR <0.01). Cluster C showed enrichment of mutations in EZH2 (OR 20.4, FDR <0.01), ASXL1 (OR 5.8, FDR <0.01), and RUNX1 (OR 5.0, FDR <0.05). The splicing factors were mutually exclusive and found in different clusters, with U2AF1 mutations enriched in cluster B (OR 6.4, FDR <0.01), SRSF2 mutations enriched to a less than significant level in cluster C (OR 3.2, FDR >0.1), and SF3B1 mutations enriched in cluster E (OR 4.4, FDR <0.05). TET2 mutated patients were present in several clusters but uniquely enriched in cluster D (OR 3.2, FDR <0.1).
Methylation components correlate with specific genetic lesions
The enrichment of specific mutations within each methylation cluster appeared to be driven by the association of these mutations with the single NMF component that primarily defined each cluster (Figure 2). For example, although samples with mutations in ASXL1 and RUNX1 were enriched in cluster C (defined primarily by NMF component 3), samples assigned to other clusters with mutations in these same genes also possessed higher NMF component 3 scores (Figure 2B). TET2 mutant samples associated strongly with NMF component 4 and were enriched in cluster D, although TET2 mutant samples assigned to clusters A, B, C, and E also had higher component 4 scores than their wild-type counterparts. Using an information coefficient-based permutation test, we found unique associations between NMF components and genetic lesions (Figure 2; supplemental Figures 4 and 5). The most significant component-mutation associations were for component 3-ASXL1 (IC 0.417, P < .001), component 3-RUNX1 (IC 0.351, P < .001), component 3-EZH2 (IC 0.311, P < .001), and component 4-TET2 (IC 0.394, P < .001). The most prevalent splicing factor mutations were each associated with different NMF components (component 3-SRSF2, IC 0.232, P ≤ .01; component 4-SRSF2, IC 0.262, P ≤ .01; component 2-U2AF1, IC 0.257, P ≤ .01; component 5-SF3B1, IC 0.211, P = .02).
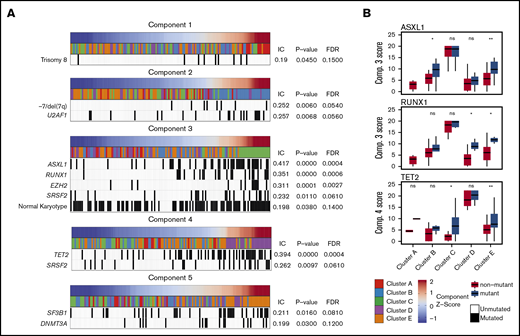
Significant associations are seen between NMF components and specific genetic lesions. Each NMF component is associated with specific genetic lesions, and these genetic profiles are unique with the exception of SRSF2 mutations associated with components 3 and 4. (A) Patient samples (columns) are plotted in order of their component amplitudes (first row, blue to red) with cluster membership (second row, colored tiles) and presence of specific genetic mutations (black tiles). P values and FDRs based on 100 000 permutations. (B) Example of how components 3 and 4 are associated with genetic lesions even in clusters that are more closely associated with different components. Box plots for component scores are plotted by cluster for patients with and without the specific lesion for the 3 most highly associated lesions. *P < .05; **P < .01. IC, information coefficient; ns, not significant.
Significant associations are seen between NMF components and specific genetic lesions. Each NMF component is associated with specific genetic lesions, and these genetic profiles are unique with the exception of SRSF2 mutations associated with components 3 and 4. (A) Patient samples (columns) are plotted in order of their component amplitudes (first row, blue to red) with cluster membership (second row, colored tiles) and presence of specific genetic mutations (black tiles). P values and FDRs based on 100 000 permutations. (B) Example of how components 3 and 4 are associated with genetic lesions even in clusters that are more closely associated with different components. Box plots for component scores are plotted by cluster for patients with and without the specific lesion for the 3 most highly associated lesions. *P < .05; **P < .01. IC, information coefficient; ns, not significant.
Clinical and prognostic significance of epigenetic clusters
Small differences in clinical features were observed between methylation clusters (Figure 3A), including platelet and neutrophil counts. In addition, the median age among cluster A patients was significantly lower at 63 years compared with a median of 72 years for clusters B through E (P = .01). HMA-treated patients were distributed across all clusters with no enrichment by response status (supplemental Figure 6). OS curves for patients in each cluster identified 2 major patterns with those in clusters B and C displaying inferior OS compared with patients in clusters A, D, and E (Figure 3B). We combined clusters with similar median OS into “high” (clusters B and C) and “low” (clusters A, D, and E) cluster risk groups. In univariate analysis, high and low cluster risk groups had statistically significant differences in OS (hazard ratio [HR], 1.95; 95% confidence interval [CI], 1.24-3.08; P < .01) (Table 2; supplemental Table 4). By a multivariate analysis that assessed known prognostic variables in the IPSS-R, DNAm cluster risk group was the most statistically significant single predictor of OS (HR, 2.02; 95% CI 1.25-3.27; P < .01) (Table 2; supplemental Methods). In a second multivariate model that also considered somatic mutations, DNAm cluster risk group remained a significant predictor for OS (HR, 1.6; 95% CI 0.95-2.71 ; P = .08) (Table 2). Notably, methylation cluster risk group was a stronger predictor of OS in IPSS-R lower- vs higher-risk patients and retained prognostic value in HMA-treated patients (supplemental Figures 7 and 8). A subset of patients without known prognostic mutations could also be stratified by methylation cluster risk groups (supplemental Figure 9).1,2,47
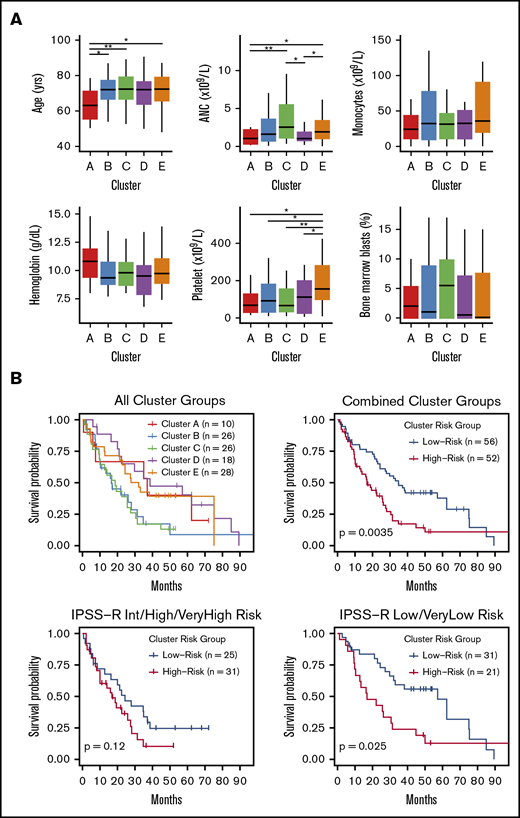
Differences in clinical features and median survival are seen between methylation clusters. (A) Median with ranges (25th to 75th percentiles) are shown for patient age, absolute neutrophil count (ANC), absolute monocyte count, hemoglobin, platelet count, and bone marrow blast percentage. Variables with significant pairwise comparisons between clusters by Wilcoxon rank-sum test are indicated. *P < .05; **P < .01. (B) Kaplan-Meier (KM) curves stratified by methylation cluster are shown for all patients with available survival data (top left). KM curves for combined cluster risk groups are shown, where the “high-risk” patients are those in clusters B and C, and the “low-risk” patients are those in clusters A, D, and E (top right). KM curves for patients with intermediate, high, or very high IPSS-R risk are stratified by cluster risk groups (bottom left), and KM curves for patients with Low or Very low IPSS-R risk are stratified by cluster risk groups (bottom right).
Differences in clinical features and median survival are seen between methylation clusters. (A) Median with ranges (25th to 75th percentiles) are shown for patient age, absolute neutrophil count (ANC), absolute monocyte count, hemoglobin, platelet count, and bone marrow blast percentage. Variables with significant pairwise comparisons between clusters by Wilcoxon rank-sum test are indicated. *P < .05; **P < .01. (B) Kaplan-Meier (KM) curves stratified by methylation cluster are shown for all patients with available survival data (top left). KM curves for combined cluster risk groups are shown, where the “high-risk” patients are those in clusters B and C, and the “low-risk” patients are those in clusters A, D, and E (top right). KM curves for patients with intermediate, high, or very high IPSS-R risk are stratified by cluster risk groups (bottom left), and KM curves for patients with Low or Very low IPSS-R risk are stratified by cluster risk groups (bottom right).
Methylation cluster risk membership retains prognostic significance by multivariate analysis
| Univariable | Multivariable | ||||
|---|---|---|---|---|---|
| n (%) | HR (95% CI) | P* | HR (95% CI) | P* | |
| Model 1: Clinical features and cluster risk retained by multivariable analysis | |||||
| Cluster risk group | |||||
| High vs low | 52 (48) | 1.95 (1.24-3.08) | .003 | 2.02 (1.25-3.27) | .004 |
| Clinical features | |||||
| Karyotype | .13 | ||||
| Abnormal (not complex) vs normal | 33 (31) | 1.35 (0.82-2.24) | .24 | 1.43 (0.85-2.39) | .174 |
| Complex vs normal | 9 (8) | 2.20 (0.93-5.20) | .071 | 2.79 (1.15-6.75) | .023 |
| Bone marrow blasts, % | .014 | ||||
| 5-10 vs <5 | 23 (21) | 2.14 (1.22-3.77) | .008 | 2.18 (1.23-3.86) | .007 |
| 11-30 vs <5 | 23 (21) | 1.77 (1.01-3.09) | .046 | 1.40 (0.79-2.49) | .252 |
| Model 2: Clinical features, somatic mutations, and cluster risk retained by multivariable analysis | |||||
| Cluster risk group | |||||
| High vs low | 52 (48) | 1.95 (1.24-3.08) | .003 | 1.60 (0.95-2.71) | .076 |
| Clinical features | |||||
| Karyotype | .13 | ||||
| Abnormal (not complex) vs normal | 33 (31) | 1.35 (0.82-2.24) | .24 | 1.30 (0.75-2.28) | .353 |
| Complex vs normal | 9 (8) | 2.20 (0.93-5.20) | .071 | 2.91 (1.16-7.28) | .022 |
| Bone marrow blasts, % | .014 | ||||
| 5-10 vs <5 | 23 (21) | 2.14 (1.22-3.77) | .008 | 2.08 (1.16-3.73) | .014 |
| 11-30 vs <5 | 23 (21) | 1.77 (1.01-3.09) | .046 | 1.55 (0.85-2.83) | .15 |
| Somatic mutations | |||||
| RUNX1 mutated vs not mutated | 19 (18) | 2.12 (1.22-3.68) | .008 | 1.97 (1.07-3.64) | .031 |
| EZH2 mutated vs not mutated | 9 (8) | 2.91 (1.37-6.18) | .005 | 2.19 (0.91-5.24) | .079 |
| TP53 mutated vs not mutated | 9 (8) | 3.16 (1.41-7.08) | .005 | 2.40 (0.96-6.01) | .062 |
P values for individual categories within variables were calculated using the Wald test. P values for full variables correspond to a log-rank test. Multivariable models were constructed by optimizing the Aikake Information Criterion, which is why some multivariable P values are <.05.
DMRs between methylation clusters are enriched for distinct HSPC genetic regulatory features
Although the 5 methylation clusters were defined using a subset of the most variably methylated regions, we identified genome-wide methylation patterns associated with each cluster. Cluster-specific DMRs were extracted by comparing members of each cluster with nonmembers at all CpG tiles with sufficient coverage (Figure 4; supplemental Figure 10). DMRs specific to cluster B and cluster D were almost entirely hypermethylated, whereas DMRs specific to cluster C and cluster E were primarily hypomethylated. Cluster A–specific DMRs were composed of both hypermethylated and hypomethylated CpG tiles. We then examined DMRs associated with specific genetic subgroups of patients (supplemental Figures 10B and 11). Few CpG tiles reached the level of significance for defining DMRs in the TET2 mutant vs nonmutant comparison. This was surprising given the association of TET2 inactivation and hypermethylation reported in previous studies,19,24,29,30,48 and we hypothesized that this may have been due to the genetic heterogeneity in groups simply defined by TET2 mutation presence/absence. To address this heterogeneity, we compared patients who carried only a single mutation with patients without that mutation, and in these comparisons, we observed a hypermethylation phenotype in TET2-only mutated patients, in agreement with the literature. We also wondered whether comparing TET2 mutant vs nonmutants with shared cluster membership could more faithfully recapitulate the differences driven by genetics, because patients with shared cluster membership should share similar global DNAm patterns and benefit from lower within-group variance. Comparison of TET2 mutant vs nonmutants within the same cluster yielded zero DMRs across all clusters that had TET2 mutants (supplemental Figure 10B). However, when comparing TET2-mutated patients from 1 cluster with TET2-mutants from other clusters, much larger methylation differences were seen (supplemental Figure 10B), which were consistent with the global differences seen in cluster-specific DMRs. These results highlight the high heterogeneity in DNAm patterns in TET2-mutant MDS and suggest that patients’ DNAm patterns are more strongly influenced by DNAm cluster membership (and patterns of comutations) as opposed to their status as TET2 mutant vs nonmutant.
![Cluster-specific DMRs are enriched for distinct regulatory genome segments in reference CD34+ cell epigenome. Cluster-specific DMRs display distinct enrichment and patterns of differential methylation at epigenetic regulatory segments in a reference hematopoietic stem cell as defined by the chromHMM 15-state genome segmentation model created from integrated epigenetic datasets (Roadmap Consortium). Clusters with significant positive enrichment of DMRs within a given segment are highlighted in light yellow. Enh, enhancer; Transcr., transcribed; TSS, transcription start site; ZNF, zinc finger protein genes; darker colored bars, hypermethylated DMRs; lighter colored bars, hypomethylated DMRs; gray bars, expected counts, which is defined as (number of cluster-specific DMRs) × ([number of CpG tiles within the given genome segment]/[all CpG tiles covered]).](https://ash.silverchair-cdn.com/ash/content_public/journal/bloodadvances/3/19/10.1182_bloodadvances.2019000192/3/m_advancesadv2019000192f4.png?Expires=1767728549&Signature=UoIWw26UX8GqVYGnX2E1b07ehd5LtjAOhB5d0ji3Chtf8KJOf~6Z8V0HHrWLkqI~Qrl1N7n~esIJRVeIfXhm0Fsor-MaFfhzgS3nWdcVb0qW9Ovfuw96FMhkh17FBoC6wDIDWN8T3y7RX2G7st~BHEmUUlSGH-175nTxJzKKNSSqad2x9~RNJsP~uFALT8OAe9xv-Ol4uiqe-OIqAKGZDMptP18HlEyNK6TifXKWOSJTeAoN4BzQPn3EHHHaNsus3MPRngx~fLU8cjKhiiyMi8HQQZ7U5Z4M7Z2-XoLW2rLFf2u9o0HUPE-k3PnUCCbRK7FZDkQjPDSfYy3ZVUEpLQ__&Key-Pair-Id=APKAIE5G5CRDK6RD3PGA)
Cluster-specific DMRs are enriched for distinct regulatory genome segments in reference CD34+ cell epigenome. Cluster-specific DMRs display distinct enrichment and patterns of differential methylation at epigenetic regulatory segments in a reference hematopoietic stem cell as defined by the chromHMM 15-state genome segmentation model created from integrated epigenetic datasets (Roadmap Consortium). Clusters with significant positive enrichment of DMRs within a given segment are highlighted in light yellow. Enh, enhancer; Transcr., transcribed; TSS, transcription start site; ZNF, zinc finger protein genes; darker colored bars, hypermethylated DMRs; lighter colored bars, hypomethylated DMRs; gray bars, expected counts, which is defined as (number of cluster-specific DMRs) × ([number of CpG tiles within the given genome segment]/[all CpG tiles covered]).
Cluster-specific DMRs are enriched for distinct regulatory genome segments in reference CD34+ cell epigenome. Cluster-specific DMRs display distinct enrichment and patterns of differential methylation at epigenetic regulatory segments in a reference hematopoietic stem cell as defined by the chromHMM 15-state genome segmentation model created from integrated epigenetic datasets (Roadmap Consortium). Clusters with significant positive enrichment of DMRs within a given segment are highlighted in light yellow. Enh, enhancer; Transcr., transcribed; TSS, transcription start site; ZNF, zinc finger protein genes; darker colored bars, hypermethylated DMRs; lighter colored bars, hypomethylated DMRs; gray bars, expected counts, which is defined as (number of cluster-specific DMRs) × ([number of CpG tiles within the given genome segment]/[all CpG tiles covered]).
To determine if cluster-specific DMRs occurred more frequently at specific types of genomic regulatory regions, we measured overlap between DMRs and regulatory regions defined in the Roadmap Consortium 15-state chromatin state model for human mobilized CD34+ cells and calculated enrichment of DMRs in each type of chromatin state (Figure 4; supplemental Figure 12).49 Cluster A DMRs were specifically enriched in regions flanking the TSS of genes that are actively transcribed in CD34+ cells, with a trend toward hypermethylation. Clusters C and D DMRs were both highly enriched in states predicted to act as enhancers, with opposing trends in methylation. Clusters B and E DMRs were highly enriched for states predicted to be bivalent promoters and bivalent enhancers.
Differentially methylated genes (DMGs) are enriched in distinct pathways
We next performed GO term enrichment analysis of cluster-specific DMGs and identified enrichment for many ontologies related to T-cell activation and differentiation for cluster A DMGs (Figure 5; supplemental Tables 5 and 6). Cluster B was solely enriched for biological processes related to cell-cell adhesion, largely driven by a region of differential methylation centered on the protocadherin γ gene cluster. Cluster D DMGs were enriched for genes involved in neutrophil mediated immunity. The most significant DMG between clusters was Wilms tumor 1 (WT1), which was hypermethylated in cluster B and hypomethylated in cluster E (Figure 5A-B; supplemental Table 6). The majority of DMRs within WT1 were located in a downstream regulatory region that had high levels of H3K27ac, H3K4me1, and H3K4me3 signal in reference HSPC data, which are considered activating histone marks.50 Patients in our study who had above average methylation in the 2500-bp region downstream of the WT1 TSS had significantly shorter OS (Figure 5C). We then examined WT1 gene expression and survival data from the Gerstung et al study of MDS patients and found that patients with above average expression of WT1 had significantly shorter OS (Figure 5).45 We examined the relationship between methylation and expression of WT1 from an external cohort of 200 patients with AML published by TCGA Research Network51 and found a positive correlation between hypermethylation and increased gene expression at CpG loci that overlapped with our study, suggesting an association between methylation at these sites and gene expression. The next most significant DMG was CD93, which was hypermethylated at a regulatory region surrounding the TSS in our prognostically lower-risk clusters A, D, and E. We observed a trend for improved survival in patients with above average methylation of this regulatory region, whereas gene expression data from Gerstung et al identified a novel and significant association between survival and CD93 expression (supplemental Figure 14). We observed a significant negative correlation between CD93 expression and DNAm in the TCGA cohort (supplemental Figure 15), implying that adverse risk clusters B and C with lower average methylation may have had higher expression that correlates with the survival results observed in the Gerstung et al data.
![DMGs are enriched in distinct pathways and may contribute to prognostic differences between clusters. (A) Gene enrichment for DMRs (y-axis = −log10 [P value] from hypergeometric test of enrichment for DMRs present within a gene ±1 kb, relative to all CpG tiles within a gene; x-axis, mean methylation difference of DMRs within gene ±1 kb). (B) Heat map of average methylation for the most highly DMGs for each set of cluster-specific DMRs (top: samples in columns, genes in rows). WT1 was the most highly DMG for both clusters B and E. Heat map of the average methylation of genes in significantly enriched biological process gene ontologies from GO enrichment analysis of cluster-specific DMGs (bottom: samples in columns, genes in rows; biological process ontology indicated by left panel of heat map). (C) Methylation of cluster-specific differentially methylated CpG tiles within the WT1 gene (second panel). Gray points represent the average methylation of patients in clusters A, C, and D, which all had similar levels of methylation at these loci. Reduced representation bisulfite sequencing (RRBS) methylation as well as H3K27ac, H3K4me3, and H3K4me1 Chip-seq signal tracks correspond to a reference dataset of granulocyte colony-stimulating factor mobilized CD34+ cells from a healthy male donor (third through sixth panels; Roadmap Consortium epigenome E051). Gene model track (top panel) corresponds to isoforms of WT1 found in RefSeq with their corresponding Ensembl IDs. (D) Kaplan-Meier curves for the Gerstung et al 2015 cohort stratified by average WT1 expression (left) and for the present study stratified by average WT1 regulatory region methylation (region ± 2500 bp from TSS) (right).](https://ash.silverchair-cdn.com/ash/content_public/journal/bloodadvances/3/19/10.1182_bloodadvances.2019000192/3/m_advancesadv2019000192f5.png?Expires=1767728549&Signature=KreHr4Gq0rmZoxhhHrSmNGRmPyxG3xw4EOkfPceeGEdwtXpmRCfvcp5Is866ELbbvLIqQDF0pR1Py2xICWR57RRSU1EYPpoOmt0~fx3HZ0J885ikuBsnB9iRBMXIHedLPdBmNHJS5ZdKTlHNX-DLY69oNr4ZLRGsqLPGcgMv9gRdxX-kjOzKfv-yaIigXZIE99Naca0dhrc~S0ouUWUbZkssePSLuRIKVeAaoTX31ea-K4rjIMft5HH4kBxuaybKLAL6Sab9QH6ZIToj53WnbS4odZdlpyoBHDn5cXtAOnHdjZpWzfm6jAIzIlTfGsLpKGq198dFFIBqs6spZMmDyQ__&Key-Pair-Id=APKAIE5G5CRDK6RD3PGA)
DMGs are enriched in distinct pathways and may contribute to prognostic differences between clusters. (A) Gene enrichment for DMRs (y-axis = −log10 [P value] from hypergeometric test of enrichment for DMRs present within a gene ±1 kb, relative to all CpG tiles within a gene; x-axis, mean methylation difference of DMRs within gene ±1 kb). (B) Heat map of average methylation for the most highly DMGs for each set of cluster-specific DMRs (top: samples in columns, genes in rows). WT1 was the most highly DMG for both clusters B and E. Heat map of the average methylation of genes in significantly enriched biological process gene ontologies from GO enrichment analysis of cluster-specific DMGs (bottom: samples in columns, genes in rows; biological process ontology indicated by left panel of heat map). (C) Methylation of cluster-specific differentially methylated CpG tiles within the WT1 gene (second panel). Gray points represent the average methylation of patients in clusters A, C, and D, which all had similar levels of methylation at these loci. Reduced representation bisulfite sequencing (RRBS) methylation as well as H3K27ac, H3K4me3, and H3K4me1 Chip-seq signal tracks correspond to a reference dataset of granulocyte colony-stimulating factor mobilized CD34+ cells from a healthy male donor (third through sixth panels; Roadmap Consortium epigenome E051). Gene model track (top panel) corresponds to isoforms of WT1 found in RefSeq with their corresponding Ensembl IDs. (D) Kaplan-Meier curves for the Gerstung et al 2015 cohort stratified by average WT1 expression (left) and for the present study stratified by average WT1 regulatory region methylation (region ± 2500 bp from TSS) (right).
DMGs are enriched in distinct pathways and may contribute to prognostic differences between clusters. (A) Gene enrichment for DMRs (y-axis = −log10 [P value] from hypergeometric test of enrichment for DMRs present within a gene ±1 kb, relative to all CpG tiles within a gene; x-axis, mean methylation difference of DMRs within gene ±1 kb). (B) Heat map of average methylation for the most highly DMGs for each set of cluster-specific DMRs (top: samples in columns, genes in rows). WT1 was the most highly DMG for both clusters B and E. Heat map of the average methylation of genes in significantly enriched biological process gene ontologies from GO enrichment analysis of cluster-specific DMGs (bottom: samples in columns, genes in rows; biological process ontology indicated by left panel of heat map). (C) Methylation of cluster-specific differentially methylated CpG tiles within the WT1 gene (second panel). Gray points represent the average methylation of patients in clusters A, C, and D, which all had similar levels of methylation at these loci. Reduced representation bisulfite sequencing (RRBS) methylation as well as H3K27ac, H3K4me3, and H3K4me1 Chip-seq signal tracks correspond to a reference dataset of granulocyte colony-stimulating factor mobilized CD34+ cells from a healthy male donor (third through sixth panels; Roadmap Consortium epigenome E051). Gene model track (top panel) corresponds to isoforms of WT1 found in RefSeq with their corresponding Ensembl IDs. (D) Kaplan-Meier curves for the Gerstung et al 2015 cohort stratified by average WT1 expression (left) and for the present study stratified by average WT1 regulatory region methylation (region ± 2500 bp from TSS) (right).
Discussion
In this study, we applied a computational clustering approach based solely on the DNAm profiles of 141 bone marrow DNA samples from patients with MDS to identify subgroups with different DNAm states defined at key regulatory regions of the genome. Using this agnostic approach, 5 methylation subtypes were described that possess unique patterns of enrichment for genetic lesions, differences in regulatory element methylation, and associations with survival that are independent of prognostic clinical variables and somatic mutations. Our results demonstrate that somatic genetics are insufficient to predict the methylation state for a given patient with MDS, and that DNAm profiles may supplement prognostic information in the context of known molecular and clinical variables.
A key conclusion of our study is that in MDS, various mutational profiles can share a common DNAm state even if these states are enriched for specific mutated genes. Somatic mutations alone are not sole determinants of DNAm, which may be integrating additional cues from elements like the microenvironment, differentiation state of cells, or age-related changes. This could reflect preferential selection for mutations in a given preexisting epigenetic state or shared mechanisms engaged by distinct lesions that converge on common epigenetic profiles. For example, we observed that mutually exclusive mutations in EZH2 and SRSF2 were both enriched in cluster C, consistent with studies suggesting these mutations share pathogenic mechanisms.3,52 We also observed that patients with TET2 mutations were distributed to clusters B, C, and E but enriched only in cluster D. In differential methylation analysis comparing TET2 mutants and nonmutants within a single cluster, we found no DMRs. In contrast, when we compared TET2 mutants within a single cluster to TET2 mutants in other clusters, we observed differences in methylation that were consistent with the global differences between clusters, suggesting that TET2-mutant patients can diverge to different epigenetic states, potentially driven by patterns of coincident mutations or other factors, thus suggesting that DNAm differences cannot be attributed simply to particular mutations or cytogenetic abnormalities. These results highlight the heterogeneity in DNAm patterns among TET2 mutant MDS and show that diverse patterns of somatic mutations can converge toward comparable epigenetic states.
Mutations in U2AF1, SRSF2, and SF3B1 are known to occur in a mutually exclusive manner possibly because they are generally not tolerated as coincident lesions or because they may share a common pathogenic mechanism.53,54 In our study, mutations of each of these genes were enriched in separate epigenetic clusters and associated with distinct NMF components, indicating that these mutations drive distinct oncogenic states and likely engage unique pathogenic mechanisms.
Another important finding in our study was the enrichment of cluster-specific DMRs located at distal regulatory regions of the hematopoietic stem cell epigenome. Much of the previous work on DNAm in MDS has focused on CpG-rich promoter regions or LINE elements.48,55,-57 Although we identified DNAm differences at promoters, there were an equal or greater number of differences at nonpromoter regions of the genome. Notably, the TET2-mutated samples enriched in cluster D had the greatest representation of cluster-specific DMRs at enhancer regions as did the loci that defined component 4. These observations are consistent with the putative role of TET2 in maintaining the methylation state at enhancer regions29,30,58,59 and may help explain why a number of studies in AML and MDS have struggled to find clear relationships between TET2 mutations and DNAm.19,24,30,60,-62 Consideration of the underlying oncogenic state may resolve the relative impact of mutations like those in TET2 whose effects may vary in different contexts. The lack of a relationship between DNAm and TET2 mutations across all clusters in our study may be partially explained by the heterogeneous patterns of comutations present in TET2-mutant patients, which may also strongly impact their global methylation patterns (eg, mutations in ASXL1, RUNX1, or EZH2). Overall, our differential methylation analysis demonstrates that the differences in methylation between genetic subgroups were vastly overshadowed by differences driven by methylation cluster membership.
We did not observe significant differences in cytopenias or bone marrow blast percentages across clusters. However, when examining clinical outcomes, we discovered that DNAm clusters had 2 distinct patterns of prognostic risk. Although these OS differences are modest and require independent validation, cluster risk groups retained their prognostic significance even when accounting for somatic mutations and clinical factors included in the IPSS-R. This suggests that additional prognostic information may be integrated by convergent epigenetic states influenced by, but not exclusive to, somatic mutations. In support of this idea, we showed that even among the subset of patients lacking mutations in genes with known prognostic impact, DNAm cluster risk groups could stratify patients by OS. In addition, we identified several genes with significant differential methylation between clusters, including WT1, which may contribute to the prognostic associations we identified. This is consistent with prior work that has associated WT1 expression with poor prognosis in MDS and AML.63,,-66 More novel was the association between shorter OS and CD93 hypomethylation in our cohort and overexpression in an external MDS cohort, because CD93 is a transmembrane receptor implicated in the pathogenesis of several malignancies.67,-69 The role of CD93 in myeloid malignancies is relatively unknown. However, it was shown to be essential to the oncogenic potential of nonquiescent leukemia stem cells in KMT2A-rearranged AML; therefore, this gene may warrant further investigation in MDS.70
Finally, our findings are consistent with those of Shiozawa et al, which identified 2 major subtypes of MDS with differences in genetic lesions and time to transformation to AML using an analogous unsupervised classification approach on gene-expression data from primary MDS CD34+ cells.71 Although a different genomic analysis was used on a more purified cell population, their study similarly concluded that somatic genetics were insufficient to define clinically relevant disease characteristics in MDS. In the 2 groups defined in their study, mutations in TET2 and SF3B1 were enriched in, but not unique to, the subgroup with longer time to AML transformation, while abnormalities in chromosome 7 and mutations in RUNX1 and TP53, among others, were more frequent in the subgroup with shorter time to AML transformation. These findings are consistent with the genetic abnormalities enriched in the 2 cluster risk groups defined by our study, where mutations in TET2 and SF3B1 were solely enriched in our low-risk clusters D and E, whereas chromosome 7 abnormalities and TP53 and RUNX1 mutations were enriched only in our high-risk clusters B and C.
A potential limitation of our study is that although samples were collected from treatment-naive MDS patients, only a subset of patients were known to have later received HMA therapy. Although HMA-treated patients were distributed across all methylation clusters, there was no signal associated with eventual response. Larger methylation profiling studies of MDS patients with known treatment outcomes are ongoing and may increase our ability to incorporate predictive epigenetic and genetic biomarkers into clinical practice.
In conclusion, we demonstrate that using novel computational methods to agnostically classify primary MDS patients by their DNAm patterns can identify subtypes of MDS characterized by distinct patterns of genetic lesions, regulatory region methylation, and prognostic risk. Our results highlight the importance of DNAm in MDS disease biology as a convergent oncogenic phenotype and support future studies investigating DNAm profiles as clinically relevant biomarkers.
The full-text version of this article contains a data supplement.
Acknowledgments
The authors thank Donna Neuberg for her review and suggestions of our prognostic modeling.
This work was supported by National Institutes of Health, National Cancer Institute grants U01-CA217885 (P.T. and H.Y.) and P30-CA023100 (P.T. and H.Y.), National Human Genome Research Institute grant R01-HG009285 (P.T.), and Evans Foundation grants (R.B.). This work was also supported by the American Foundation for Pharmaceutical Education (B.R.).
Authorship
Contribution: B.R., T.N.T., and R.B. designed the study; T.N.T. and D.D. performed sequencing experiments to generate BSPP libraries; B.R. and D.D. performed sequencing data analysis; B.R. and T.N.T. carried out statistical analyses; D.D. and K.Z. contributed vital reagents for BSPP; H.Y. and P.T. contributed to the design and execution of the Onco-GPS analysis; and B.R., T.N.T., and R.B. wrote the manuscript, which was edited by all authors.
Conflict-of-interest disclosure: R.B. has consulted for Celgene, Astex, AbbVie, Daiichi-Sankyo, Forty Seven, and NeoGenomics; received honoraria from Xian-Janssen and Celgene; and received research funding from Calgene and Takeda. The remaining authors declare no competing financial interests.
Correspondence: Rafael Bejar, University of California San Diego Moores Cancer Center, 3855 Health Sciences Dr, MC 0820, La Jolla, CA 92093-0820; e-mail: rabejar@ucsd.edu.

