

Key Points
CRISPR gene editing of blood stem and progenitor cells induces high-efficiency t(9;11) chromosomal translocation and MLLr leukemia.
Gene-edited leukemia analysis documents clonal selection in leukemia progression and similarity of MLLr MPALs to AMLs vs ALLs.

Abstract
Chromosomal rearrangements involving the mixed lineage leukemia (MLL) gene, also known as KMT2A, are often observed in human leukemias and are generally associated with a poor prognosis. To model these leukemias, we applied clustered regularly interspaced short palindromic repeats (CRISPR)/Cas9 gene editing to induce MLL chromosomal rearrangements in human hematopoietic stem and progenitor cells purified from umbilical cord blood. Electroporation of ribonucleoprotein complexes containing chemically modified synthetic single guide RNAs and purified Cas9 protein induced translocations between chromosomes 9 and 11 [t(9;11)] at an efficiency >1%. Transplantation of gene-edited cells into immune-compromised mice rapidly induced acute leukemias of different lineages and often with multiclonal origins dictated by the duration of in vitro culture prior to transplantation. Breakpoint junction sequences served as biomarkers to monitor clonal selection and progression in culture and in vivo. High-dimensional cell surface and intracellular protein analysis by mass cytometry (CyTOF) revealed that gene-edited leukemias recapitulated disease-specific protein expression observed in human patients and showed that MLL-rearranged (MLLr) mixed phenotype acute leukemias (MPALs) were more similar to acute myeloid leukemias (AMLs) than to acute lymphoblastic leukemias (ALLs). Therefore, highly efficient generation of MLL chromosomal translocations in primary human blood stem cells using CRISPR/Cas9 reliably models human acute MLLr leukemia and provides an experimental platform for basic and translational studies of leukemia biology and therapeutics.
Introduction
Chromosomal translocations involving the mixed lineage leukemia (MLL) gene, also known as KMT2A, are present in a diverse group of acute leukemias, including acute myelogenous leukemias (AMLs), acute lymphoblastic leukemias (ALLs), and mixed phenotype acute leukemias (MPALs), that are generally associated with a poor prognosis. Translocations recombine the MLL gene with a multitude of partner loci at different chromosome sites to generate a diverse array of fusion proteins with crucial roles in leukemia pathogenesis.1,-3
Animal models of MLL-rearranged (MLLr) leukemias have been developed using various technologies.4 Studies using these models have enhanced our understanding of the pathogenesis underlying MLLr leukemias and facilitated preclinical development of novel therapeutic approaches. However, none of the models fully recapitulates the pathogenic features of the respective human diseases.4,,,-8 Genome-editing technologies have recently been applied to model human diseases caused by gene mutations and chromosomal translocations. In previous studies, we used transcription activator-like effector nucleases (TALENs) to induce translocations between chromosomes 9 and 11 [t(9;11)] in primary human hematopoietic stem and progenitor cells (HSPCs) and generated MLLr cells expressing endogenous levels of MLL-AF9 and reciprocal AF9-MLL fusion genes.9 Xenoengraftment of MLLr cells led to AML in mice after long latencies.9 However, the low efficiency of the method to induce chromosomal translocations required prolonged in vitro culture to generate sufficient numbers of MLLr cells for transplant studies,9 which yielded exclusively myeloid lineage leukemias.
Here, we demonstrate high-efficiency genome editing utilizing clustered regularly interspaced short palindromic repeats (CRISPR)/Cas9 to induce chromosomal translocations between the MLL and AF9 genes at a frequency > 1% in human HSPCs. MLLr cells showed growth advantages and clonal expansion and rapidly developed acute leukemias of different phenotypes. Single-cell mass cytometry (CyTOF) phenotyping revealed that xenograft leukemias displayed disease- and lineage-specific protein expressions that were characteristic of human MLLr leukemia patients and showed that MPALs with MLL rearrangement were more similar to AMLs than to ALLs. Thus, genome editing mediated by multiplexed CRISPR/Cas9 enables high-efficiency generation of human MLLr leukemias in primary human HSPCs and provides a powerful approach for modeling diseases induced by chromosomal translocations.
Materials and methods
Human CD34+ HSPCs
Fresh human umbilical cord blood (hUCB) was obtained from Stanford Hospital via the Binns Program for Cord Blood Research under informed consent. CD34+ cells were isolated using a human CD34 MicroBead Kit (Miltenyi Biotec, San Diego, CA) and cultured for 2 days in serum-free StemSpan SFEM II medium (STEMCELL TECHNOLOGIES, Vancouver, BC, Canada) supplemented with cytokines (PeproTech, Rocky Hill, NJ) stem cell factor (100 ng/mL), thrombopoietin (100 ng/mL), Flt3 ligand (100 ng/mL), interleukin-6 (IL-6; 100 ng/mL), UM171 (35 nM; STEMCELL Technologies), and StemRegenin 1 (0.75 µM; Cayman Chemical, Ann Arbor, MI) at 37°C, 5% CO2, and 5% O2. Following nucleofection, cells were cultured in StemSpan SFEM II medium with stem cell factor (50 ng/mL), thrombopoietin (100 ng/mL), Flt3 ligand (100 ng/mL), IL-6 (100 ng/mL), IL-3 (50 ng/mL), granulocyte colony-stimulating factor (50 ng/mL), UM729 (0.75 µM; Selleckchem, Houston, TX), StemRegenin 1 (0.75 µM), and 20% fetal bovine serum at 37°C, 5% CO2, and 5% O2. Z-VAD-FMK (20 µM; Enzo Life Sciences, Farmingdale, NY) and Thiazovivin (2 µM; Selleckchem) were added for 2 days.
CRISPR/Cas9 genome editing
Single guide RNAs (sgRNAs) were designed using Web-based programs (http://crispr.mit.edu/guides/ and https://www.dna20.com/eCommerce/cas9/input [currently https://www.atum.bio/eCommerce/cas9/input]) and cloned into pX458 (Addgene plasmid #48138). sgRNA sequences (supplemental Table 1) with the best genome-editing efficiencies in HEK293T cells were synthesized with chemical modifications (2′-O-methyl analogs and 3′-phosphorothioate internucleotide linkages of the 5′- and 3′-terminal 3 nucleotides; Synthego, Redwood City, CA). Modified synthetic sgRNAs (120 or 200 pmol) were incubated with 40 pmol of purified Cas9-3NLS (Integrated DNA Technologies, Coralville, IA) for 15 minutes at room temperature prior to electroporation. The ribonucleoprotein (RNP) complex was mixed with 200 000 CD34+ HSPCs in 20 μL of nucleofection solution and electroporated using a 4D Nucleofector with program DZ-100 (Lonza, Basel, Switzerland), as previously described.10 Genome-editing efficiency was assessed by T7 endonuclease assay11 and TIDE assay (https://tide.nki.nl/).12
Chromosomal translocations and fusion gene products
Genomic DNA (150-200 ng) was used as a template to amplify MLL-AF9 and AF9-MLL breakpoint junctions. PCR amplicons were recovered using a Qiagen kit and cloned into pGEM-T Easy Vector (Promega, Madison, WI) for sequencing (MCLAB, South San Francisco, CA).
RNA was isolated using an RNeasy Mini Kit (Qiagen, Hilden, Germany). Complementary DNAs (cDNAs) were generated using the SuperScript III First-Strand Synthesis System (Invitrogen) and subjected to polymerase chain reaction (PCR) for detection of MLL-AF9 and AF9-MLL fusion transcripts using specific primers (supplemental Table 1).
MLL-AF9 fusion and MLL wild-type proteins were fractionated in 4% to 15% TGX gradient gels (Bio-Rad, Hercules, CA) and visualized by western blot using anti-MLL antibody (D2M7U; Cell Signaling Technologies, Danvers, MA). Anti-GAPDH antibody (G9545; Sigma-Aldrich, St. Louis, MO) was used as loading control.
Fluorescence in situ hybridization (FISH) and karyotyping were performed by the Cytogenetics Laboratory of Stanford Hospital, as previously described.9
Digital Droplet PCR (ddPCR; Bio-Rad) was carried out on genomic DNA extracted using a DNeasy Blood & Tissue Kit (Qiagen) and digested using 20 U EcoRV-HF (NEB) in CutSmart buffer at 37°C for 1 hour. ddPCR reaction contained 1× reference primer/probe mix synthesized at a 3.6 ratio (900 nM primer/250 nM FAM or HEX-labeled probe), 1× ddPCR Supermix for Probes (No dUTP), 50 ng of digested DNA, and water for a total volume of 25 μL. MLL-AF9 ddPCR translocation HEX-labeled amplicon of 249 bp and MLL reference FAM-labeled amplicon of 248 bp were generated using the primers and probes listed in supplemental Table 1. ddPCR reaction was carried out as per the Bio-Rad protocol at melting temperature shown in supplemental Methods.
Xenograft transplantation and models
Nucleofected cells were harvested from in vitro cultures and transplanted into sublethally irradiated (250 cGy) immune-compromised NOD.Cg-PrkdcscidIL2rgtm1Wjl/SzJ (NSG) mice by IV injection. Human leukemia and normal bone marrow (BM) cells were obtained from patients at the Stanford Medical Center and Lucile Packard Children’s Hospital with informed consent and institutional review board approval. All experiments using mice were performed with the approval of, and in accordance with, the Stanford University Administrative Panel on Laboratory Animal Care.
Mass cytometry (CyTOF)
Samples for CyTOF were prepared as described.13 Viably frozen cells were thawed, resuspended at 1 to 2 million cells per milliliter, and fixed in 1.6% paraformaldehyde for 10 minutes at room temperature. Cell Staining Medium (phosphate-buffered saline [PBS] + 0.5% bovine serum albumin + 0.02% sodium azide), PBS, and 0.02% saponin in PBS were used to wash cells. 20-Plex barcoding reagent was diluted in PBS + 0.02% saponin and then added to cells. Barcoded cells were combined in a single tube and resuspended to ∼2 to 3 million cells per mL. Human TruStain FcX blocking solution was added to the cells at 5 μL/100 μL staining volume. Metal-conjugated antibodies to surface antigens were added to the cells at titrated concentrations and incubated with shaking for 30 minutes. Cells were permeabilized in 100% methanol for 10 minutes at 4°C, washed, incubated with metal-conjugated antibodies against intracellular antigens, and iridium intercalated for cell identification. Prior to acquisition on a Helios instrument, cells were washed once in Cell Staining Medium, followed by twice in ultrapure double-distilled H2O. Throughout the analysis, cells were maintained at 4°C and introduced at a rate of ∼300 cells per second. Detailed methods for CyTOF data analysis are available in supplemental Methods.
Results
Induction of t(9;11) chromosomal translocations encoding MLL-AF9 fusion genes by CRISPR/Cas9 gene editing
A genome-editing approach using multiplexed CRISPR/Cas914,-16 was used to generate MLL chromosomal translocations in primary human HSPCs. sgRNAs targeting the intronic regions of the MLL and AF9 genes where frequent chromosomal translocation breakpoints occur on chromosomes 11 and 9, respectively, in human MLLr leukemias,17 were initially cloned into Cas9 expression plasmids and screened for genome-editing efficiencies in HEK293T cells (supplemental Figure 1A-B). The most efficient sgRNAs were synthesized with chemical modification, and each was incubated with purified Cas9 protein to form Cas9-sgRNA RNP complexes.10,14 Electroporation of the RNPs into HSPCs showed high-efficiency genome editing on their respective target sites, with indel frequencies of 84% to 92% at MLL and 48% at AF9 when each guide was used separately (supplemental Figure 1C-D).
To induce t(9,11) chromosomal translocations, HSPCs (2 × 10⁵) were electroporated with RNP complexes targeting the MLL and AF9 loci simultaneously, followed by culture in vitro. The formation of MLL-AF9 and reciprocal AF9-MLL fusion genes was detected by PCR in every culture of cells treated with RNP complexes vs none in Cas9 protein–treated controls (Figure 1A). DNA sequences of PCR amplicons at posttreatment day 31 showed that each culture contained multiple clonal sequences marked by variations (single nucleotide variants, indels) at the sites of MLL-AF9 and the reciprocal AF9-MLL fusions (Figure 1B). Karyotyping at culture day 41 confirmed the presence of balanced t(9;11) chromosomal translocations (Figure 1C), and FISH analysis showed MLL probe break apart (Figure 1D). The reproducible induction of t(9;11) was confirmed in 4 independent experiments, and MLL gene break apart was detected in nearly all cells by culture day 41 (supplemental Figure 2).
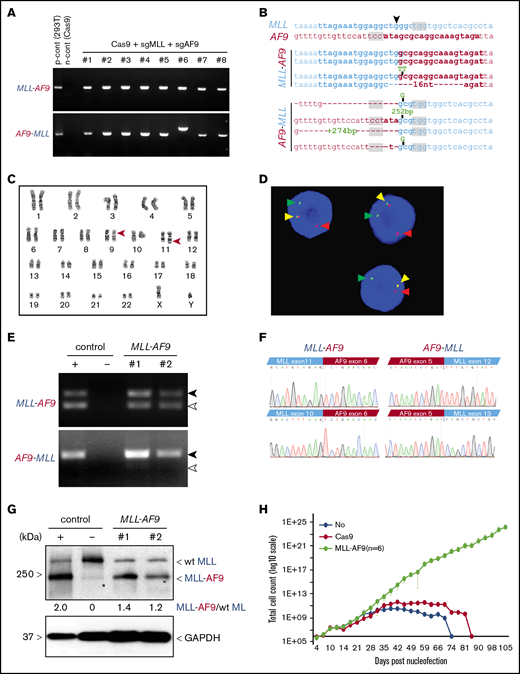
Induction of t(9;11) chromosomal translocations encoding MLL-AF9 fusion genes by CRISPR/Cas9 gene editing. (A) PCR amplification products for MLL-AF9 (upper panel) and AF9-MLL (lower panel) junction regions in genomic DNA harvested from genome-edited cells at day 31 of posttreatment culture. (B) Genomic DNA sequences of MLL-AF9 and AF9-MLL junctions in edited cells. sgRNA and PAM sequences are denoted by bold type and gray shading, respectively. ▼, Cas9 cutting position. (C) Karyotype analysis at day 41 of culture shows balanced t(9;11) translocation (red arrowheads). (D) FISH analysis of cells at day 41 of culture for MLL translocation using MLL break-apart probes. Red and green arrowheads indicate the split signals of the break-apart probe indicating MLL translocation. Yellow arrowheads represent nontranslocated MLL gene. (E) Expression of MLL-AF9 and reciprocal AF9-MLL transcripts (black arrowheads) were detected by RT-PCR on cDNA from 2 independent MLLr cell cultures (day 59). TALEN-induced MLLr cells9 and Cas9-treated human HSPCs are positive and negative controls, respectively. Exon skipping at MLL exon 11 in MLL-AF9 and at MLL exon 12 in AF9-MLL are indicated (white arrowheads). (F) cDNA sequences of MLL-AF9 junctions (upper left panel) and AF9-MLL junctions (upper right panel) in gene-edited cells. Exon-skipping at MLL exon 11 and exon 12 in MLL-AF9 and AF9-MLL, respectively (lower panels). (G) MLL-AF9 fusion proteins are visualized by western blot using anti-MLL antibody. Positive and negative controls are the same as in panel E. Wild-type (wt) MLL and MLL-AF9 proteins are indicated. GAPDH was used for loading control. *, nonspecific band. (H) Representative growth curves for MLLr cells compared with Cas9-alone nucleofection or HSPCs lacking CRISPR treatment. The average cell counts of 6 MLLr cell cultures are displayed. Error bars indicate 95% confidence intervals.
Induction of t(9;11) chromosomal translocations encoding MLL-AF9 fusion genes by CRISPR/Cas9 gene editing. (A) PCR amplification products for MLL-AF9 (upper panel) and AF9-MLL (lower panel) junction regions in genomic DNA harvested from genome-edited cells at day 31 of posttreatment culture. (B) Genomic DNA sequences of MLL-AF9 and AF9-MLL junctions in edited cells. sgRNA and PAM sequences are denoted by bold type and gray shading, respectively. ▼, Cas9 cutting position. (C) Karyotype analysis at day 41 of culture shows balanced t(9;11) translocation (red arrowheads). (D) FISH analysis of cells at day 41 of culture for MLL translocation using MLL break-apart probes. Red and green arrowheads indicate the split signals of the break-apart probe indicating MLL translocation. Yellow arrowheads represent nontranslocated MLL gene. (E) Expression of MLL-AF9 and reciprocal AF9-MLL transcripts (black arrowheads) were detected by RT-PCR on cDNA from 2 independent MLLr cell cultures (day 59). TALEN-induced MLLr cells9 and Cas9-treated human HSPCs are positive and negative controls, respectively. Exon skipping at MLL exon 11 in MLL-AF9 and at MLL exon 12 in AF9-MLL are indicated (white arrowheads). (F) cDNA sequences of MLL-AF9 junctions (upper left panel) and AF9-MLL junctions (upper right panel) in gene-edited cells. Exon-skipping at MLL exon 11 and exon 12 in MLL-AF9 and AF9-MLL, respectively (lower panels). (G) MLL-AF9 fusion proteins are visualized by western blot using anti-MLL antibody. Positive and negative controls are the same as in panel E. Wild-type (wt) MLL and MLL-AF9 proteins are indicated. GAPDH was used for loading control. *, nonspecific band. (H) Representative growth curves for MLLr cells compared with Cas9-alone nucleofection or HSPCs lacking CRISPR treatment. The average cell counts of 6 MLLr cell cultures are displayed. Error bars indicate 95% confidence intervals.
Cultured gene-edited cells showed expression of MLL-AF9 and AF9-MLL fusion transcripts by reverse-transcriptase PCR (RT-PCR) analysis (Figure 1E) and the presence of MLL-AF9 fusion protein by western blot analysis (Figure 1F). MLL-AF9 and AF9-MLL fusion transcripts were in-frame, as confirmed by sequencing of cDNA (Figure 1F). Occasional MLL exon skipping, comparable to that observed in human leukemia cell lines, was detected in both fusion transcripts (Figure 1E-F). ddPCR confirmed the formation of MLL-AF9 fusion genes (supplemental Figure 3), with fusion amplicons displaying ∼50% abundance compared with the MLL amplicon from cells at culture day 48 (supplemental Figure 3C). Because the MLL-AF9 fusion protein is expressed together with wild-type MLL (Figure 1F), this result again suggested that nearly 100% of cells contained heterozygous MLL-AF9 rearrangement, consistent with the karyotype and FISH analyses showing single t(9;11) translocations per cell (Figure 1C-D). In addition, clonal analysis supported a correlation between the clone size based on unique MLL-AF9 and AF9-MLL junction sequences, consistent with balanced translocations and simultaneous generation of MLL-AF9 and AF9-MLL genes (supplemental Figure 2B).
MLLr cells displayed a substantial growth advantage in liquid medium (Figure 1H) and clonal expansion in semisolid medium (supplemental Figure 4) consistent with, but more accelerated than, our previous study.9 Taken together, these data indicate that t(9;11) chromosomal translocations encoding MLL-AF9 fusion genes are generated reproducibly in human HSPCs by CRISPR/Cas9 RNP complexes.
High-efficiency induction of t(9;11) translocations by gene editing
To assess the efficiency for generating t(9;11) by CRISPR/Cas9, serial dilution experiments were performed on primary HSPCs immediately following RNP electroporation (Figure 2A). After 10-fold serial dilutions and expansion in culture for 2 weeks, PCR analysis showed the presence of MLL-AF9 and AF9-MLL fusion DNAs in 4 independent cultures initiated with 200 RNP-treated cells but not in those initiated with fewer treated cells (Figure 2B-C). DNA sequencing of the PCR amplicons in cultures initiated with 200 RNP-treated cells consistently revealed 1 or 2 unique fusion sequences (Figure 2D). These results suggested that CRISPR/Cas9 gene editing under our conditions generally induces t(9;11) chromosomal translocations at a frequency of ∼0.5% to 1% in primary human HSPCs, assuming that each unique fusion sequence represents a clone.
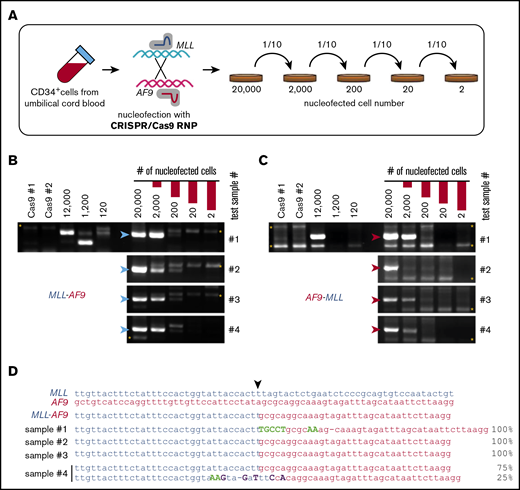
High-efficiency induction of t(9;11) chromosomal translocations. (A) Schematic summary of serial dilution experiment to assess the efficiency of creating t(9;11) translocations by CRISPR/Cas9 gene editing. Immediately after CRISPR/Cas9 treatment, electroporated cells were serially diluted into control electroporated cells (without Cas9 or sgRNAs) to a total of 20 000 cells. The serially diluted cells were cultured for 14 days, and genomic DNAs were extracted for PCR. PCR amplification of genomic DNA (200-ng template) shows genomic junctions for MLL-AF9 (B; blue arrowheads) and AF9-MLL (C; red arrowheads). *, nonspecific bands. (D) Sanger sequencing results for PCR amplicons from 4 cultures initiated with 200 CRISPR/Cas9-treated cells. ▼, Cas9 cutting position.
High-efficiency induction of t(9;11) chromosomal translocations. (A) Schematic summary of serial dilution experiment to assess the efficiency of creating t(9;11) translocations by CRISPR/Cas9 gene editing. Immediately after CRISPR/Cas9 treatment, electroporated cells were serially diluted into control electroporated cells (without Cas9 or sgRNAs) to a total of 20 000 cells. The serially diluted cells were cultured for 14 days, and genomic DNAs were extracted for PCR. PCR amplification of genomic DNA (200-ng template) shows genomic junctions for MLL-AF9 (B; blue arrowheads) and AF9-MLL (C; red arrowheads). *, nonspecific bands. (D) Sanger sequencing results for PCR amplicons from 4 cultures initiated with 200 CRISPR/Cas9-treated cells. ▼, Cas9 cutting position.
Clonal tracking reveals selection of MLL-AF9 gene-edited HSPCs in vitro
Sequence variations at translocation breakpoint junctions provided a biomarker to trace the clonal history of individual MLL-AF9 gene-edited cells after chromosome rearrangement. To test this, HSPCs were seeded into separate cultures (2 × 10⁴ cells each) immediately following electroporation and maintained independently. Clonal compositions of the 10 respective cultures were determined by Sanger sequencing of MLL-AF9 junction DNA at days 11, 35, 54, and 75 (supplemental Figure 5). At day 11, each culture generally contained a constellation of 2 to 7 clones defined by their unique DNA sequences. At later time points, the clonal complexity typically decreased, with dominance of 1 or more clones commonly observed at day 75 accompanied by loss of other clones originally present at day 11. In some cases, the dominant clone at day 75 was not detected at early time points (supplemental Figure 5). The observed clonal variability did not appear to be driven by specific MLL-AF9 translocation breakpoint junctions (supplemental Figure 5B-C). The results illustrate the usefulness of gene-edited breakpoint junctions as clonal biomarkers and demonstrate clonal evolution in response to undefined selective factors under our culture conditions.
Gene-edited t(9;11) cells induce acute leukemias of different lineages
To test leukemogenic potential, gene-edited cells at 11 days of culture were transplanted into sublethally irradiated NSG mice by IV injection (2 × 10⁶ cells per mouse representing ∼2 × 10⁴ translocated cells). Engraftment was observed in 7 of 11 (64%) mice, of which 6 (86%) developed disease symptoms with a median latency ∼ 251 days (n = 6; Figure 3A). Mice displayed splenomegaly (Figure 3B) and anemic BM (Figure 3C), with leukemic blasts present in the peripheral blood, BM (Figure 3D), and various tissues (Figure 3E). Flow cytometry showed diverse leukemia phenotypes characteristic of ALL, AML, or MPAL (supplemental Figure 6A). Leukemia lineage and disease features were conserved in secondary transplant recipients (supplemental Figure 6A), recapitulating primary disease but with accelerated onset (Figure 3A; supplemental Figure 6B). In contrast to the oligoclonal compositions of transplanted cell populations, primary leukemias contained monoclonal MLL-AF9 fusion sequences that were maintained in secondary and tertiary recipients (supplemental Figure 7), indicating clonal selection in xenografted mice.
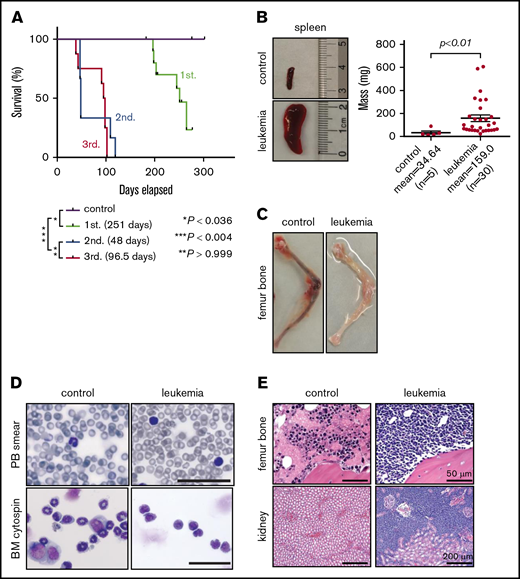
Gene-edited MLLr hUCB cells develop leukemia in xenotransplanted mice. (A) Survival curves for xenotransplanted mice with mean latencies for development of primary (1st.), secondary (2nd.), and tertiary leukemias (3rd.) of 251, 48, and 96.5 days, respectively. Latencies and P values were determined using the log-rank test. Leukemic involvement of spleen (B), leg bones (C), peripheral blood (PB) (D; upper panels), and BM (D; lower panels, Giemsa stain). Scale bars, 100 μm. (E) Hematoxylin and eosin–stained sections of the indicated tissues from control and leukemic mice.
Gene-edited MLLr hUCB cells develop leukemia in xenotransplanted mice. (A) Survival curves for xenotransplanted mice with mean latencies for development of primary (1st.), secondary (2nd.), and tertiary leukemias (3rd.) of 251, 48, and 96.5 days, respectively. Latencies and P values were determined using the log-rank test. Leukemic involvement of spleen (B), leg bones (C), peripheral blood (PB) (D; upper panels), and BM (D; lower panels, Giemsa stain). Scale bars, 100 μm. (E) Hematoxylin and eosin–stained sections of the indicated tissues from control and leukemic mice.
RT-PCR analyses revealed that in-frame MLL-AF9 and AF9-MLL fusion gene transcripts were expressed and contained occasional MLL exon skipping, as seen in the gene-edited cultured cells prior to transplant (Figure 1E-F; supplemental Figure 8A). Furthermore, MLL target genes (MEIS1, HOXA6, HOXA9, and HOXA10) were upregulated in gene-edited leukemic BM cells compared with mouse BM engrafted human control cells (supplemental Figure 8B), confirming the functionality of the MLL-AF9 fusion gene product. Taken together, these data demonstrate the leukemic potential of HSPCs bearing t(9;11) chromosomal translocations generated by CRISPR/Cas9 gene editing.
In vitro culture of gene-edited HSPCs modulates leukemia pathology
To assess the possible influence of culture conditions on leukemia pathology,5,18 HSPCs were transplanted at different times of culture following CRISPR/Cas9 gene editing. Transplant at 14 days modestly increased leukemia latency (275 days) compared with 11 days’ culture (251 days), but it did not substantially alter the resulting leukemia lineages of primarily AMLs and MPALs (Figure 4A-B; Table 1; supplemental Table 2). Conversely, transplant at day 5 following gene editing markedly shortened leukemia latency (110 days) and increased penetrance to 100% (Figure 4A; Table 1). Notably, 6 of 8 mice had bilineage leukemias, with the concurrent presence of an AML and an ALL in the same mouse (Figure 4B; Table 1; supplemental Table 2), which was not seen with longer culture times. Flow cytometry showed that the relative ratios of ALL cells/AML cells in the bilineage leukemias differed in each tissue (Figure 4C, left panel), suggesting independent leukemias at each site. To assess their clonal relationships, human cells of the lymphoid or myeloid lineage from various tissues were isolated by fluorescence-activated cell sorting and analyzed for translocation breakpoint junctions (Figure 4C, right panel). Different breakpoint sequences were present in myeloid vs lymphoid leukemia cells (Figure 4C, right panel) demonstrating their clonal unrelatedness. Furthermore, multiple breakpoint sequences were detected in leukemia cells of the same lineage (Figure 4C, right panel), indicating the presence of multiple clonally distinct leukemias in the same host following transplantation of HSPCs within 5 days of gene editing. These data further demonstrate the high efficiency of CRISPR/Cas9 gene editing for induction of t(9;11)-bearing acute leukemias whose pathologic features are rapidly modulated under our culture conditions.
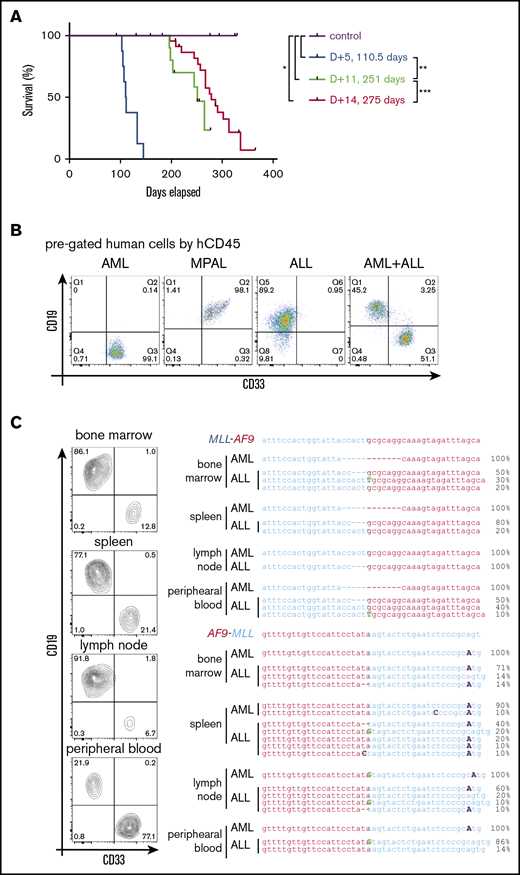
The length of in vitro culture influences leukemia development in vivo. (A) Survival curves for mice transplanted with gene-edited MLLr cells cultured for different times in vitro prior to transplant. (B) Flow cytometry analysis of BM cells in leukemic mice for myeloid (CD33) and lymphoid (CD19) lineage markers. (C) Flow cytometry analysis (left panel) of tissues from a representative leukemic mouse and their corresponding MLL-AF9 and AF9-MLL junctions (right panel), as determined by Sanger sequencing of DNA isolated from the indicated respective tissues. *P < .0358, **P < .0001, ***P < .0440, log-rank test.
The length of in vitro culture influences leukemia development in vivo. (A) Survival curves for mice transplanted with gene-edited MLLr cells cultured for different times in vitro prior to transplant. (B) Flow cytometry analysis of BM cells in leukemic mice for myeloid (CD33) and lymphoid (CD19) lineage markers. (C) Flow cytometry analysis (left panel) of tissues from a representative leukemic mouse and their corresponding MLL-AF9 and AF9-MLL junctions (right panel), as determined by Sanger sequencing of DNA isolated from the indicated respective tissues. *P < .0358, **P < .0001, ***P < .0440, log-rank test.
Summarized analysis of xenotransplanted mice
| In vitro culture days | No. engrafted/no. injected (%) | No. leukemia/no. engrafted (%) | AML, n/N (%) | MPAL, n/N (%) | ALL, n/N (%) | AML+ALL, n/N (%) |
|---|---|---|---|---|---|---|
| D+5 | 8/8 (100) | 8/8 (100) | 0/8 (0) | 1/8 (12.5) | 1/8 (12.5) | 6/8 (75) |
| D+11 | 7/11 (63.6) | 6/7 (85.7) | 2/6 (33.3) | 3/6 (50) | 1/6 (16.7) | 0/6 (0) |
| D+14 | 19/23 (82.6) | 17/19 (89.5) | 9/17 (52.9) | 8/17 (47.1) | 0/17 (0) | 0/17 (0) |
Leukemias induced by gene editing recapitulate features of patient MLLr leukemias
To assess the similarities of leukemias induced by gene editing with their human patient counterparts, the expression of various cell surface and intracellular signaling molecules was assessed by single-cell mass cytometry (CyTOF).13 Gene-edited AMLs and ALLs displayed increased expression of myeloid and lymphoid lineage markers, respectively, compared to control human cells electroporated with Cas9 protein (Figure 5A), and were similar in their protein expression to human AML or ALL patient samples. Notably, MPALs arising from gene-edited HSPCs showed protein expression patterns that were very similar to MLLr AMLs (Figure 5A). B-lineage markers were upregulated in patient and gene-edited ALLs, whereas signaling molecules and transcription factors highly expressed in human patient AMLs (primary and patient-derived xenograft) were expressed predominantly in AML and MPAL gene-edited leukemias compared with xenograft controls and MLLr ALLs.
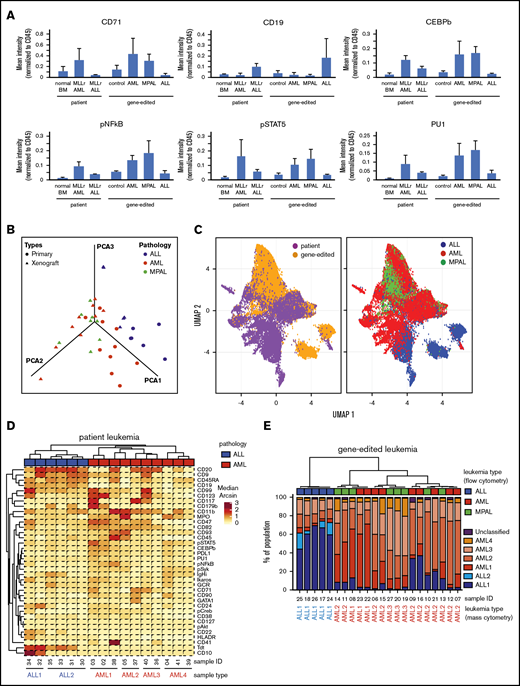
High-dimensional phenotype analysis of leukemias induced by gene-edited HSPCs. (A) Bar graphs summarize protein levels, as determined by CyTOF analysis of human patient MLLr leukemias and gene-edited leukemias. Control, Cas9-only treated human cells engrafted in mouse BM. (B) PCA plot shows the effective separation of patient leukemias into AML vs ALL lineages and a comparable separation in gene-edited leukemias. MPALs show overlapped clustering with AMLs. (C) UMAP plots show that the distributions of individual leukemia cells depend on the sample origins (left panel) and lineage phenotypes (right panel). Patient and gene-edited ALL cells reside mostly UMAP2 < 0, whereas patient AMLs, gene-edited AMLs, and MPALs cells reside UMAP2 > 0. (D) Hierarchical clustering of patient ALLs and AMLs based on their median protein expression. Two ALL and 4 AML reference groups are indicated at the bottom. Diagnostic phenotypes of patient leukemia samples are indicated on top of the heat map. (E) Hierarchical clustering of the percentage of cells in each sample associated with patient ALL and AML reference groups. The 6 colors represent the 2 ALL and 4 AML reference groups identified in Figure 5D. Flow cytometry–determined phenotypes in gene-edited leukemias are indicated on top of the bar graph; blue, ALLs; red, AMLs; green, MPALs. Lineages determined by protein expression pattern in CyTOF are listed at the bottom of each bar graph.
High-dimensional phenotype analysis of leukemias induced by gene-edited HSPCs. (A) Bar graphs summarize protein levels, as determined by CyTOF analysis of human patient MLLr leukemias and gene-edited leukemias. Control, Cas9-only treated human cells engrafted in mouse BM. (B) PCA plot shows the effective separation of patient leukemias into AML vs ALL lineages and a comparable separation in gene-edited leukemias. MPALs show overlapped clustering with AMLs. (C) UMAP plots show that the distributions of individual leukemia cells depend on the sample origins (left panel) and lineage phenotypes (right panel). Patient and gene-edited ALL cells reside mostly UMAP2 < 0, whereas patient AMLs, gene-edited AMLs, and MPALs cells reside UMAP2 > 0. (D) Hierarchical clustering of patient ALLs and AMLs based on their median protein expression. Two ALL and 4 AML reference groups are indicated at the bottom. Diagnostic phenotypes of patient leukemia samples are indicated on top of the heat map. (E) Hierarchical clustering of the percentage of cells in each sample associated with patient ALL and AML reference groups. The 6 colors represent the 2 ALL and 4 AML reference groups identified in Figure 5D. Flow cytometry–determined phenotypes in gene-edited leukemias are indicated on top of the bar graph; blue, ALLs; red, AMLs; green, MPALs. Lineages determined by protein expression pattern in CyTOF are listed at the bottom of each bar graph.
To determine the similarities between the gene-edited leukemias and lineage-matched human patient samples, we further analyzed the high-dimensional phenotypes. Principal component analysis (PCA) using median expression of all measured proteins in each sample clearly separated human ALLs from AMLs. Moreover, gene-edited leukemias shared PCA space with corresponding patient ALL and AML samples (Figure 5B). MPAL samples localized with AMLs, suggesting that their phenotype, as assayed here, is more similar to AMLs than to ALLs. The protein expression and their coexpression correlations from the bulk leukemia cells are shown in supplemental Figure 9. To examine the relationship between patient leukemias and gene-edited leukemias at the single-cell level, we performed a similar analysis using uniform manifold approximation and projection (UMAP).19 Visualizing individual cells demonstrated more diversity in phenotypes between the human patient leukemia cells and the gene-edited leukemia cells (Figure 5C, left panel), as well as demonstrated subpopulations with shared phenotypes between the gene-edited leukemias, primarily of different lineages (Figure 5C, right panel).
Given this apparent bulk phenotypic fidelity of gene-edited leukemia to primary human AMLs or ALLs, but the existence of shared phenotypic subpopulations, we directly classified individual cells in the gene-edited leukemias as AML-like or ALL-like to determine the composition of each gene-edited leukemia. We performed hierarchical clustering (ComplexHeatmap package)20 of the human primary ALL and AML patient samples and defined 6 reference ALL and AML groups (2 ALL and 4 AML groups) (Figure 5D). Then, using a previously described classification approach,18 each cell from the gene-edited leukemias was assigned to the most similar reference human leukemia group based on the shortest Mahalanobis distance estimated by its protein expression. Each gene-edited leukemia was a composite of cells that phenotypically could be categorized into the 6 primary leukemia groups with a small fraction of unclassified cells (Figure 5E). However, in each case, the majority of cells classified to a patient leukemia group consistent with the flow cytometry phenotype with the exception of MPAL, in which the majority of cells were most similar to the AML groups (Figure 5E).
Taken together, these data indicate that the leukemias induced by gene-edited human HSPCs recapitulate protein expression of human patient leukemias and that MLLr MPALs more closely share the phenotypic features of AMLs, not ALLs. However, within individual gene-edited leukemias, there exist cell populations that appear most similar to both primary AML cells and primary ALL cells, consistent with the known lineage plasticity of these leukemias, as observed clinically.
To assess whether secondary mutations were acquired in our gene-edited leukemias and contribute to leukemia development, targeted exome sequencing was performed using the TruSight Myeloid Sequencing Panel (Illumina).21,-23 Several single nucleotide variants were detected, most of which are not known to be recurrent or pathogenic (supplemental Table 5). However, a KRAS (G38A) mutation, which is known to occur in a subset of human MLLr leukemias,21,24,-26 was detected in 1 leukemia with a variable allele frequency of 0.13 (supplemental Figure 8). Sanger sequencing of the leukemia cells confirmed the presence of the mutation, which was undetectable in the original cord blood cells and cultured MLL-AF9 cells prior to transplant (supplemental Figure 10). These data support acquisition of the KRAS mutation in vivo during leukemia progression.
Discussion
In this study, we delivered CRISPR/Cas9 as RNPs into primary human HSPCs to induce chromosomal translocations and generate MLLr leukemias. This technical approach greatly enhanced the efficiency of chromosome rearrangement and MLL-AF9 fusion gene formation, generating MLLr translocated cells >5000 times more efficiently than previously achieved by TALEN-mediated genome editing.9,18 The markedly increased overall efficiency for inducing oncogenic translocations (approximately >1%) likely reflects, in part, the reduced toxicity of RNPs for transiently expressing endonucleases in primary HSPCs compared with plasmid, viral vectors, or messenger RNA, with less risk for uncontrolled viral integration and persistent DNA cleavage.15,27,28 The enhanced efficiency of translocation generation allowed for transplantation of increased numbers of translocation-bearing cells at earlier days postelectroporation (day 5) in xenotransplanted recipient mice, which developed leukemia with a 100% penetrance and markedly shortened latency. In fact, the efficiency was so high that recipient mice developed multiple simultaneous leukemias with a relatively short latency of 3 or 4 months. Future studies will be helpful to determine whether the enhanced efficiency will allow the use of fewer cells for electroporation and/or transplantation.
Highly efficient induction of leukemia in vivo enabled the study of early steps in leukemogenesis. Using gene-edited breakpoint junctions as clonal biomarkers, we observed robust clonal outgrowth of translocated cells in vitro and in vivo. Most notably, we observed a strong correlation between the length of time that freshly electroporated cells were maintained in culture (5 days vs 11 days) and the eventual lineage and latencies of the resulting leukemias. The skewing to myeloid lineage, increased latencies, and lower penetrance observed with increased times in culture prior to transplantation suggest a rapid depletion of the leukemia stem cell population with lymphoid potential. The identities of selective factors responsible for this early and rapid modulation of leukemia characteristics require further study, but they are likely to reflect, in part, the strong myeloid bias of the in vitro culture conditions using IL-3 and granulocyte colony-stimulating factor, among other cytokines, which are known to reduce stem cell potential.29,30 Regarding the clonal selection observed during progression in vivo, secondary mutations may serve a role, given the acquisition of an activating RAS mutation in 1 leukemia similar to that observed in a subset of patient MLLr leukemias. Secondary pathogenic mutations in other genes were not observed, again analogous to the simple mutational landscape of human MLLr leukemias, wherein the RAS pathway is the most frequent target for secondary mutations.31
Gene-edited leukemias displayed multilineage origins with features of ALLs, AMLs, or MPALs, often in the same mouse. Biphenotypic MPALs, which coexpress lymphoid and myeloid antigens on single cells, are a notable feature of human MLLr leukemias. CyTOF analysis of leukemias generated by gene editing showed that the presence of lineage-specific proteins was highly similar to human patient leukemias of comparable lineages. Notably, MLLr MPALs were most similar to AMLs in their overall phenotypic and functional features, suggesting a rationale for treating MLLr MPALs with comparable regimens used for AMLs. This contrasts with previous studies showing that MPALs with ZNF384 rearrangements are more similar to ALLs32 and suggested ALL-like therapy for MPAL leukemias.33 The differences suggest that genomic aberrations in MPALs may serve a major role in dictating their lineage features as predominantly either ALL or AML. Further systematic analysis of MPALs of different cytogenetic origins is required to further illuminate this issue and confirm that gene-edited leukemias provide valuable models for these and other translational studies of MLLr leukemias.
The full-text version of this article contains a data supplement.
Acknowledgments
The authors thank Sruthi Mantri (Binns Program for Cord Blood Research) for providing hUCB cells, Dana Bangs, Jesse Williams Jr., and Jason Erdmann (Cytogenetics Laboratory, Stanford Heathcare) for FISH and karyotype analyses, and Norm Cyr for graphical assistance. They acknowledge the Stanford Pediatrics Heme/Onc Division Tissue Bank and patients for providing clinical samples and thank members of the Cleary Laboratory for constructive discussions and comments.
This work was supported in part by research grants from the National Institutes of Health (National Cancer Institute) (M.L.C.), Alex’s Lemonade Stand Foundation (M.L.C.), the Lucile Packard Foundation for Children’s Health, the Child Health Research Institute, and Stanford National Institutes of Health–National Center for Advancing Translational Science–Clinical and Translational Science Awardgrant UL1 TR001085 (M.L.C.). M.H.P. thanks the Laurie Kraus Lacob Faculty Scholar Award for support.
Authorship
Contribution: J.J. designed and performed experiments, analyzed data, and wrote the manuscript; A.J. performed CyTOF experiments and P.D. and F.P. analyzed the data; M.P.-D. performed ddPCR and analyzed the data; L.G. performed targeted exome sequencing; M.I. and M.C.W. provided human patient and patient-derived xenograft samples; J.L.Z., M.H.P., and K.L.D. provided experimental guidance and helpful discussions; M.L.C. supervised the entire project; and all authors reviewed and edited the manuscript.
Conflict-of-interest disclosure: M.C.W. is employed by Genentech/Roche and holds stock and other ownership interests. The remaining authors declare no competing financial interests.
Correspondence: Michael L. Cleary, Department of Pathology and Pediatrics, Stanford University, Lokey Stem Cell Research Building, Room G2034, 1291 Welch Rd, Stanford, CA 94305; e-mail: mcleary@stanford.edu.

