

Key Points
Knockout of HoxA9-degrading myeloid granule proteases allows recording of a genome-wide HoxA9-binding pattern.
HoxA9 binds promoters and enhancers and drives a positive-feedback loop activating the HoxA locus, key oncogenes, and cell cycle drivers.

Abstract
Ectopic expression of the oncogenic transcription factor HoxA9 is a major cause of acute myeloid leukemia (AML). Here, we demonstrate that HoxA9 is a specific substrate of granule proteases. Protease knockout allowed the comprehensive determination of genome-wide HoxA9 binding sites by chromatin immunoprecipitation sequencing in primary murine cells and a human AML cell line. The kinetics of enhancer activity and transcription rates in response to alterations of an inducible HoxA9 were determined. This permitted identification of HoxA9-controlled enhancers and promoters, allocation to their respective transcription units, and discrimination against HoxA9-bound, but unresponsive, elements. HoxA9 triggered an elaborate positive-feedback loop that drove expression of the complete Hox-A locus. In addition, it controlled key oncogenic transcription factors Myc and Myb and directly induced the cell cycle regulators Cdk6 and CyclinD1, as well as telomerase, drawing the essential blueprint for perturbation of proliferation by leukemogenic HoxA9 expression.
Introduction
The clustered HOX-homeodomain transcription factors (TFs) are best known for their role during embryogenesis, determining the identity of whole body segments. In adults, these master regulators are reused to manage steady-state organogenesis through control of proliferation and differentiation of precursor cells. Generally, high-level HOX expression is correlated with an immature and proliferative phenotype. Consequently, HOX proteins have been found to be causally involved in tumorigenesis and metastasis in various solid and hematological malignancies (for reviews, see Alharbi et al,1 Eklund,2 and Shah and Sukumar3 ).
Increased transcription of the so-called abdominal HOX-A genes (HOXA7, HOXA9, HOXA10) is a hallmark of different genetic subtypes of acute myeloid leukemia (AML). MLL and CALM translocations, as well as NPM and ASXL1 mutations, induce a characteristic HOX signature, and a substantial percentage of copy number–normal myeloid leukemias are dominated by HOX overexpression. In addition, HOX–nuclear pore (NUP98) fusions cause myeloid leukemia.4 In general, HOXA9 expression is a significant predictor of poor survival in AML.5
Previous investigations of the mechanism underlying transformation of hematopoietic cells by HOX genes revealed that most of the HoxA proteins have an inherent transforming capacity.6 Overexpression of a single HoxA protein, predominantly HoxA9, blocked differentiation and increased self-renewing activity of primary hematopoietic stem and precursor cells (HSPCs). In vivo, this was sufficient to cause myeloproliferative disease, indicating that Hox proteins trigger a core-transforming program. Experimentally, full leukemia development required coexpression of Meis1, and the disease phenotype was further exacerbated by addition of Pbx3.7-10 These 2 proteins form complexes with abdominal Hox-A factors on DNA, increasing protein stability and binding affinities. Despite a relaxed preference for AT-rich sequences, the Hox-homeodomain determines binding specificity of the respective Hox protein, with the remaining portions mediating protein–protein interactions.11
Notwithstanding the important role of HoxA9 as a leukemogenic TF, little is known about downstream targets, and only a few genes important for malignant development have been identified. Best known is the myeloblastosis oncogene Myb, which is necessary, but not sufficient, for HoxA9-induced transformation.12 Other established HoxA9 targets include genes for the growth factor Igf1,13 the rho guanine nucleotide exchange factor Vav2,14 the kinase Pim1,15 miR-155,16 and the phagocyte-specific protein Gp91phox.17 Previous attempts at global identification of the HoxA9-dependent transcriptome by chromatin immunoprecipitation sequencing (ChIP-seq)18 achieved low enrichment rates, precluding a truly comprehensive cataloging of HoxA9 binding sites and, hence, direct target genes.
Here, we show that HoxA9 is extraordinarily sensitive to the activity of myeloid granule proteases, precluding efficient precipitation. This problem could be overcome by using protease-knockout cells, allowing complete insight into the mechanisms used by HoxA9 to perturb differentiation and proliferation of hematopoietic precursors.
Methods
DNA, cells, and inhibitors
Retroviral plasmids were constructed in pMSCV (Clontech, Palo Alto, CA) vectors. For chromatin immunoprecipitation (ChIP), an N-terminal triple-Flag tag or a C-terminal hemagglutinin (HA) tag was added to HoxA9 (NM_010456) complementary DNA by polymerase chain reaction (PCR). Inducible HoxA9-ER and Pbx3 constructs were described previously.6,7 Crispr/Cas9 plasmids were provided by Addgene (57828 and 83890).19,20 Retroviral packaging was done in Phoenix-E cells. HSPCs were isolated from bone marrow of C57BL/6 mice or mice with a triple knockout of Elane, Prtn3, and Ctsg,21 followed by selection for CD117 (Kit) with magnetic beads (Miltenyi Biotec, Bergisch Gladbach, Germany). HoxA9-transformed primary cells were maintained in RPMI 1640 (Thermo Scientific) supplemented with 10% fetal calf serum, penicillin-streptomycin, 5 ng/mL recombinant murine interleukin-3, interleukin-6, granulocyte-macrophage colony-stimulating factor, and 50 ng/mL recombinant murine stem cell factor (Miltenyi Biotec). THP1, Molm13, MV4;11, and 293T cells (ACC-16, ACC-554, ACC-102, ACC-635; DSMZ, Braunschweig, Germany) were cultivated without cytokines.
Purified elastase and protease inhibitors were purchased from Sigma (Taufkirchen, Germany).
ChIP-seq, cell lysis, and nascent RNA isolation
The core ChIP procedure was done as described22 with the following modifications for the individual samples. Replicate I: murine primary cells transformed by HoxA9-HA; cross-link, 1% formaldehyde for 10 minutes at room temperature; lysis buffer, 50 mM Tris/HCl pH 8.0, 10 mM EDTA, 100 mM NaCl, 1 mM EGTA, 0.1% sodium deoxycholate, 0.5% N-lauroylsarcosine, 1 mM phenylmethylsulfonyl fluoride (PMSF), and 1% Halt Complete Protease Inhibitor Cocktail (Pierce, Thermo-Fisher). Replicate II and MV4;11 cells: same as replicate I with lysis buffer consisting of 50 mM Tris/HCl pH 8.0, 10 mM EDTA, 1% sodium dodecyl sulfate (SDS), 1 mM PMSF, and 1% Halt Complete Protease Inhibitor Cocktail. Replicate III: same as replicate II, but cross-linking was done using 2 mM ethylene glycol bis(succinimidyl succinate) (Pierce, Thermo-Fisher) for 30 minutes at room temperature, followed by 1% formaldehyde for 15 minutes. Replicate IV: murine primary cells transformed by 3xFlag-HoxA9, cross-linked, and lysed like replicate II. Acetylation of H3K27 (H3K27ac) and monomethylation of H3K4 (H3K4me) ChIP were performed with a standard formaldehyde cross-link and SDS-based lysis buffers. Precipitation for all samples was performed with Protein G Magnetic Beads (#9006; Cell Signaling Technology). The following antibodies were used: anti-HA rabbit monoclonal (#3724; Cell Signaling Technology), 50 µl per 5 × 10⁶ cells; anti-Flag M2 (#F1804; Sigma), 5 µg per 5 × 10⁶ cells; anti-HOXA9, rabbit monoclonal (#140631, Abcam), 2 µl per 5 × 10⁶ cells; and anti-H3K27ac and anti-H3K4me rabbit monoclonal (#8173 and #5326; Cell Signaling Technology) each at 5 µl per 5 × 10⁶ cells.
Cell lysis for western blot analysis was done in 20 mM HEPES pH 7.5, 10 mM KCl, 0.5 mM EDTA, 0.1% Triton X-100, and 10% glycerol supplemented with 1 mM PMSF and 1% Halt Complete Protease Inhibitor Cocktail. Nascent RNA sequencing (RNA-seq) was done as described previously.23
Epigenome editing
Functional testing of enhancer elements in HSPCs transformed by HoxA9 was done by transduction with a lentiviral construct encoding a cleavage-defective dCas9 construct (#83890; Addgene; pLV-dCas9-KRAB-PGK-HygR), followed by hygromycin selection and subsequent infection with a single guide RNA (sgRNA; pMSCVzeo-BbsI; laboratory construct) or an empty control. RNA was isolated and quantified from bulk cultures after final antibiotic selection for 5 to 7 days.
Next-generation sequencing and bioinformatics
Sequencing libraries were prepared using NEBNext Ultra II reagents, including size selection, as recommended by the manufacturer (NEB, Ipswich, MA). Sequencing was done commercially on a HiSeq 4000 instrument by Source Bioscience (Oxford, United Kingdom), yielding 50–base pair (bp) single-end reads. Nascent RNA libraries were synthesized by nonstranded random priming according to standard Illumina procedures and sequenced in the in-house core facility on a HiSeq 2500 System as 100 bp single-end reads.
Data were mapped with BWA-MEM (0.7.17)24 to Mus musculus mm10 or Homo sapiens hg19 genomes. Reads mapping more than once were excluded by filtering for sequences with a mapping quality score >4. For visualization, BAM files were normalized and converted to TDF format with igvtools of the IGV browser package.25 Peak finding, motif analysis, and peak annotation were done with Homer (4.9.1).26 BAM files were converted to bigwig by deepTools (3.0.0, bamCoverage).27 Metagene plots were created with deepTools (3.0.0). Matrices were calculated with computeMatrix and plotted with plotHeatmap from the deepTools suite. RNA-derived reads were aligned with STAR (v020201)28 to the reference genome mm10, and reads derived from repetitive sequences were excluded by SAMtools (view)1.8.29 Transcripts were quantified by cuffdiff 2.2.130 and further analyzed with standard spreadsheet tools. Raw data are available in the European Bioinformatics Institute repository under accession numbers E-MTAB-7107 (RNA-seq) and E-MTAB-7108 (ChIP-seq).
Results
Inhibitor-resistant degradation of Hox proteins by myeloid granule proteases
ChIP requires cell lysis in epitope-conserving conditions. Yet, in exploratory experiments, precipitation of HoxA9 from myeloid cells was consistently inefficient. To explore the underlying reason, stability of HA-tagged HoxA9 was tested in standard cell extracts. Lysates were prepared from primary HSPCs transformed by HA-HoxA9 or from 293T cells transfected with the same construct. HoxA9 half-life in extracts was tested by taking aliquots at determined intervals, adding boiling SDS, and performing western blot analysis (Figure 1A). Strikingly, HoxA9 was completely degraded within 10 minutes in myeloblast extracts, despite supplementation with Complete Protease Inhibitor Cocktail and incubation at 0°C. In contrast, HoxA9 was stable in 293T extracts under identical conditions. Degradation was also observed for endogenous HOXA9 in human AML lines THP1 and Molm13, which carry a mixed lineage leukemia (MLL) translocation and, therefore, transcribe increased levels of HoxA9 RNA (Figure 1B). Next, we tested whether this unusual effect could be blocked by addition of a variety of protease inhibitors (2% fetal calf serum, 125 µM aprotinin, 1 mM AEBSF, 1 mM PMSF, 5 mg/mL 6-aminohexanoic acid, 100 µM antipain, 4 mM benzamidine HCl, 10 µM E-64, 1 mM N-ethylmaleimide, 10 µM phosporamidon, 20 µg trypsin inhibitor, 5 mM EDTA, 5 µg/mL alpha-1 antitrypsin). Neither inhibitor could prevent HoxA9 degradation (data not shown). In contrast, supplementation with 2 mM chymostatin (100 times the recommended concentration) stabilized HoxA9 (Figure 1C). Because chymostatin is a weak inhibitor of neutrophil elastase (Elane), we investigated whether this protease is involved in HoxA9 degradation. Addition of purified elastase or myeloblast extract to stable HoxA9 produced in 293T cells (Figure 1D) led to a similar and complete breakdown of HoxA9. Because myeloid cells synthesize 2 other proteases related to elastase, proteinase 3 (Prtn3) and cathepsin G (Ctsg), we explored whether these enzymes were contributing to the instability of HoxA9. For this purpose, HSPCs from homozygous Elane-knockout animals21 were transformed with HoxA9 and tested as before (supplemental Figure 1A); the results showed that deletion of Elane is not sufficient to stabilize HoxA9. To remove residual Prtn3 and Ctsg activities in these cells, they were further transduced with Crispr/Cas9 and with sgRNAs targeting Ctsg in exon 3 and Prtn3 in exon 2 (supplemental Figure 1B). Cells were antibiotics selected and subsequently single cells were subcloned and expanded for sequencing to verify a correct deletion. Deletion of all 3 proteases eliminated HoxA9 degradation (Figure 1E). This was confirmed in HSPCs from Elane/Prtn3/Ctsg (EPC) triple-knockout mice that also expressed stable HoxA9 (Figure 1F). To exclude Crispr/Cas9 off-target effects, EPC cells were used in subsequent ChIP experiments.
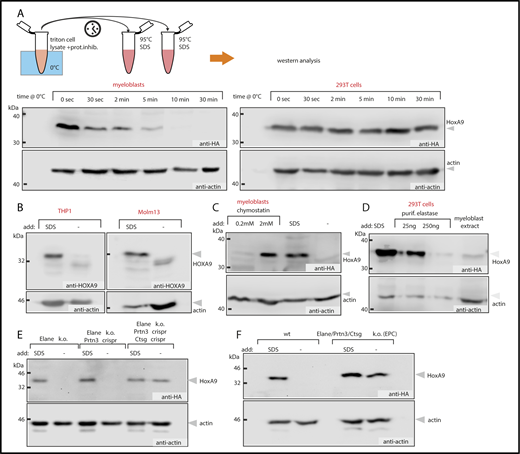
HoxA9 is degraded by neutrophil granule proteases. (A) HoxA9 is unstable in myeloblasts but not in epithelial cells. Triton-based lysates of primary murine bone marrow cells transformed by HA-tagged HoxA9 or extracts from 293T cells transfected with the same construct were incubated on ice with samples taken at the indicated time points, inactivated in hot SDS, and analyzed by western blotting. (B) HOXA9 is unstable in human AML cell lines. Extracts from THP1 and Molm13 cells derived from patients with MLL translocations and, therefore, expressing high levels of HOXA9, were extracted as above. Lysates were immediately denatured in SDS or incubated on ice for 10 minutes before western blot analysis for endogenous HOXA9. (C) High concentrations of the weak elastase inhibitor chymostatin inhibit HoxA9 degradation in myeloblast extracts. Triton-based extracts were produced from primary cells transformed by HA-tagged HoxA9 and supplemented with the indicated concentrations of chymostatin before western blotting. Controls were directly boiled in SDS before analysis. (D) Elastase degrades HoxA9. Extracts of 293T cells expressing HA-HoxA9 were supplemented with SDS or with different concentrations of purified elastase or were mixed 1:1 with myeloblast extract, as indicated. Lysates were incubated for 10 minutes on ice before western blotting. (E) HoxA9 is a substrate for elastase, proteinase 3, and cathepsin G. HoxA9-transformed primary HSPCs from Elane−/− mice were further deleted for Prtn3 and Ctsg by Crispr-based knockout. Lysates of individual cell lines were tested for HoxA9 stability, as above. (F) HoxA9 is stable in EPC triple-knockout myeloblasts. HoxA9-transformed cells from EPC or WT animals were lysed, and the stability of HoxA9 was tested as before.
HoxA9 is degraded by neutrophil granule proteases. (A) HoxA9 is unstable in myeloblasts but not in epithelial cells. Triton-based lysates of primary murine bone marrow cells transformed by HA-tagged HoxA9 or extracts from 293T cells transfected with the same construct were incubated on ice with samples taken at the indicated time points, inactivated in hot SDS, and analyzed by western blotting. (B) HOXA9 is unstable in human AML cell lines. Extracts from THP1 and Molm13 cells derived from patients with MLL translocations and, therefore, expressing high levels of HOXA9, were extracted as above. Lysates were immediately denatured in SDS or incubated on ice for 10 minutes before western blot analysis for endogenous HOXA9. (C) High concentrations of the weak elastase inhibitor chymostatin inhibit HoxA9 degradation in myeloblast extracts. Triton-based extracts were produced from primary cells transformed by HA-tagged HoxA9 and supplemented with the indicated concentrations of chymostatin before western blotting. Controls were directly boiled in SDS before analysis. (D) Elastase degrades HoxA9. Extracts of 293T cells expressing HA-HoxA9 were supplemented with SDS or with different concentrations of purified elastase or were mixed 1:1 with myeloblast extract, as indicated. Lysates were incubated for 10 minutes on ice before western blotting. (E) HoxA9 is a substrate for elastase, proteinase 3, and cathepsin G. HoxA9-transformed primary HSPCs from Elane−/− mice were further deleted for Prtn3 and Ctsg by Crispr-based knockout. Lysates of individual cell lines were tested for HoxA9 stability, as above. (F) HoxA9 is stable in EPC triple-knockout myeloblasts. HoxA9-transformed cells from EPC or WT animals were lysed, and the stability of HoxA9 was tested as before.
HoxA9 binds to cell type–specific promoters and enhancers
No hematopoietic abnormalities have been reported for elane, proteinase 3, cathepsin G (EPC) triple-knockout mice, and granule proteases are only active inside lysosomes during normal cellular physiology, removing them from nuclear TFs. We tested whether EPC bone marrow cells would show any difference from wild-type (WT) cells in transformation experiments (supplemental Figure 2A). In colony-forming cell assays, EPC HSPCs transduced by various epitope-tagged HoxA9 constructs behaved identically to WT cells, and permanent lines could be derived from EPC and WT cells with equal frequency and growth characteristics. In addition, we searched databases of human AML cell lines (biogps.org) with low expression of granule proteases and identified the 11q23 translocation line MV4;11 as a candidate. Biochemically, reduced granule protease expression resulted in only minimal degradation of endogenous HOXA9 in MV4;11 extracts (supplemental Figure 2B), and absent/low transcription of protease genes was confirmed by quantitative polymerase chain reaction (qPCR) (supplemental Figure 2C).
ChIP-seq was performed with epitope antibodies on 4 independent samples of EPC cells transformed with HA- or triple Flag–tagged HoxA9 processed under varying cross-linking/precipitation conditions (see “Methods”). For comparison and control, another ChIP-seq experiment was done in MV4;11 cells with antibodies against endogenous HOXA9. In general, there was an excellent congruency between replicates, as well as across species, as exemplified by the binding pattern surrounding the HoxA9 target Myb (Figure 2A). Proteolytic degradation of HoxA9 by proteases also occurred during ChIP, as confirmed by ChIP-qPCR experiments in EPC and WT controls (supplemental Figure 2D). In murine and human cells, HoxA9 binding occurred either in more extended domains visible at promoters or across actively transcribed regions and more defined peaks appeared at putative enhancer regions (see “Kinetics of H3K27 acetylation discriminates active from bystander enhancers”). The HoxA9 pattern was cell type specific, as revealed by comparison with a published HoxA9 ChIP-seq dataset recorded in murine T cells transformed by retroviral coexpression of mutated Jak3 and HoxA931 (supplemental Figure 2E-F). An extended region of HoxA9 covered the genes for the T-cell receptor subunits CD3gamma/delta in T cells, but binding was reduced or absent in myeloid cells. In contrast, Pim1, including associated enhancers, was occupied by HoxA9 across all cells.

Efficient and comprehensive ChIP-seq for HoxA9 is possible in myeloid cells from EPC mice and in a human cell line low in granule proteases. (A) Integrated Genome Viewer (IGV)–generated example of ChIP-seq profiles across the established HoxA9 target Myb. Results from murine cells (upper panel). Four replicate samples and an IgG control are shown. For comparison, HoxA9 precipitation data from T cells31 are included. Replicates I to III were prepared from EPC HSPCs transformed by HA-tagged HoxA9; for replicate IV, triple Flag–tagged HoxA9 was used. Chromatin was precipitated with anti-HA or anti-Flag antibodies. The color-coded ribbon represents a heat map of conservation between mammal species, with the highest conservation depicted in red. ChIP-seq results from human AML cell line MV4;11 that is naturally low in granule proteases (lower panel). Endogenous HOXA9 was precipitated by anti-HOXA9 antibodies. (B) Distribution of HoxA9 peaks across genomic elements. (C) De novo motif search across the 1000 top scoring and highest confidence HoxA9/HOXA9 peaks. Shown are all recurrent motifs with a significant homology to a consensus binding site for a TF (family) that occurred in >15% of all identified peaks. P values and frequency (%) are given. (D) Motif distribution across HoxA9/HOXA9 peaks, as in panel C. The localization of consensus sites with respect to the identified HoxA9/HOXA9 peak center is plotted. (E) The genomic sequence of HoxA9 peaks is conserved across higher mammals. The metagene plot depicts sequence-conservation scores of all HoxA9 peaks compared with 60 species of Euarchontoglires (a clade of mammals including rodents, lagomorphs, tree shrews, colugos, and primates; http://hgdownload.cse.ucsc.edu/goldenPath/mm10/phastCons60way/).
Efficient and comprehensive ChIP-seq for HoxA9 is possible in myeloid cells from EPC mice and in a human cell line low in granule proteases. (A) Integrated Genome Viewer (IGV)–generated example of ChIP-seq profiles across the established HoxA9 target Myb. Results from murine cells (upper panel). Four replicate samples and an IgG control are shown. For comparison, HoxA9 precipitation data from T cells31 are included. Replicates I to III were prepared from EPC HSPCs transformed by HA-tagged HoxA9; for replicate IV, triple Flag–tagged HoxA9 was used. Chromatin was precipitated with anti-HA or anti-Flag antibodies. The color-coded ribbon represents a heat map of conservation between mammal species, with the highest conservation depicted in red. ChIP-seq results from human AML cell line MV4;11 that is naturally low in granule proteases (lower panel). Endogenous HOXA9 was precipitated by anti-HOXA9 antibodies. (B) Distribution of HoxA9 peaks across genomic elements. (C) De novo motif search across the 1000 top scoring and highest confidence HoxA9/HOXA9 peaks. Shown are all recurrent motifs with a significant homology to a consensus binding site for a TF (family) that occurred in >15% of all identified peaks. P values and frequency (%) are given. (D) Motif distribution across HoxA9/HOXA9 peaks, as in panel C. The localization of consensus sites with respect to the identified HoxA9/HOXA9 peak center is plotted. (E) The genomic sequence of HoxA9 peaks is conserved across higher mammals. The metagene plot depicts sequence-conservation scores of all HoxA9 peaks compared with 60 species of Euarchontoglires (a clade of mammals including rodents, lagomorphs, tree shrews, colugos, and primates; http://hgdownload.cse.ucsc.edu/goldenPath/mm10/phastCons60way/).
Stringent peak calling yielded 24 470 HoxA9 peaks in murine cells (using replicate I with highest precipitation efficiency) and 36 437 peaks in human cells (Figure 2B; supplemental Tables 1 and 2). The distribution was very similar between species, with the majority of HoxA9 occurring in intergenic regions or introns marking potential enhancers. Of note, similar numbers of promoter-associated HoxA9 peaks appeared in murine (2978) and human (2101) samples. Thus, data generated from protease-knockout cells allow a more comprehensive assessment of HoxA9 biology than a previous study with WT cells,18 which detected only a minor portion (<10%) of the binding events observable in EPC cells (supplemental Figure 2G).
De novo motif discovery on the 1000 highest confidence, but otherwise unselected peaks, revealed a typical myeloid spectrum of consensus sequences for CEBP, PU.1, RUNX, and MYB (Figure 2C). Interestingly, MEIS1 sites were only significantly enriched in MV4;11. This is in line with the cellular etiology, because 11q23 translocations are known to deregulate HOXA9 and MEIS1 genes, whereas the murine sample was transformed by HoxA9 only. CEBP and HOX binding sites colocated at the peak center, accompanied by other consensus sequences in the neighborhood (Figure 2D). This was particularly prominent in MV4;11, in which HOX motifs dominated the peak midpoint and excluded the presence of other binding sites. HoxA9 peaks coincided with a high conservation of the respective sequence across higher mammals (Figure 2E). In summary, these data strongly argue for the authenticity of the observed HoxA9-binding events, placing HoxA9 into a collaborative environment where it controls gene expression in concert with a variety of other myeloid TFs.
HoxA9 regulates a subset of bound genes, including a core module shared with MLL fusions
It is not possible to infer genes under control of a TF by recording binding alone. Generally, physical association does not equal function. To identify genes whose transcriptional activity is significantly dependent on HoxA9, an inducible HoxA9 model was developed. HSPCs transformed by a tamoxifen-inducible HoxA9-ER fusion served to determine actual transcription rates by nascent RNA-seq. In this technique, newly synthesized RNA is labeled with 4-thiouridine, specifically isolated, and sequenced for quantification (Figure 3A). The kinetics of transcriptional changes in response to HoxA9 activity was recorded in the presence of active HoxA9-ER (0 hour) and at 8, 16, 24, 48, and 72 hours after inactivation of HoxA9 by removal of TAM. These time points were well before HoxA9-ER cells entered terminal differentiation and proliferation arrest (supplemental Figure 3A), thus capturing the initial HoxA9-controlled events. These and the following experiments were conducted in WT cells to exclude any potential unwanted influence of the protease loss on HoxA9 half-life. In total, 11 652 expressed transcripts (reads per kilobase million [RPKM] at 0 hours > 1) could be detected. HoxA9 activated and repressed about equal numbers of genes (1509 activated, 1429 repressed) (Figure 3B; supplemental Table 3). Interestingly, 65 genes under HoxA9 control had been identified previously23 as direct targets of the leukemogenic MLL-ENL fusion protein (Figure 3C). With few exceptions, there was a good correlation between the amplitude and direction of regulation by HoxA9 and MLL-ENL, marking these genes as a possible core set driving myeloid transformation.
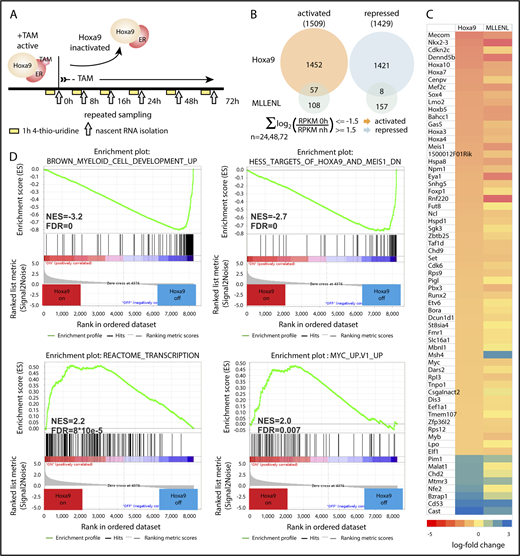
HoxA9-regulated genes can be identified by nascent RNA-seq. (A) Schematic description of sample generation. HSPCs of WT mice transduced with a tamoxifen (TAM)-inducible HoxA9-ER fusion were used for these experiments. Cells were supplemented for 1 hour with 4-thiouridine at the indicated time points, and labeled RNA was isolated and sequenced to determine actual transcription rates in the presence of functional HoxA9 (0 hours), as well as after cessation of HoxA9 activity. (B) Venn diagram. Activated and repressed genes were defined at 24, 48, and 72 hours by a cumulated log2 fold change in transcription rate >1.5 (transcript up after inactivation of HoxA9 = repressed by HoxA9) or a cumulated log2 fold change in transcription rate less than −1.5 (transcript down in the absence of HoxA9 = activated by HoxA9). The overlap with 165 direct target genes of MLL-ENL, as identified previously,23 is indicated. (C) The 65-gene HoxA9/MLL-ENL core signature. Heat map illustrates transcript changes 72 hours after inactivation of the respective oncogene. Red hues correspond to active genes, and blue colors designate repressed genes. (D) Gene set enrichment analysis of the HoxA9-on vs HoxA9-off (72 hours) gene-expression signatures. Normalized enrichment scores (NES) and false-discovery rates (FDS) are given.
HoxA9-regulated genes can be identified by nascent RNA-seq. (A) Schematic description of sample generation. HSPCs of WT mice transduced with a tamoxifen (TAM)-inducible HoxA9-ER fusion were used for these experiments. Cells were supplemented for 1 hour with 4-thiouridine at the indicated time points, and labeled RNA was isolated and sequenced to determine actual transcription rates in the presence of functional HoxA9 (0 hours), as well as after cessation of HoxA9 activity. (B) Venn diagram. Activated and repressed genes were defined at 24, 48, and 72 hours by a cumulated log2 fold change in transcription rate >1.5 (transcript up after inactivation of HoxA9 = repressed by HoxA9) or a cumulated log2 fold change in transcription rate less than −1.5 (transcript down in the absence of HoxA9 = activated by HoxA9). The overlap with 165 direct target genes of MLL-ENL, as identified previously,23 is indicated. (C) The 65-gene HoxA9/MLL-ENL core signature. Heat map illustrates transcript changes 72 hours after inactivation of the respective oncogene. Red hues correspond to active genes, and blue colors designate repressed genes. (D) Gene set enrichment analysis of the HoxA9-on vs HoxA9-off (72 hours) gene-expression signatures. Normalized enrichment scores (NES) and false-discovery rates (FDS) are given.
Gene set enrichment analysis (Figure 3D) corroborated the block of differentiation inflicted by HoxA9, because lineage-specific genes were expressed only after HoxA9 inactivation. An MYC signature and signs of high transcriptional activity dominated cells with active HoxA9. Other significant similarities with RNA_Pol_I reactomes and KEGG_Ribosome patterns (supplemental Figure 3B) were driven mainly by the HoxA9-dependent regulation of histone and ribosomal genes.
Kinetics of H3K27 acetylation discriminates active from bystander enhancers
Because enhancers can be remote from their cognate transcription units, it is not possible to assign a regulatory function by assessing its distance from a gene alone. A prime example is the Myc gene, whose major hematopoietic enhancer is located >1.5 Mbp downstream of the actual gene.32 Yet, if an enhancer responds significantly to HoxA9, this should result in changes in chromatin modification and, thus, permit discrimination of HoxA9-controlled elements from those for which HoxA9 has no or only a minor contribution. Therefore, H3K4me and H3K27ac, as marks for poised and active enhancers, respectively, were determined by ChIP-Seq in HoxA9-ER cells at 0 and 72 hours after HoxA9 activity ceased (Figure 4A). H3K4me and H3K27ac flanked the great majority of HoxA9 sites, but HoxA9 peak strength was only loosely correlated with H3K27ac/H3K4me modification (supplemental Figure 4A). This is consistent with a regulatory role for HoxA9 only at a subset of all occupied regions. Consequently, global chromatin modifications did not change significantly after inactivation of HoxA9. In contrast, on a local scale, putative control regions that altered their modification in concert with HoxA9 activity could be readily identified (eg, for Myc and its enhancer) (Figure 4B-C, upper panel; supplemental Figure 4B). Transcript rates, H3K27ac modification, and enhancer RNA production dropped to ∼50% after Hox inactivation. In line with H3K27ac indicating active enhancers and H3K4me labeling “poised” enhancers, H3K27ac variations were far more pronounced than those for H3K4me. A similar situation was seen for the putative enhancers upstream of Myb in the 3′ part of the Ahi1 locus (supplemental Figure 4C). Generally, genes that responded more strongly to HoxA9 also exhibited more pronounced changes in enhancer acetylation (eg, Hmga2) (Figure 4C, middle panel). The correlation of H3K27ac and transcript levels also held true for HoxA9-repressed genes, as illustrated by Lcn2, a gene that is normally present only in mature granulocytes (Figure 4C, lower panel). Promoter acetylation, as well as modification of a potential upstream enhancer, increased after inactivation of HoxA9, whereas this mark did not change for the neighboring promoter of Ptges2 that is occupied, but not regulated, by HoxA9. In total, only ∼40% of all H3K27 acetylated regions (16 414/41 309) responded to a change in HoxA9 activity, with a significant (fold change >2) upregulation or downregulation of this modification (Figure 4D).
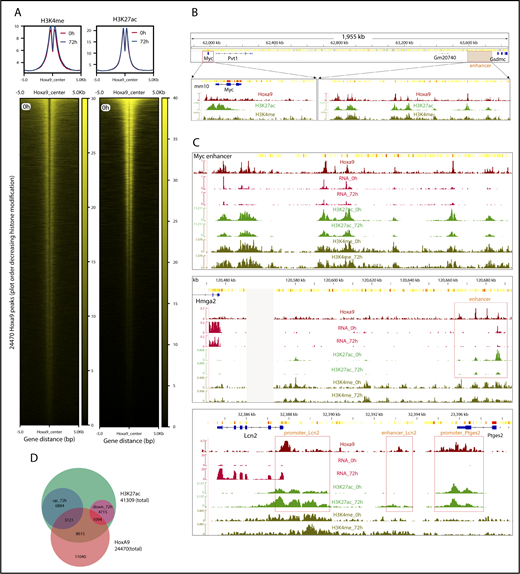
ChIP-seq for H3K4me and H3K27ac assigns potential enhancers to transcripts under control of HoxA9. (A) Metagene plot and occupation heat map of H3K4me and H3K27ac around all 24 470 identified HoxA9 peaks at 0 hours (Hox active) and 72 hours (Hox inactive). Heat maps are drawn for 0 hours only. H3K4me and H3K27ac profiles were determined in WT cells transformed by HA-tagged HoxA9. (B) HoxA9 coincides with H3K4me and H3K27ac at promoters and enhancers. The example covers the Myc gene and its known32 enhancer ∼1.5 Mbp downstream. (C) Transcript response to HoxA9 correlates predominantly with H3K27ac in enhancers and promoters. Enhancer modifications change in response to HoxA9 activity (top panel). The situation at the Myc enhancer is shown at 0 hours (Hox on) and 72 hours (Hox off). HoxA9 ChIP, nascent RNA-seq, H3K27ac, and H3K4me IGV tracks are depicted. HoxA9 regulation allows association of enhancers with their cognate genes (middle panel). The example depicts the situation for Hmga2, in which a putative upstream enhancer is occupied and regulated by HoxA9. IGV tracks shown are as above. H3K27ac kinetics faithfully predicts HoxA9 activity (bottom panel). The intergenic region between Lcn2, a transcript repressed by HoxA9, and Ptges2, a gene bound, but not regulated, by HoxA9 is displayed. Please note that Ptges2 transcript abundances are too low to be visible in the RNA tracks at the scale necessary to visualize Lcn2 upregulation after inactivation of HoxA9. Potential promoter/enhancer sites are boxed. (D) Most HoxA9 sites are not involved in gene regulation. The Venn diagram depicts the numbers of acetylated regions changing modification density by ≥twofold 72 hours after inactivation of HoxA9 and the respective overlap with HoxA9 peaks.
ChIP-seq for H3K4me and H3K27ac assigns potential enhancers to transcripts under control of HoxA9. (A) Metagene plot and occupation heat map of H3K4me and H3K27ac around all 24 470 identified HoxA9 peaks at 0 hours (Hox active) and 72 hours (Hox inactive). Heat maps are drawn for 0 hours only. H3K4me and H3K27ac profiles were determined in WT cells transformed by HA-tagged HoxA9. (B) HoxA9 coincides with H3K4me and H3K27ac at promoters and enhancers. The example covers the Myc gene and its known32 enhancer ∼1.5 Mbp downstream. (C) Transcript response to HoxA9 correlates predominantly with H3K27ac in enhancers and promoters. Enhancer modifications change in response to HoxA9 activity (top panel). The situation at the Myc enhancer is shown at 0 hours (Hox on) and 72 hours (Hox off). HoxA9 ChIP, nascent RNA-seq, H3K27ac, and H3K4me IGV tracks are depicted. HoxA9 regulation allows association of enhancers with their cognate genes (middle panel). The example depicts the situation for Hmga2, in which a putative upstream enhancer is occupied and regulated by HoxA9. IGV tracks shown are as above. H3K27ac kinetics faithfully predicts HoxA9 activity (bottom panel). The intergenic region between Lcn2, a transcript repressed by HoxA9, and Ptges2, a gene bound, but not regulated, by HoxA9 is displayed. Please note that Ptges2 transcript abundances are too low to be visible in the RNA tracks at the scale necessary to visualize Lcn2 upregulation after inactivation of HoxA9. Potential promoter/enhancer sites are boxed. (D) Most HoxA9 sites are not involved in gene regulation. The Venn diagram depicts the numbers of acetylated regions changing modification density by ≥twofold 72 hours after inactivation of HoxA9 and the respective overlap with HoxA9 peaks.
HoxA9 drives a positive-feedback loop
Further analysis uncovered binding of HoxA9 to 3 major areas in the HoxA locus itself (Figure 5A). HoxA9 located to 2 putative enhancers upstream of HoxA1 and HoxA6, as well as to the HoxA9 promoter itself. These peaks were highly conserved in MV4;11. In mouse cells, HoxA9 binding to its own promoter was partially obscured by a ChIP artifact triggered by precipitation of HoxA9 provirus sequences, causing artificially high read count across the translated HoxA9 exons. Nascent RNA-seq revealed that HoxA9 controls transcription of the complete locus, with an emphasis on posterior Hox genes (Figure 5B). Because RPKM data for HoxA9 are a compound of endogenous and proviral expression, a selective qPCR was performed, revealing that endogenous, but not viral, HoxA9 is regulated by HoxA9 (Figure 5B, right panel). Examination of nascent RNA profiles that allow discrimination of endogenous and viral/exon-only transcripts supported this autoregulation (supplemental Figure 5A).

HoxA9 controls itself and the Hox-A locus. (A) Overview of the Hox-A locus in mouse and human genomes with conserved Hox/HOXA9 binding sites and associated nascent RNA and H3K27ac profiles. Potential HoxA9-dependent regulatory regions are boxed and labeled as follows: a1_put_enh = HoxA1 putative enhancer, a4_ac_reg = HoxA4 acetylated region, a6_put_enh = HoxA6 putative enhancer, a9_prom = HoxA9 promoter. For a detailed explanation, see the text and supplemental Figure 5. (B) Hox-A transcription is under control of HoxA9. Kinetics of nascent RNA Hox production after cessation of HoxA9 activity (left panel). RPKM values are shown. Differential qPCR for endogenous and viral-derived HoxA9 RNA (right panel). Expression was normalized to β-actin as a housekeeping gene, and it is plotted as relative value with 0 hours set to 1 unit. (C) Principle of epigenome editing by dCas9-KRAB. Targeting of a catalytically inactive Cas9-KRAB fusion to a specific locus by an sgRNA creates local heterochromatin through recruitment of a repressor complex.20 (D) Epigenome editing of HoxA1/A6 putative enhancers affects expression of anterior Hox-A genes. Expression levels of all Hox-A genes were recorded by qPCR in cells expressing sgRNAs targeting the HoxA1/A6 putative enhancers and a dCas-KRAB fusion or dCas-KRAB alone, as a control, as indicated. Relative expression normalized to β-actin is shown, with control expression set to 1 unit. (E) Pbx3 limits Meis1 protein availability. Nascent RNA production of Meis1 and Pbx3 RNAs in response to HoxA9 (upper panel). Western blot analysis of HoxA9-transformed cells virally coexpressing Pbx3 or vector only as control (lower left panel). qPCR quantification of Meis1 RNA in the same cells (lower right panel). HP1, heterochromatin protein 1; KAP1, KRAB-associated protein 1; KRAB, Krüppel-associated box; SETDB1, H3K9 methyltransferase.
HoxA9 controls itself and the Hox-A locus. (A) Overview of the Hox-A locus in mouse and human genomes with conserved Hox/HOXA9 binding sites and associated nascent RNA and H3K27ac profiles. Potential HoxA9-dependent regulatory regions are boxed and labeled as follows: a1_put_enh = HoxA1 putative enhancer, a4_ac_reg = HoxA4 acetylated region, a6_put_enh = HoxA6 putative enhancer, a9_prom = HoxA9 promoter. For a detailed explanation, see the text and supplemental Figure 5. (B) Hox-A transcription is under control of HoxA9. Kinetics of nascent RNA Hox production after cessation of HoxA9 activity (left panel). RPKM values are shown. Differential qPCR for endogenous and viral-derived HoxA9 RNA (right panel). Expression was normalized to β-actin as a housekeeping gene, and it is plotted as relative value with 0 hours set to 1 unit. (C) Principle of epigenome editing by dCas9-KRAB. Targeting of a catalytically inactive Cas9-KRAB fusion to a specific locus by an sgRNA creates local heterochromatin through recruitment of a repressor complex.20 (D) Epigenome editing of HoxA1/A6 putative enhancers affects expression of anterior Hox-A genes. Expression levels of all Hox-A genes were recorded by qPCR in cells expressing sgRNAs targeting the HoxA1/A6 putative enhancers and a dCas-KRAB fusion or dCas-KRAB alone, as a control, as indicated. Relative expression normalized to β-actin is shown, with control expression set to 1 unit. (E) Pbx3 limits Meis1 protein availability. Nascent RNA production of Meis1 and Pbx3 RNAs in response to HoxA9 (upper panel). Western blot analysis of HoxA9-transformed cells virally coexpressing Pbx3 or vector only as control (lower left panel). qPCR quantification of Meis1 RNA in the same cells (lower right panel). HP1, heterochromatin protein 1; KAP1, KRAB-associated protein 1; KRAB, Krüppel-associated box; SETDB1, H3K9 methyltransferase.
Whereas HoxA9 binding to its own promoter clearly would exert autocontrol, regulation of remote Hox genes must be due to other elements. This is especially true for anterior genes (HoxA1 to HoxA6), because this portion of the Hox locus is segregated into an independent topologically associated domain and, therefore, is insulated from posterior genes (HoxA9 to HoxA13).33 To investigate whether 2 putative enhancers close to HoxA1 and HoxA6 are responsible for this regulation, epigenome editing20 was performed (Figure 5C). A catalytically defunct Cas9 fused to the KRAB repressor domain was targeted by sgRNAs to the centers of the HoxA9 peaks in the putative anterior Hox enhancers. This will recruit a repressor complex, establishing a localized area of heterochromatin perturbing access to DNA. Targeting either the HoxA1 or HoxA6 enhancer region significantly reduced expression of anterior Hox genes and the associated enhancer marks H3K27ac and H3K4me (Figure 5D; supplemental Figure 5B), with the exception of HoxA5 or HoxA4 and HoxA5, respectively. The escape of HoxA4/5 from the influence of the enhancer “knockdown” correlated with the presence of an additional H3K27 acetylated region with only marginal HoxA9 binding that may constitute an additional unrecognized (and largely HoxA9-independent) control element.
We also noted that the gene for the Hox-interacting protein Meis1 was under control of HoxA9 (Figure 5E; supplemental Figure 5C). This posed a conundrum, because coexpression of Meis1 and HoxA9 is required for rapid and efficient leukemogenesis, whereas HoxA9 alone causes myeloproliferative disease, with leukemia developing only after protracted latency. Therefore, significant transcription of Meis1 under HoxA9 control seemed counterintuitive. A potential solution to this problem was the limiting availability of Pbx3, a protein that has been shown to be essential for posttranslational stabilization of Meis1.7 Indeed, although there was some level of influence of HoxA9 on Pbx3 expression (supplemental Table 1), overall transcript rates for this gene were marginal, limiting protein production and, therefore, Meis1 stability. This was confirmed by ectopic expression of Pbx3 that concomitantly increased Meis1 protein by threefold (Figure 5E, lower panel) and also boosted Meis1 transcription by 50% because Hox/Meis/Pbx3 trimers possess increased DNA affinity.
High proliferation rates correlate with HoxA9-dependent cell cycle control
Most oncogenes eventually impinge on cell cycle regulation. HoxA9-transformed cells have a high division rate in culture, and aggressive AML is known to be a rapidly growing malignancy. To determine whether HoxA9 drives these phenotypes, we searched for cell cycle–related genes under control of HoxA9. We could identify the G1-type cyclin-dependent kinase Cdk6, its cognate cyclin D1 (Ccnd1), and, importantly, the RNA component of Terc as HoxA9 targets (Figure 6A). All corresponding genes displayed species-conserved HoxA9 binding at the promoter or in H3K27ac-modified putative enhancer regions. Because the presence of Terc is the limiting factor for telomerase activity,34 these 3 genes are likely at the core of a HoxA9-sustained cell cycle entry and proliferation circuit.

HoxA9 directly regulates cell cycle control genes. (A) Genomic environment, HoxA9 binding, RNA production, and H3K27ac status of cyclin-dependent kinase 6 (Cdk6), cyclin D1 (Ccnd1), and telomerase RNA component (Terc) loci. The line graph shows transcription rates of these genes in response to HoxA9 activity. (B) Core pathways of transformation by HoxA9.
HoxA9 directly regulates cell cycle control genes. (A) Genomic environment, HoxA9 binding, RNA production, and H3K27ac status of cyclin-dependent kinase 6 (Cdk6), cyclin D1 (Ccnd1), and telomerase RNA component (Terc) loci. The line graph shows transcription rates of these genes in response to HoxA9 activity. (B) Core pathways of transformation by HoxA9.
Discussion
A comprehensive analysis of the HoxA9-induced oncogenic program in myeloid cells with modern methods has been challenging. Whereas high-quality HoxA9-binding profiles have been published for T cells,31 available ChIP data in myeloid cells18 suffer from low enrichment rates and suboptimal signal/noise ratios. Here, we show that this is due to the unexpected and unusual degradation of HoxA9 by granule proteases. These enzymes are normally involved in innate immune defense after mature cells degranulate and release active proteases into the extracellular space to attack infectious agents. Consequently, these enzymes have been mainly studied in the context of infection or inflammation and as driving factors for smoking-induced chronic obstructive pulmonary disease.35 Conspicuously, the genes for Elane, Prtn3, and Ctsg are expressed in early myeloid precursor cells, with Prtn3 particularly detectable in the earliest long-term hematopoietic stem cell, long before any myeloid commitment is made (blood.stemcells.cam.ac.uk/genemap.html; supplemental Figure 6). It is striking that the expression domain of granule proteases during hematopoietic differentiation overlaps with HoxA9, which is also prevalent in precursor cells. Yet, under normal laboratory conditions, triple protease–knockout mice do not show any obvious hematopoietic phenotype, and we did not observe any significant difference between protease-deficient and normal HSPCs in culture. The biological reason for the extraordinary sensitivity of HoxA9 toward myeloid granule proteases remains to be established.
Circumventing the degradation problem, we could establish a high-confidence and genome-wide HoxA9-binding pattern. The fact that HoxA9 proteolysis also affects ChIP efficiency indicates that all previous studies (eg, Huang et al18 ) in myeloid precursors identified, at best, only a fraction of the true binding events. As expected, HoxA9 cooperated with other myeloid TFs, such as Cebp/α, Pu.1, Runx, and Myb. The combinatorial nature of the regulatory potential poses a challenge, because it precludes extrapolating Hox control solely from Hox presence, even if an activity mark like H3K27ac can be detected. Redundancy is a common theme among TFs, and knockdown studies demonstrated that loss of a single TF usually affects only the function of a small fraction of its total binding sites.36 Recording activity changes for enhancers and transcript rates in response to HoxA9 simultaneously permitted identification of genuinely functional elements and allowed a high-confidence alignment of genes with their cognate enhancers based on function and not on distance, a measurement that is frequently misleading.37 Proximity to the next transcribed gene would not have identified the enhancers for Myc or Myb, 2 important oncogenic drivers. Only incorporating the dynamics of H3K27ac changes in response to TF activity gives crucial information that permits the detection of high-probability candidate regions for true functional elements. The importance of eliminating protease degradation for a comprehensive identification of HoxA9 targets in myeloid cells was also corroborated by an article that became available during revision of this manuscript.38 Despite a comparable assay system, Sun et al only discovered about 25% of the HoxA9 peaks detectable in a protease-negative cell, a fact likely precluding recognition of Hox autoregulation and the direct links to cell cycle and immortalization.
In essence, the data presented characterize HoxA9 as a switch that flips a cell into a self-perpetuating proliferating state. It triggers the pleiotropic oncogenes Myc and Myb and directly impinges on cell cycle entry through expression of Cdk6, CyclinD1, and telomerase RNA, while simultaneously providing necessary accessory factors (eg, histones, ribosomes) to sustain rapid proliferation (Figure 6B). With a comprehensive overview of the HoxA9 “regulome” now available, a future challenge will be to identify suitable targets for pharmaceutical intervention.
The data reported in this article have been deposited in the European Bioinformatics Institute repository (accession numbers E-MTAB-7107 and E-MTAB-7108).
The full-text version of this article contains a data supplement.
Acknowledgments
The authors thank Renate Zimmermann for technical assistance. The advice provided by Sven Heinz (University of California, San Diego) and Michael Rehli (University of Regensburg) on bioinformatic analysis is acknowledged.
This work was supported by research funding from Deutsche Forschungsgemeinschaft (grant SL27/8-1) (R.K.S.) and the Chinese Scholarship Council (X.Z.). M.R. acknowledges funding from the University Medical Center Mainz, University of Mainz (grant CRC156 TP A05).
Authorship
Contribution: X.Z., A.P., J.S., M.-P.G.-C., and R.K.S. performed and analyzed experiments; M.R. provided Elane-knockout mice; A.B. made EPC bone marrow samples available; X.Z. and R.K.S. analyzed data; R.K.S. conceived and supervised experiments and wrote the manuscript; and all authors read and discussed the manuscript.
Conflict-of-interest disclosure: The authors declare no competing financial interests.
The current affiliation for J.S. is Kinderwunsch Centrum, Munich, Germany.
Correspondence: Robert K. Slany, Institute for Genetics, University Erlangen, Erwin Rommel Str 3, 91058 Erlangen, Germany; e-mail: robert.slany@fau.de.

